Writing the recipe for success in ingredients sourcing - ADAPTING TO THE NEW NORMAL
←
→
Page content transcription
If your browser does not render page correctly, please read the page content below
ADAPTING TO THE NEW NORMAL

Writing the
recipe for success
in ingredients
sourcing

                    MINTECGLOBAL.COM
Adapting to the new normal:
INTRODUCTION
               Writing the recipe for success in ingredients sourcing
               Although the world has weathered the initial wave of COVID-19, the pandemic continues to cast a long
               shadow over global commodity markets, with the food and beverage sector feeling a particular pinch.

               Like nearly every industry across the globe, border closures, quarantine measures, and labor sourcing
               struggles caused procurement teams in the food and beverage sector to reevaluate their supply chain
               positioning and sourcing strategies. Only a few months on and the foodservice closures that drastically
               reduced demand for commodities and sent prices plummeting has in large part reversed course, and
               now manufacturers and foodservice alike are faced with rising prices and an uncertain future that
               makes planning for next ‘quarter’s purchases anything but a trivial task.

               When markets were turned upside-down in March, globally traded food commodities dropped 4.3%
               on average, according to the Food and Agriculture Organization of the United Nations (FAO). Over the
               summer, deteriorating conditions in many countries beset by the virus pushed prices down further
               with certain commodities like sugar recording prices that dipped to the lowest point in years. Although
               a fire sale would appear to have been the optimal moment for companies to pad inventories, many
               procurement teams were unable to take advantage of this worldwide discount. Instead, they are left
               searching for advantageous deals in a market that is trending upward.

                                As the pandemic changes our shopping habits, food manufacturers have to ensure
                                they have adequate stock coverage amid the demand uncertainty. Coupled with the
                                currency fluctuations, the buying departments have a difficult task on their ‘ hands.

               With governments across the world, lifting measures restricting transport, trade, and dining, the soft
               commodities market is beginning to recover. However, the recovery is not evenly distributed due to
               differing geopolitical constraints and currency pressures. To help navigate the complex task of sourcing
               ingredients and better understand these pricing trends against benchmarks, the Mintec Analytics
               platform offers its Mintec Benchmark Prices (MBP) to provide real-time pricing data as part of more
               than 14,000 food ingredients.

               Global sourcing requires a layered approach................................................................................................................... 4
CONTENTS

               Coffee................................................................................................................................................................................................................................................... 4

               Cocoa.....................................................................................................................................................................................................................................................7

               Sugar...................................................................................................................................................................................................................................................... 8

               Vanilla................................................................................................................................................................................................................................................... 10

               Mascarpone................................................................................................................................................................................................................................11

               Making it better for consumers................................................................................................................................................................ 12
Mintec Data Coverage
Price data on exchange-traded commodities is just the tip of the iceberg.

        GRAINS          METALS           SUGAR             OIL

        DAIRY            MEAT           CHICKEN          SPICES

   Hard to find data on               Mintec brings you transparency

                                      650
                                      with independent insight into more than
  non exchange-traded
    commodities often
       represents your
        biggest spend.                Commodity types
                                      Mintec helps you to integrate commodity
                                      price data across your organisation faster
                                      and easier, saving you time and effort.

                 MINTECGLOBAL.COM/PRICE-DATA
Global sourcing requires a layered approach
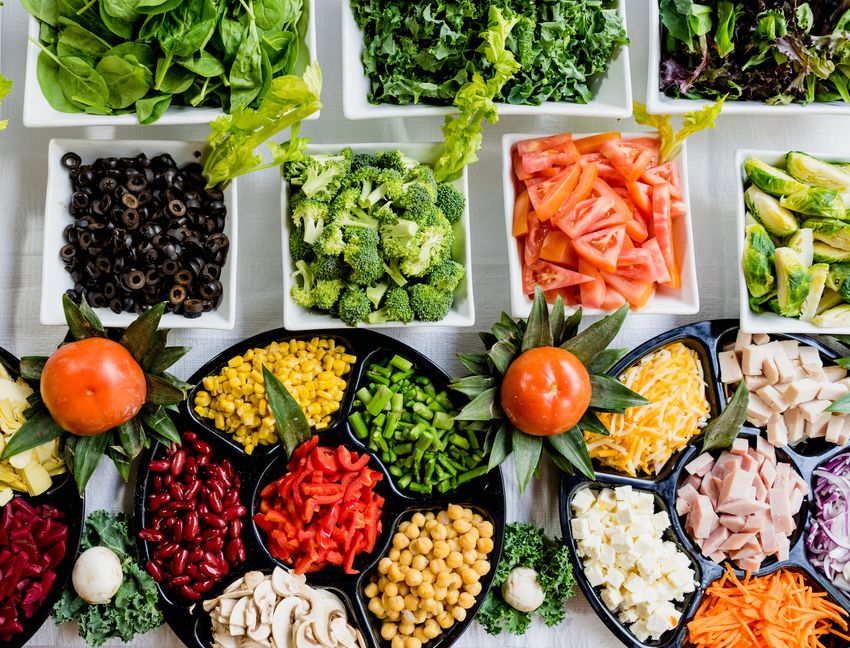
Much like the layers of a tiramisu, building a product that has an appealing price point, quality ingredients,
and stable production requires one to parse through the layers of a recipe. Time and again, it has proved
advantageous to take the time to unpack the individual components of this classic dessert and understand how
a simple adjustment in sourcing or ingredient substitution can make the difference between surviving the New
Normal and thriving under these conditions.
Coffee
Late last year, coffee consumption was already predicted to overtake production in 2020, per a report from
the International Coffee Organization and valuations were on the way up after hitting rock-bottom lows
in more than a decade, according to The Wall Street Journal. Despite this, views of a large on-cycle crop in
Brazil kept coffee reverting back to ten-year lows.
In April, fear of trade restrictions and availability caused manufacturers to frontload coffee orders in the
spot market, which caused prices to jump more than 15%. At the same time that escalated demand was
ratcheting up the cost of this commodity on the nearby, East Africa was fending off a locust invasion that
disrupted harvests and lockdowns in Colombia limited migrant labor in the midst of harvest season. With
several years of low coffee prices behind us, lower yields were forecast in many growing areas across Latin
America. This trifecta of global conditions only served to further push up differentials as buyers anticipated
upcoming shortages in the summer and fall. That spot buying started to impact nearby futures prices in July
as dwindling certified stock levels became the talk of traders, falling to their lowest levels in nearly 20 years.
Now the future has arrived, and though stock issues remain forefront and availability from Latin America
(outside Brazil) before their harvests is keeping diffs firm, the NY price has come back down given the huge
Brazil crop. At its peak in early September, the exchange price had jumped 39% year-on-year. However, the
labor restrictions that resulted from lockdowns did not affect only Brazil. Vietnam, Colombia, and Indonesia
were all faced with harvest seasons that lacked a labor force. Origin premiums have nearly doubled in
some areas, until the new crop season later this year is anticipated to alleviate supply concerns,
per Mintec price data.
Copyright © 2020 Mintec Limited 4
For those baking a tiramisu, though, the quality of coffee is not of paramount concern, and Robusta coffee
                     offers an alternative solution for buyers seeking an addition of flavor rather a cup of specialty coffee. According
                     to World Bank and Mintec, Arabica and Robusta prices diverged in recent months, with the spread between
                     the two at 50 cents/lb. Robusta prices are expected to decline by more than 7% in 2020 before experiencing
                     a modest recovery in 2021 when increased exports from Vietnam are anticipated to level the market, and
                     Vietnamese diffs will remain supported through at least the end of the harvest in a few months. Mintec data
                     supports this analysis but shows that price recovery will begin in the fourth quarter of this year. Already,
                     September saw a significant increase in the London Robusta price (up 15% from the lows of May/June).

                                                                                                                                                                                                      Source Mintec Analytics
                            Coffee arabica ICE NY US - C/lbs
bica ICE NY US - C/lbs
                  140

                            120

                            100

                             80

                             60

                             40
                                  Oct       Nov     Dec       Jan     Feb        Mar   Apr    May       Jun      Jul      Aug      Sep       Oct     Nov      Dec      Jan      Feb   Mar       Apr   May     Jun    Jul   Aug    Sep
Dec     Jan   Feb    Mar     Apr   May  Jun Jul  Aug Sep   Oct Nov  Dec                                  Jan     Feb     Mar       Apr  May  Jun  Jul Aug  Sep
                               2018 2018 2018 2019 2019 2019 2019 2019                                 2019     2019     2019      2019 2019 2019 2019 2020 2020                      2020     2020   2020   2020   2020   2020   2020
2018   2019   2019   2019   2019 2019 2019 2019 2019 2019 2019 2019 2019                                2020     2020    2020     2020 2020 2020 2020 2020 2020

                                        COFN - Coffee arabica ICE NY US (DH-0)          COFL - COFN
                                                                                               Coffee -robusta
                                                                                                        CoffeeLondon
                                                                                                               arabicaICE
                                                                                                                        ICE(DH-0)
                                                                                                                             NY US (DH-0)            COFL - Coffee robusta London ICE (DH-0)
                                        C/lbs                                           C/lbs C/lbs                                                  C/lbs

                     However, we have not seen Vietnam origin diffs rise to the same extent as in arabica, despite dry weather
                     throughout much of this year tempering expectations for the new harvest.

                                                                                                                                                                                                      Source Mintec Analytics
                            Coffee Robusta diff fob VN (MBP) - USD/MT
                            345

                            325

                            305

                            285

                            265

                            245

                            225
                              22 Apr 29 Apr 06 May 13 May 20 May 27 May 03 Jun                     10 Jun    17 Jun     24 Jun   01 Jul     08 Jul   15 Jul   22 Jul   29 Jul   05 Aug 12 Aug 19 Aug 26 Aug 02 Sep 09 Sep 16 Sep 23 Sep
                               2020   2020   2020   2020   2020   2020   2020                       2020      2020       2020    2020       2020     2020     2020     2020      2020   2020   2020   2020   2020   2020   2020   2020

                                                                                                                        CDV1 - Coffee Robusta diff fob VN (MBP) USD/MT

                     This uncertainty, combined with ‘arabica’s recent rise, has accounted for much of the recent exchange
                     movements.

                     The robusta discount to arabica may also see suppliers alerted to the possibility of flexing their blends in order
                     to take advantage of the lower prices, particularly as we head into a sizeable harvest in Vietnam, however, this
                     may prove to be a short-lived opportunity.

                                                                                                                                                                                                                    Copyright © 2020 Mintec Limited   5
Mintec Category
        Indices enable
        procurement to
        track food price
        changes during
        COVID-19 crisis.
        New Mintec Category Indices (MCI) are            These 46 new MCI are specifically            supply chains so as to compare
        enabling food procurement teams to               designed to measure the changes in           commodity prices. The Indices
        track price pressures affecting their            price for a group of core food and           cover the key categories that our
        raw materials and food production                beverage categories. The indices             manufacturing and retailing clients
        costs. This additional capability is             cover global, regional and specific          are typically organised around in their
        particularly powerful when combined              country prices for dairy, eggs, cereals      purchasing structures.
        into dashboards to provide improved              and bakery, hot beverages, fish, fruit,
        data visualisation. Plus the ability to          vegetables, meat and poultry, juices,        The MCI are published in the native
        group and monitor price movements                oils and fats, confectionery, packaging      currency for each region or country,
        across different categories and across           and nuts.                                    to allow for currency fluctuations and
        different geographies has helped                                                              direct comparison across all price
        to illustrate the effects of COVID-19            The MCI enable procurement, sales            series. Each one has been weighted
        on prices and to help determine the              and finance teams to understand              based on the significance of each
        potential impact on future costs.                how prices are moving across a               commodity included, providing an
                                                         range of commodities and to see              accurate direction of
        Food procurement professionals                   whether a category is exhibiting an          price changes.
        in every industry have been under                inflationary or deflationary trend.
        extreme pressure to try to assess the            The Mintec Category Indices can be           These new indices are provided
        current status of their supply chains,           used to benchmark buying teams               alongside 14,000 commodity prices
        and the likely impacts of the progress           and suppliers against an independent         already published by Mintec as part
        of the coronavirus pandemic.                     market reference for core categories.        of its online SaaS platform, Mintec
        Business leaders are also struggling to                                                       Analytics.
        make immediate decisions on a huge               By blending the raw material prices,
        range of issues, including availability,         the MCI provide a uniform approach
        pricing, sourcing and disruption in raw          measuring the changes across the
        materials and foods.                             key sectors in the food and beverage

                                                                                                   Mintec Category Indices
                                                                                                   Compare commodity price changes
                                                                                                   by category, in order to measure price
                                                                                                   competitiveness across beverages,
                                                                                                   meat, fish & more.
Price

                                                                                                   Use MCIs to track global and country-
                                                                                                   specific category price movements.

                                                                                                   MINTECGLOBAL.COM/MCI
        Apr     JunA    ug      Oct     Jan        Mar       May     Aug     Oct     Dec
Cocoa

Cocoa is another critical component of a complete tiramisu. It is also a commodity that has been
particularly challenged by the pandemic. Before the pandemic-fueled disruptions, the industry as a whole
was plagued by overproduction, sustainability concerns, and fluctuating prices. But with the onset of the
coronavirus, the industry had a new hurdle to clear: a reduction in demand.

Chocolate is a beloved treat the world over, and sales of chocolate in the US increased by 5.5% between
March 15 and August 9, per data from the National Confectioners Association. Despite the jump in
consumer retail demand, overall out-of-home sales ground to a slow trickle as tourism and foodservice
demand dried up. Not only could retail sales not compensate for this reduced market for cocoa, but the
70,000-tonne global cocoa deficit that Mintec recorded in January transformed to a 35,000-tonne surplus by
August, and the latest estimates from the ICCO see a 42,000-tonne surplus by the end of the year against
a backdrop of large ending stocks. Unsurprisingly, prices declined accordingly across cocoa-producing
regions, including the Côte d’Ivoire, which produces the majority of the ‘world’s supply. The forward curve
remained backwardated throughout much of the year.

This reduced demand was particularly apparent in Q2 grindings figures, which were around 8-9% lower
year-on-year in major grindings regions.

In addition to reduced demand driving prices down, the World Bank reported a large crop harvest in Côte
d’Ivoire that created additional downward pressure on prices. Reuters estimated in August that cocoa
futures will likely cost 10% less by the end of the year.

                                                                                                                                                            Source Mintec Analytics
    Cocoa bean ICE NY - USD/MT
   2950

   2750

   2550

   2350

   2150

   1950

   1750
       1 Oct   31 Oct 30 Nov   1 Jan   31 Jan   4 Mar   3 Apr   3 May   4 Jun   4 Jul   5 Aug   4 Sep   4 Oct   5 Nov   5 Dec   6 Jan   5 Feb   6 Mar   7 Apr   7 May   8 Jun   8 Jul   7 Aug   8 Sep
       2018     2018   2018    2019    2019     2019    2019    2019    2019    2019    2019    2019    2019    2019    2019    2020    2020    2020    2020    2020    2020    2020    2020    2020

                                                                                          COCN - Cocoa bean ICE NY (DH-3)
                                                                                          USD/MT

However, Mintec data indicates that while prices were trending down from April until August, the beginning
of September saw a spike in value due to political uncertainty in Cote d’Ivoire, the ‘world’s largest producer,
ahead of ‘October’s first-round presidential election. For manufacturers that use cocoa in dessert
applications, timing will become a critical consideration in the upcoming months as the market continues
to fluctuate. Mintec takes the guesswork out of the equation and offers real-time monitoring to indicate
exactly when will be the best time to stock up on cocoa for the upcoming chocolate-fueled holiday season.

                                                                                                                                                                            Copyright © 2020 Mintec Limited   7
Sugar

What would a tiramisu be without a little dose of something sweet? Global sugar prices took a record dip in
the first half of 2020 after recording the highest average prices in two years at the end of February. For the
two months ending late April, futures prices for the sweetener fell on the London and New York markets by
21% and 31%, respectively. As the weakened demand from foodservice and tourism began to recover later in
the summer, supported by a weaker USD, sugar prices rebounded and are now up 2.6% from this time last
year, according to Mintec data from September. As travel demand in Brazil picks back up, so will demand for
bioethanol, a bullish prospect for global markets.

                                                                                                                                                             Source Mintec Analytics
    Sugar white #5 ICE London - USD/MT
   440

   420

   400

   380

   360

   340

   320

   300

   280
      1 Oct   31 Oct 30 Nov   1 Jan   31 Jan   4 Mar   3 Apr   3 May   4 Jun   4 Jul   5 Aug   4 Sep   4 Oct   5 Nov    5 Dec    6 Jan   5 Feb   6 Mar   7 Apr   7 May   8 Jun     8 Jul   7 Aug   8 Sep
      2018     2018   2018    2019    2019     2019    2019    2019    2019    2019    2019    2019    2019    2019     2019     2020    2020    2020    2020    2020    2020      2020    2020    2020

                                                                                       SGWL - Sugar white #5 ICE London (DH-3)
                                                                                       USD/MT

Prices for this key ingredient in biscuits, cakes, confectionery, jams, and ice cream continued to climb over
the summer, with the FAO reporting a spike that was tempered only by the anticipation of a bumper crop
in India where the harvesting season begins in October. Despite this expectation, the ‘country’s moderated
prices remain elevated. Mintec data demonstrate that prices for sugar sourced from India, the second-largest
producer behind Brazil, are up 5.7% this quarter. All eyes are now on the Indian government to see whether
they will announce a new export subsidy of 6 million tonnes to enable competition in the global market.

This jump in prices for Indian sugar is the most out of the other major sugar-producing regions, which include
the US, Thailand, and Brazil. Prices in these regions remained relatively stable over the last quarter, but
going forward, they are likely to soften across markets. The US Department of Agriculture (USDA) forecasts
an increase of 10 million tonnes of sugar production from India and Thailand for the upcoming 20/21 year.
Coupled with the widely held prediction that Brazil will produce a record sugar cane crop by the end of
October, the already large surplus of product inventory will balloon to levels that current depressed demand
will not sufficiently deplete. Based on these market realities, Mintec expects average sugar prices to lose the
majority of the upward momentum that was recorded in May and June, leaving an opportunity for buyers
looking to replenish their supplies at a discount this fall. What remains to be seen for global markets, however,
is how demand responds in 2021 as the virus starts to ease.

In Europe, the neonicotinoid ban has started to assert itself, with instances of yellow virus affecting yields,
particularly in western Europe. Though ‘Europe’s whites production looks likely to be down by around 150,000
tonnes, if this is set amongst a context of consistently falling demand, particularly exacerbated by Covid-19, we
have seen sugar prices in western Europe remain relatively unchanged year-on-year.

                                                                                                                                                                                 Copyright © 2020 Mintec Limited   8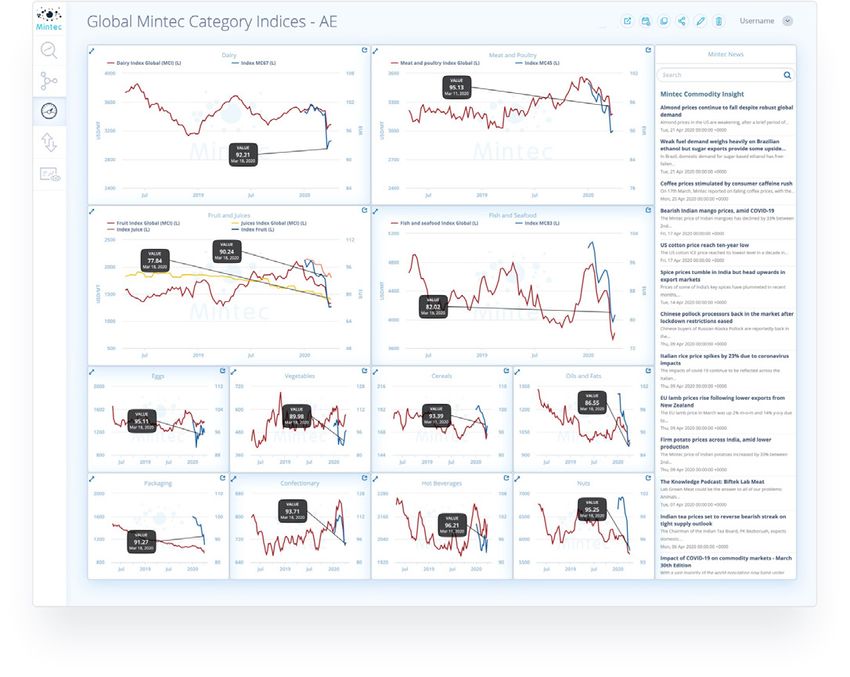
Mintec Dashboards
Create your own or access our extensive library of readymade
dashboards to track the category and commodity prices most
relevant to you.

Price dashboards that
help you visualise, track
and respond to changing
market conditions.

     Compare price series across                                Explore category indices to track
        commodity types                                                price movements
     to visualise price comparisons between                      and identify underlying market trends. Use
   alternative raw materials and share editable                Mintec Category Indices to track global, regional
  dashboards with anyone in your organisation.                 and country-specific category price movements.

                                   MINTECGLOBAL.COM/DASHBOARDS
Vanilla

Although a small bean, vanilla packs a powerful punch in any recipe that it is used in. Its heady aroma is
prized for the creamy tones it imparts to desserts like tiramisu, but it has a price tag to reflect its popularity.
For several years, the price of natural vanilla extract has been high. According to a 2019 report from vanilla
distributor Nielsen-Massey, these sustained high prices resulted in a global demand reduction for pure
vanilla from 2,700 tonnes in 2015 to an estimated 1,700 tonnes in 2019.

Despite this trimming in market size for true vanilla, the flavor remains a sought after ingredient, and
despite an increased number of companies substituting authentic vanilla for its artificial substitute vanillin
when prices were sky-high, replacing authentic vanilla with an imitation may not be such a straightforward
economical decision to make any longer. Mintec Benchmark Prices for Madagascan Gourmet Grade Vanilla
came down 48% between September 2019 and September 2020 and a steeper price decline has been
prevented due to the Madagascan government interfering in the market by setting a minimum export
price at $350/kg in March which was lowered to $250/kg in July where it has remained since. Madagascar
produces 41% of the world’s vanilla supply, according to Mintec.

While Vanilla harvests in 2019 and 2020 have been significantly higher, the price plunge is not only supply
side driven as the shuttering of foodservice around the world as a result of COVID-19 has further impacted
the demand side. While consumer retail demand for vanilla has spiked on the back of increased home-
baking, this has not made up for the loss from foodservice.

         The Mintec Benchmark Prices for gourmet grade vanilla declined steadily from $650
         per kg in 2017 to $310 per kg in February this year, on the back of dwindling demand
         and growing supplies.

                                                                                                                                                            Source Mintec Analytics
    Vanilla gourmet fob MG (MBP) - USD/KG
   600

   550

   500

   450

   400

   350

   300

   250

   200
      3 Oct   31 Oct 28 Nov 26 Dec 23 Jan 20 Feb 20 Mar 17 Apr 15 May 12 Jun   10 Jul   7 Aug   4 Sep   2 Oct   30 Oct 27 Nov 25 Dec 22 Jan 19 Feb 18 Mar 15 Apr 13 May 10 Jun   8 Jul   5 Aug   2 Sep
      2018     2018   2018   2018  2019    2019   2019   2019   2019   2019    2019     2019    2019    2019     2019   2019   2019  2020    2020   2020   2020   2020   2020    2020    2020    2020

                                                                                         SP54 - Vanilla gourmet fob MG (MBP)
                                                                                         USD/kg

                                                                                                                                                                           Copyright © 2020 Mintec Limited   10
Mascarpone
The most unmistakable component of a tiramisu is the smooth, butter-like mascarpone. It is also an
ingredient that has suffered as the pandemic gutted the dairy industry in the US and New Zealand. While
this cheese traditionally hails from Italy, it is one that is produced worldwide today, and having global
offerings of this cheese gives procurement teams a variety of opportunities to balance quality, price,
and availability.
In May, the price of this ingredient had fallen to $4.46 USD/Kg, as farmers in the US and New Zealand
found themselves with a glut of dairy and nowhere to send finished products. While that dramatic shift in
demand will have long-term consequences on the dairy industries of both countries, the price for dairy and
mascarpone made a remarkable recovery in the ensuing months, even topping peak prices from April.
Such a rebound signals a potential need for an ingredient substitution. For manufacturers, that be a switch
could be changing sourcing to avoid the 5.6% jump in value this quarter for true Italian mascarpone in favor
of a Brazilian-produced equivalent, which has seen a 5.53% reduction in price in the same time period.
Alternatively, perhaps substituting another casein product or looking for a plant-based equivalent may help
bring prices down and add another dimension of desirability to the overall finished product.
Source Mintec Analytics
Cheese Mascarpone IT - USD/KG
5.2
5.1
5
4.9
4.8
4.7
4.6
4.5
4.4
3 Oct 31 Oct 28 Nov 26 Dec 23 Jan 20 Feb 20 Mar 17 Apr 15 May 12 Jun 10 Jul 7 Aug 4 Sep 2 Oct 30 Oct 27 Nov 25 Dec 22 Jan 19 Feb 18 Mar 15 Apr 13 May 10 Jun 8 Jul 5 Aug 2 Sep
2018 2018 2018 2018 2019 2019 2019 2019 2019 2019 2019 2019 2019 2019 2019 2019 2019 2020 2020 2020 2020 2020 2020 2020 2020 2020
IL72 - Cheese Mascarpone IT
USD/kg
Copyright © 2020 Mintec Limited 11Making it better for consumers
Plant-based products are a newer category that manufacturers are gravitating toward in response to demand from consumers
for alternatives to conventional animal-based products. SPINS market research data reported that plant-based food retail
sales rose 11.4% in 2019 to reach a total market value of $5 billion. However, due to their more recent entrance to the market,
accurately defining the cost of ingredients, such as pea concentrates, and soy isolates can leave manufacturers with more
questions than answers. Mintec Analytics offers Benchmark Prices for Plant Based Proteins as well as access to Thought
Leadership and Webinars on topics such as “Plant Protein Cost Structures” or “Lab Grown Meat”.
Nor are plant-based alternatives the only trend in the better-for-you space. Organics and fair trade options have risen in the
esteem of consumers who are looking for opportunities to contribute to the sustainability of the environment through food
choice, and this trend toward eating sustainably has only been amplified by the pandemic. Nearly half of consumers say that the
pandemic has contributed to a shift in purchases due to an increasing concern for the environment, according to an April survey
by the consulting firm Kearney. Compared to the 71% of consumers who factored the environment into their purchases in 2019,
the survey shows that 83% of consumers said they take the environment into consideration when making a purchase.
The effects of this sentiment can be staggering. For a simple dessert like tiramisu that contains both cocoa and chocolate, the
difference between selecting fair trade and conventional ingredients no longer only influences the sales price of a final product,
but also the standing of the manufacturer in the eyes of the consumer.
Choosing to make an investment in better-for-you ingredients is not a straightforward path. Pricing organic, fair trade and
conventional ingredients necessitates that procurement teams have a profound and nuanced understanding of the value of
ingredients in the eyes of the consumer as well as taking into account their value on the global market. Synthesizing market
trends with pricing models and availability can prove to be a tedious task, particularly when these models need to be repeatedly
updated for individual ingredients across an expansive portfolio.
About Mintec
Mintec enables the world’s largest food brands to implement more efficient and sustainable procurement
strategies through its SaaS platform. Mintec Analytics delivers market prices and analysis for more than
14,000 food ingredients and associated commodity materials. Our data and tools empower our customers
to understand supplier prices better, analyze their spend in greater detail, and negotiate more confidently
with suppliers. Ensuring they are best placed to reduce costs, manage risk, and increase their efficiency,
helping them to maximise their margins.
Get the latest insight into the widest range of food commodities.
Copyright © 2020 Mintec Limited 12Our Products
Mintec Analytics
Analysis of price data helps reveal how food prices can change over time; helping
you gauge the true level of food price increases.
• Quickly access +14,000 • Use actionable insight to enable
independent food ingredients & soft buyers & sellers to negotiate deals
commodity prices & market analysis with confidence
• Reveal what’s behind food raw • Develop procurement strategies
material prices & driving current to increase efficiency, manage risk &
market trends transform trading performance.
Data Direct
Our innovative API and Excel Add-in data feeds deliver pricing data into the
platforms and systems you are already using – saving you time and effort.
• Automated - Remove human error,
save time and increase efficiency
with automated data transfers and
dynamic data updates.
• Integrated - Aggregate and
integrate data with your existing
systems, data sets and models more
easily for deeper insights and a more
efficient workflow.
• Dynamic - Respond to changing
business, user and system needs
more readily - plus benefit from
enhanced collaboration and
sharing capabilities.
sales@mintecglobal.com | UK +44 1628 642498 | USA +1 972 897 74949
M I N T E C G LO B A L . C O M Copyright © 2020 Mintec Limited 13You can also read