Core/Combustor-Noise Baseline Measurements for the DGEN Aeropropulsion Research Turbofan - NASA

Page created by Alex Torres
 
CONTINUE READING
Core/Combustor-Noise Baseline Measurements for the DGEN Aeropropulsion Research Turbofan - NASA
https://ntrs.nasa.gov/search.jsp?R=20180005229 2018-12-29T10:08:03+00:00Z

                             24th AIAA/CEAS Aeroacoustics Conference, Atlanta, Georgia, USA, 25–29 June 2018

 Core/Combustor-Noise Baseline Measurements for the DGEN
           Aeropropulsion Research Turbofan

                     Devin K. Boyle,† Brenda S. Henderson‡ and Lennart S. Hultgren‡
                            National Aeronautics and Space Administration
                             John H. Glenn Research Center at Lewis Field
                                      Cleveland, Ohio 44135, USA

           Contributions from the combustor to the overall propulsion noise of civilian transport aircraft are starting
       to become important due to turbofan design trends and advances in mitigation of other noise sources. Future
       propulsion systems for ultra-efficient commercial air vehicles are projected to be of increasingly higher bypass
       ratio from larger fans combined with much smaller cores, with ultra-clean burning fuel-flexible combustors.
       Unless effective noise-reduction strategies are developed, combustor noise is likely to become a prominent con-
       tributor to overall airport community noise in the future. The new NASA DGEN Aeropropulsion Research
       Turbofan (DART) is a cost-efficient testbed for the study of core-noise physics and mitigation. This paper
       describes the recently completed DART core/combustor-noise baseline test in the NASA GRC Aero-Acoustic
       Propulsion Laboratory (AAPL). Acoustic data were simultaneously acquired using the AAPL overhead mi-
       crophone array in the engine aft quadrant farfield, a single midfield microphone, and two semi-infinite-tube
       unsteady pressure sensors at the core-nozzle exit. Combustor-noise components of measured total-noise sig-
       natures were educed using a two-signal source-separation method and are found to occur in the expected
       frequency range. The acoustic data compare well with results from a limited 2014 feasibility test and will serve
       as a high-quality baseline for future research using the DART. The research described herein is aligned with
       the NASA Ultra-Efficient Commercial Transport strategic thrust and is supported by the NASA Advanced Air
       Vehicle Program, Advanced Air Transport Technology Project, under the Aircraft Noise Reduction Subpro-
       ject.

                                                         Nomenclature

AAPL             Aero-Acoustic Propulsion Laboratory
DART             DGEN Aero-Propulsion Research Turbofan
FADEC            full authority digital engine control [unit]
GRC              Glenn Research Center
ITP              infinite-tube-pressure [probe]
NATR             nozzle acoustic test rig
NI               National InstrumentsTM
BPFF             fan blade-passing frequency
BPFL             low-pressure-turbine blade-passing frequency
NH               high-pressure-spool shaft speed, rpm
NLc              temperature-corrected low-pressure-spool shaft speed, rpm
NL               low-pressure-spool shaft speed, rpm
SPFH             high-pressure-spool shaft-passing frequency
SPFL             low-pressure-spool shaft-passing frequency
SPFF             fan shaft-passing frequency
SPL              sound pressure level, dB re 20 µPa
NPL              noise pressure level, dB
OPR              overall pressure ratio
 †   Member AIAA
 ‡   Associate Fellow AIAA

                                                                 1 of 16

                                           American Institute of Aeronautics and Astronautics
Core/Combustor-Noise Baseline Measurements for the DGEN Aeropropulsion Research Turbofan - NASA
I.    Introduction
    Modern turbofan design trends promise overall quieter future propulsion systems for subsonic-transport aircraft.
Notable emerging turbofan features include higher bypass ratios, wide-chord low-pressure-ratio fans, core turboma-
chinery with lower blade counts, lean combustors, and smaller cores with higher overall pressure ratios (OPR). Several
of these anticipated future engine characteristics are expected to either directly or indirectly increase combustor noise
generation and propagation to external observers. In addition, other propulsion-noise sources are projected1 to be
reduced by these engine design trends, as well as by expected advances in fan-noise mitigation. It is evident1 that
combustor noise will become an increasingly important component of the total propulsion noise signature at all engine
power settings in the future. Consequently, combustor noise needs to be addressed in order to meet far-term noise
goals guided by expected domestic and international regulatory airport-community-noise metrics.
    Core noise conventionally includes contributions from the compressor, combustor and turbine. Generally, com-
pressor noise, originating from rotor-stator and inter-stage interactions, propagates in the forward direction where it is
masked by fan noise. Turbine rotor-stator interaction tones propagate mainly in the aft direction and occur at frequen-
cies on the order of several kHz. Turbine noise could become more important in the future,2 due to the design trends of
higher turbine-rotor blade loading and (the accompanying) lessening of turbine-stage solidity. However, it is believed
here that acoustic treatment and the current cut-off/modal design techniques can be applied to control these effects.
Combustor noise manifests as incoherent broadband noise in the less than 1.5 kHz frequency range—on an 1/3-octave
basis, it is generally observed to peak around 300–500 Hz. For current-generation turbofan engines, combustor noise
can become prominent in the farfield during low power settings typical of commercial aircraft approach conditions,
but it is typically overwhelmed by fan and jet noise at high engine-power settings during takeoff. However, combustor
noise will likely be a crucial issue in meeting future regulatory noise metrics. In fact, the dominating noise sources for
far-term concept aircraft are expected to originate, in alphabetical order, from the airframe, combustor, and fan, with
the airframe noise being an issue mainly at approach.
    In order to study propulsion noise production, propagation, diagnostics and, particularly, mitigation in a rele-
vant environment, NASA has recently acquired a Price Induction DGEN 380 turbofan engine. The DGEN 380 is a
two-spool 500 lbf (2.2 kN) thrust-class geared turbofan engine with a bypass ratio of approximately 7.6, a 3.32 fan
gear ratio, a single centrifugal compressor on the high pressure spool, a reverse flow annular combustor, and sin-
gle stage uncooled axial high-pressure and low-pressure turbines. Its modular design will allow the replacement of
major components with parts modified for invasive instrumentation with comparative ease, thus promising to be a
cost-effective research platform. This NASA resource has been designated as the DGEN Aero-Propulsion Research
Turbofan (DART).
    A baseline core/combustor-noise test using the DART in the Aero-Acoustic Propulsion Laboratory (AAPL) at
NASA Glenn Research Center (GRC) was completed during late summer of 2017. The results and findings from
this test are the subject of this paper. The test purpose was three-fold: (1) to establish a baseline dataset for fu-
ture core/combustor-noise measurements, (2) to compare with results obtained during a 2014 feasibility test using a
different DGEN 380 turbofan,3 and (3) to further the local hands-on experience in using state-of-the-art infinite-tube-
pressure (ITP) transducers for (remote) measurement of unsteady pressures in extreme environments.
    From a core noise perspective, one of the goals of the earlier 2014 test was to evaluate the feasibility of the
(then) DART concept as a combustor-noise research platform,3 particularly with regard to how well the DGEN 380’s
core/combustor-noise characteristics relate to those of current-generation combustors used in turbofan engines larger
than the comparatively small DGEN 380. Hultgren3 used a well-established two-signal source separation technique
(Ref. 4, Ch. 4) to educe the low-frequency broadband combustor-noise component of the total aft-radiated noise. A
core-exhaust-mounted ITP was used in conjunction with a midfield microphone located 12 ft from the engine axis at
engine centerline height and a 130◦ polar angle. Combustor noise was detected in the expected frequency range of
approximately 100-500 Hz with a spectral shape typical of turbofan combustor noise. The DART concept was deemed
to be a relevant and valuable asset for studying core-noise physics and evaluating novel measurement techniques. The
recent 2017 test, in a sense, is a more extensive repeat of the limited 2014 one, with improved instrumentation and
simultaneous acoustic data also acquired in the farfield.

                                             II.    Experimental Setup
   The DART core/combustor-noise baseline test was performed in the AAPL at NASA GRC in August 2017. The
coordinate system used to describe measurement locations herein is a spherical one with its origin located on the the
engine centerline at the core-nozzle exit plane. The polar angle is zero in the inlet direction and the azimuthal angle is

                                                            2 of 16

                                       American Institute of Aeronautics and Astronautics
Core/Combustor-Noise Baseline Measurements for the DGEN Aeropropulsion Research Turbofan - NASA
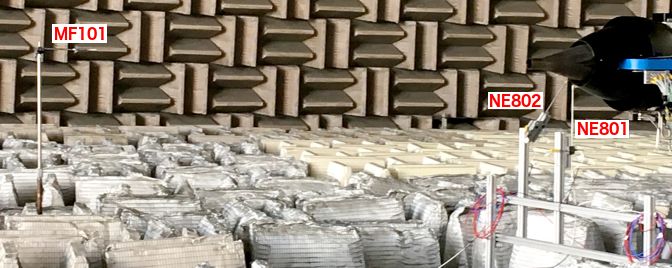
zero in the engine port-side horizontal plane.
    The turbofan engine was located near the center of the AAPL dome allowing use of the fixed overhead microphone
array. In the past, this array has been used extensively in connection with the Nozzle Acoustic Test Rig (NATR). Only
a subset of the 24 microphone locations was utilized in this test. Seven G.R.A.S. (type 46BE) 1/4-inch prepolarized
condenser-type microphones were mounted in the aft portion of the overhead array and oriented such that their faces
pointed at the center of the core-exhaust plane. Polar angles ranged from approximately 108◦ to 143◦ at radial distances
from the engine core exit of 36–39 ft (11–12 m). The azimuthal angles of the overhead-array microphones were nearly
constant at 83◦ with a slight variation due to the out-of-azimuthal-plane rotation of the array. The mean distance
between the overhead-array measurement locations and the core-nozzle exit is approximately 51 nozzle diameters.
The overhead microphones can thus be considered to be in the farfield, according to the criteria given by Ahuja.5 A
view of the AAPL overhead array from floor-level near the location of the engine is seen in Fig. 1. The aft-most
microphone locations, except for the last one seen at the bottom of the image, were used in this test. The microphones
will be referred to here as sensors FF017 through FF023, with the ‘FF’ indicating farfield and the numerical part being
consistent with the AAPL overhead-array microphone-numbering convention and increasing with aft position.

                                      Figure 1. AAPL overhead microphone array (aqua arc)

                                      Table 1. Microphone locations in spherical coordinates

                                 FF017      FF018      FF019      FF020      FF021      FF022     FF023     MF101
                    radius, ft    39.56      38.81      38.25      37.55      37.05      36.63     36.57     10.0
                       (m)       (12.06)    (11.83)    (11.66)    (11.44)    (11.29)    (11.16)   (11.15)   (3.05)
                     polar, ◦     108.0      113.5      119.2      125.2      131.2      137.2     143.4    130.0
                   azimuth, ◦      83.0      83.0        83.0       83.0      83.9        84.7     87.2        0

    In addition to microphones mounted in the aft portion of the overhead array, a single midfield microphone (iden-
tical to the overhead ones) was placed at a radial distance of 10 ft (3.05 m), at the engine centerline height, and at
a polar angle of 130◦ . It will be referred to herein as sensor MF101, with the ‘MF’ indicating midfield. This mi-
crophone served dual purposes: first, allowing a simple comparison between the data acquired in 2014, wherein a
circumferential array of midfield microphones was trained on the engine at a radius of 12 ft (3.66 m); and second, the
midfield microphone in conjunction with an overhead-array microphone, in essentially the same polar direction, can
provide some indication about how well the overhead measurement locations represent the true acoustic farfield. The

                                                                 3 of 16

                                           American Institute of Aeronautics and Astronautics
microphone layout is described in Table 1.

                        Figure 2. MF101 midfield microphone; NE801 and NE802 ITPs at DART core exit

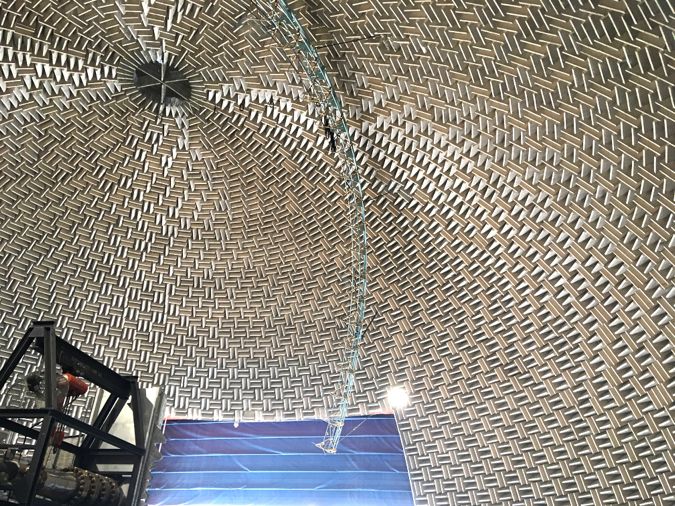
                        Figure 3. 6 o’clock (NE801) and 7 o’clock (NE802) ITPs at DART core-nozzle exit

    Two Kulite R XCS-190-10D 10 psi (68.95 kPa) differential unsteady pressure transducers were also installed, in
an ITP configuration, at the core-nozzle exit providing engine-internal measurements. The stand-mounted midfield
microphone and core-nozzle-exit ITPs are shown in Fig. 2. Figure 3 shows the location of the ITPs in more detail. In
what follows, the 6 o’clock and 7 o’clock ITPs will be referred to as sensors NE801 and NE802, respectively, with
the ’NE’ indicating (core) nozzle exit. There is an approximately 1 ft (0.305 m) sense line beginning at the plane of
the core-nozzle exit (actually just inside the core nozzle), leading to a steel block where the pressure transducer and
a thermocouple are flush-mounted to the inner wall of the sense line. The flush mounting minimizes cavity noise,
as well as resonances, associated with any volume between the transducer face and the tube inner diameter. The
thermocouple is also flush mounted to avoid misleading pressure wave reflections or distortions. On the other side of
the block, the infinite line is 50 ft (15.24 m) long, terminating at a tee connecting to the other ITP plumbing and a N2
gaseous nitrogen purge-flow supply line. The inner diameter of 0.194 in (4.93 mm) is maintained throughout to avoid

                                                            4 of 16

                                       American Institute of Aeronautics and Astronautics
any diameter discontinuities, which also would lead to pressure reflections/distortions. The nitrogen valve remained
closed for the duration of the testing, since purge-flow cooling was found to be unnecessary for measurements at the
core-exit location. Consequently, the main heat-transfer mechanism to the transducers was conduction since they are
placed well outside of the core and fan streams. The transducers’ 10 psi differential pressure range made it acceptable
to vent each transducer’s reference-pressure side to atmospheric conditions. The ITP design is pictured in Fig. 4.

Figure 4. Infinite-Tube-Probe (ITP) design; sense line (left), connector to infinite line (right), thermocouple (top), and differential pressure
transducer (bottom)

                                          III.    Data Acquisition and Processing
    Data acquisition was achieved via a National InstrumentsTM (NI) PXIe-1082 chassis, utilizing two NI 4499 analog-
to-digital converter cards, simultaneously recording eight microphone channels and two ITP channels. The Kulite R
pressure transducer signals were routed through a two-channel Kulite R KSC-2 signal conditioner that performed
analog gain prior to the signals entering the NI data-acquisition chassis. The signals were digitized at 100,000 samples
per second for a total observation time of 60 seconds at each experimental test point. The resulting time series for each
channel and observation contains 6 million data points. Each time series was analyzed using an FFT length of 16,384
points (corresponding approximately to a 6.1 Hz frequency resolution or binwidth), Hamming windowing, and a 50
percent data-segment overlap. The resulting narrowband spectra are then the average of a large number of realizations
(over 700 instantaneous spectra). Auto-spectra were computed using both the built-in capabilities of NI LabVIEW
software that was used to control the data acquisition and post-test using MATLAB scripts and routines. Cross-spectra
were computed using MATLAB with time-of-flight corrections applied to the microphone signals when appropriate.

                                                              IV.     Results
A.    Test Matrix
DART’s full authority digital engine control (FADEC) unit has an executable program that runs through a sequence
of predefined engine power settings, with each setting here set to be held for 120 seconds. During normal engine
operation, the temperature-corrected low-pressure-shaft speed (N Lc ) is used as the output value controlled by the
FADEC. This corrected shaft speed is given by
                                                        p
                                              N Lc = N L TSLS /Tamb                                             (1)

where N L is the actual shaft speed, TSLS = 288.15 K is the sea-level standard temperature, and Tamb is the ambient
temperature (also in K).
    The campaign consisted of the test points shown in        Table 2. DART core/combustor-noise baseline test matrix
Table 2, where the power setting represents the ratio of
                                                                      Point # Power, %   Point #    Power, %
N Lc to the maximum allowable N L at standard sea-level
                                                                        1        33         9          33
conditions. The control program starts at idle (33%) and
                                                                        2        33        10          33
dwells at each of the power settings shown in Table 2.
                                                                        3        50        11          50
After having reached the maximum available power set-
                                                                        4        60        12          60
ting (limited by the ambient temperature), it then returns
                                                                        5        70        13          70
to idle, and the sequence is then repeated once. Con-
                                                                        6        80        14          80
sequently, data were collected four times at the idle set
                                                                        7        90        15          90
point and twice at each of the other engine-power set
                                                                        8       92.5       16         92.3
points. Note that the maximum-power set point depends                                      17           0
on the ambient temperature and this is why the engine

                                                                    5 of 16

                                              American Institute of Aeronautics and Astronautics
power differs slightly between test point 8 and 16. Test point 17 was taken with the engine off, but with support
systems (such as the oil pump, etc.) running, for a background-noise assessment.
    Under FADEC command, the engine performed quite repeatably in maintaining shaft speed for a given set point.
Figure 5 demonstrates the stability with which DART’s actual N L followed the commanded set point. Note that during
the starting process, DART is controlled by the high-pressure-shaft speed, N H . Once the engine thermally stabilizes at
idle power and the program is executed, it becomes controlled through N Lc . During the test, the actual low-speed-shaft
rotation rate, N L , had an rms deviation of less than 0.04% and its maximum observed deviation was less than 0.1%.

                                                                104
                                                        6
                                                                      NHset
                                                                      NH
                                                        5             NLset
                                                                      NL
                              Actual Shaft Speed, rpm

                                                        4

                                                        3

                                                        2

                                                        1

                                                        0
                                                            0             500           1000         1500            2000         2500
                                                                                               Time, s

                                     Figure 5. NL and NH set points and corresponding actual shaft speeds
    Some frequencies of interest are listed in Table 3, including shaft-passing frequencies for the high-pressure spool,
SPFH , low-pressure spool, SPFL , and the fan shaft, SPFF . Fan and low-pressure-turbine blade passing frequencies,
BPFF and BPFL , respectively, round off the remainder of the columns in Table 3. As will be seen below, many of these
tones are apparent either in the sound-pressure-level (SPL) spectra or in the 2-signal coherence spectra. However, the
BPFL tone only falls within the 10 kHz limit of the spectra presented here for the idle power settings.

         Table 3. Low/high-pressure-spool and fan shaft frequencies and fan/low-pressure-turbine blade-passing frequencies

                        Point #                             Power, %        SPFH , Hz    SPFL , Hz       SPFF , Hz    BPFL , Hz    BPFF , Hz
                           1                                   33             452          244              73          9253         1027
                           2                                   33             453          244              73          9256         1027
                           3                                   50             611          370             112         14069         1561
                           4                                   60             681          444             134         16884         1874
                           5                                   70             739          518             156         19701         2186
                           6                                   80             787          593             179         22518         2499
                           7                                   90             831          667             201         25332         2811
                           8                                  92.5            842          685             206         26022         2888
                           9                                   33             454          244              73          9255         1027
                          10                                   33             453          244              73          9256         1027
                          11                                   50             612          370             112         14074         1562
                          12                                   60             682          445             134         16890         1874
                          13                                   70             739          519             156         19707         2187
                          14                                   80             787          593             179         22521         2499
                          15                                   90             831          667             201         25337         2812
                          16                                  92.3            842          684             206         26002         2885

                                                                                           6 of 16

                                                                      American Institute of Aeronautics and Astronautics
B.                                 Repeatability and Signal-to-Noise Ratio
Excellent measurement repeatability and signal-to-noise ratio were demonstrated in this test, as indicated by Fig. 6.
Narrowband (6.1 Hz binwidth) SPL for both ITPs, the midfield microphone and the farfield microphone oriented
approximately at a 130◦ polar angle are shown in the different panels of this figure. All plots are displaying data taken
during the four test points at the 33% power setting as well as the background-noise measurement test point. The black
curve in each plot is the spectrum for the sensor during the background noise condition with the engine not running.
It should be noted that while the engine was not operating during this test point, other ancillary equipment like the
fuel pump was running. Nevertheless, the signal-to-noise ratio is greater than 10 dB all the way down to below 100 Hz
for all sensor locations; this is important because combustion broadband noise occurs primarily between about 100 Hz
and 1 kHz.

                                   140                                                                                              140

                                                                                   BPFL
                                   120                                                                                              120
     Narrowband (6.1 Hz) SPL, dB

                                                                                                      Narrowband (6.1 Hz) SPL, dB
                                   100                                                                                              100

                                    80                                                                                               80

                                    60                                                                                               60

                                    40                                                                                               40
                                                                                 point 01
                                                                                 point 02
                                    20                                           point 09                                            20
                                                                                 point 10
                                                                                 point 17
                                     0                                                                                                0
                                         0   2000   4000      6000        8000          10000                                             0   2000   4000     6000   8000   10000
                                                     Frequency, Hz                                                                                   Frequency, Hz
     (a)                                                                                                   (b)

                                   140                                                                                              140

                                   120                                                                                              120
     Narrowband (6.1 Hz) SPL, dB

                                                                                                      Narrowband (6.1 Hz) SPL, dB

                                   100                                                                                              100

                                    80                                                                                               80

                                    60                                                                                               60

                                    40                                                                                               40

                                    20                                                                                               20

                                     0                                                                                                0
                                         0   2000   4000      6000        8000          10000                                             0   2000   4000     6000   8000   10000
                                                     Frequency, Hz                                                                                   Frequency, Hz
     (c)                                                                                                  (d)

Figure 6. Narrowband (6.1 Hz binwidth) SPL spectra for both ITPs, the midfield microphone and the farfield microphone at approximately
130◦ polar angle at engine-idle and background-noise (black curves) conditions: (a) 6 o’clock ITP, NE801; (b) 7 o’clock ITP, NE802; (c)
midfield microphone, MF101; (d) farfield microphone, FF021

C.                                 Comparison with the 2014 Test
Select data from the 2014 DGEN 380 test were then compared to the current data set. For the 2014 test, a single
absolute pressure transducer was mounted in the bottom dead center (6 o’clock) position of the core exhaust. The
lead time to get ready for the 2014 test was very short and, unfortunately, an absolute pressure transducer had to be
used due to the long ordering/delivery times for suitable differential transducers. Hultgren3 defined a noise pressure
level (NPL) which is the noise floor of the absolute transducer, accounting for the effects of nonlinearity, repeatability
and hysteresis on output accuracy, which also defines a lower amplitude limit for unsteady pressure measurements

                                                                                                7 of 16

                                                                     American Institute of Aeronautics and Astronautics
using the absolute transducer. Hultgren3 deemed that signal-to-noise ratio was acceptable (greater than 10 dB) for the
frequency range of interest, i.e. below about 1 kHz.
    Simultaneous data from this ITP and an aft-quadrant stand-mounted midfield microphone array, 12 ft from the
engine core exit and engine centerline height, were acquired during the 2014 test. Farfield overhead microphone-array
data were also acquired, but not simultaneously with the ITP and the midfield array, during that test. The relevant
2014 data, discussed by Hultgren,3 were rescaled from a binwidth of 12.2 Hz to 6.1 Hz and the 130◦ midfield micro-
phone data were also adjusted from 12 ft to the current 10 ft distance assuming spherical spreading (no attenuation
effects were applied). Figure 7 shows comparisons at comparable measurement locations. Once corrected to the
same distance, both midfield microphone measurements agree well; the slight frequency difference between tones is
a consequence of the NLc -control of the engine set point, resulting in different actual shaft speeds due to differing
ambient temperatures. The engine-mounted pressure-transducer results agree reasonably well up to about 1 kHz, but
the absolute-transducer curve quickly deviates from the differential-transducer curves beyond 1 kHz. As expected,
levels increase with engine power.

                                   140                                                                                           140

                                   120                                                                                           120
     Narrowband (6.1 Hz) SPL, dB

                                                                                                   Narrowband (6.1 Hz) SPL, dB
                                   100                                                                                           100

                                    80                                                                                            80

                                    60                                                                                            60

                                    40                                      NE801                                                 40
                                                                            NE802
                                                                            MF101
                                    20                                      2014 NE                                               20
                                                                            2014 MF
                                                                            2014 Limit
                                     0                                                                                             0
                                         0   2000   4000     6000        8000        10000                                             0   2000   4000     6000   8000   10000
                                                    Frequency, Hz                                                                                 Frequency, Hz
  (a)                                                                                                   (b)

                                   140                                                                                           140

                                   120                                                                                           120
     Narrowband (6.1 Hz) SPL, dB

                                                                                                   Narrowband (6.1 Hz) SPL, dB

                                   100                                                                                           100

                                    80                                                                                            80

                                    60                                                                                            60

                                    40                                                                                            40

                                    20                                                                                            20

                                     0                                                                                             0
                                         0   2000   4000     6000        8000        10000                                             0   2000   4000     6000   8000   10000
                                                    Frequency, Hz                                                                                 Frequency, Hz
  (c)                                                                                                  (d)

Figure 7. Narrowband (6.1 Hz binwidth) SPL spectra comparing ITP and midfield microphone results between 2014 and current test
campaign (test points 4–7): a) 60%, b) 70%, c) 80%, and d) 90% power settings

D.                                 Narrowband Sound-Pressure-Level Spectra
Narrowband SPL spectra for both ITPs, the midfield microphone and the farfield microphone located at approximately
130◦ polar angle are presented in Fig. 8 at four different power settings: 60%, 70%, 80%, and 90%. The fan blade-
passing tone, BPFF , and several of its harmonics are present in the midfield and farfield microphone spectra. Some
haystacking is observed around the second harmonic of the BPFF . Since the ITP design included cylindrical tubes
spanning the fan and core exit streams, it was necessary to determine whether some observed tones, or broader spec-

                                                                                             8 of 16

                                                                    American Institute of Aeronautics and Astronautics
140                                                                                                     140

     Narrowband (6.1 Hz) SPL, dB   120                                                                                                     120

                                                                                                             Narrowband (6.1 Hz) SPL, dB
                                   100                                                                                                     100
                                             BPFF     2BPFF    3BPFF    4BPFF      5BPFF

                                    80                                                                                                      80

                                    60                                                                                                      60

                                    40                                                                                                      40
                                                                                           NE801
                                    20                                                     NE802                                            20
                                                                                           MF101
                                                                                           FF021
                                     0                                                                                                       0
                                         0          2000      4000     6000        8000        10000                                             0    2000   4000     6000       8000   10000
                                                              Frequency, Hz                                                                                  Frequency, Hz
     (a)                                                                                                          (b)

                                   140                                                                                                     140

                                   120                                                                                                     120
     Narrowband (6.1 Hz) SPL, dB

                                                                                                             Narrowband (6.1 Hz) SPL, dB
                                                                                                                                                     BPFF     2BPFF
                                   100                                                                                                     100                               3BPFF

                                    80                                                                                                      80

                                    60                                                                                                      60

                                    40                                                                                                      40

                                    20                                                                                                      20

                                     0                                                                                                       0
                                         0          2000      4000     6000        8000        10000                                             0    2000   4000     6000       8000   10000
                                                              Frequency, Hz                                                                                  Frequency, Hz
     (c)                                                                                                         (d)

Figure 8. Narrowband (6.1 Hz binwidth) SPL spectra for both ITPs, mid- and far-field microphones at a) 60%, b) 70%, c) 80%, and d)
90% power settings (test points 4–7)

tral peaks, could be attributed to vortex shedding from the cylinders. Based on the estimated shedding frequencies
produced by the fan and core exhaust velocities and inspection of the SPL spectra, no clear evidence of ITP-tube vor-
tex shedding could be identified. One anomaly (most pronounced for frequencies below about 4 kHz) is the divergence
between the differential ITPs, NE801 (6 o’clock) and NE802 (7 o’clock), with increasing engine power setting. As of
yet, the cause for this remains unclear.

E.                                 Core/Combustor-Noise Component
Identification of core-noise components of the total noise signature was achieved through the two-signal coherence
method (Ref. 4, Ch. 4), also known as the coherent output method. The use of this method involves the one-sided cross
power spectrum, Gxy , between two signals measured at different locations, x and y, and the one-sided auto spectrum
of each signal, Gxx and Gyy . The magnitude-squared coherence is given by

                                                                                               2        |Gxy |2
                                                                                              γxy =             ,                                                                               (2)
                                                                                                        Gxx Gyy
where all of the quantities involved can be calculated from the recorded total noise signature data at the given locations.
   The coherent output method then provides the estimate
                                                                                                      2
                                                                                               Gvv = γxy Gyy                                                                                    (3)
for the component Gvv of the total measured spectra, Gyy , at a location of interest that is coherent with a signal at
another measurement location.

                                                                                                       9 of 16

                                                                              American Institute of Aeronautics and Astronautics
Figure 9 shows the coherence between the two core-exhaust-mounted ITPs for test points 4–7, which correspond
to the power settings of 60%, 70%, 80%, and 90%. Coherence, by definition (and in theory), ranges between zero and
unity, where perfect coherence exists at the latter value. Perfect coherence implies a direct linear dependence of one
signal on the other. A nonzero coherence value implies the dependence of both signals on a common source in the
presence of other unrelated signals at both locations. A zero value implies that the two signals are independent. In
practice, where the time series are always finite, a zero coherence value will not be achieved even for perfectly unre-
lated signals. A statistical estimate is then used to judge if the signals are uncorrelated. This estimate (95% confidence
level) is shown as the green line in the panels of this figure. Any computed coherence value lower than this limit is
not significant and the two signals are considered as fully independent. The broadband coherence displayed between
the ITPs for different power settings is above the statistical limit in the region of expected broadband combustor noise,
approximately 100-500 Hz, with the upper limit increasing slightly with the power setting. In addition, SPF tones and
some harmonics can be identified for the low-pressure and high-pressure spools as well as the fan shaft, with the latter
being particularly prominent at higher power settings.

                1                                                                                            1
                                                                          Coherence
               0.9                                                        Limit                             0.9

               0.8                                                                                          0.8                    SPFL

               0.7                   SPFL                                                                   0.7
                                                                                                                      SPFF
   Coherence

                                                                                                Coherence
               0.6                                                                                          0.6
                                                                                                                                                         2SPFL
                                                                                                                                                                            2SPFH
               0.5                                   2SPFL                2SPFH                             0.5

               0.4                                                                                          0.4
                         SPFF                 SPFH                                                                                           SPFH
               0.3                                                                                          0.3

               0.2                                                                                          0.2

               0.1                                                                                          0.1

                0                                                                                            0
                     0     200      400     600    800    1000     1200    1400   1600                            0    200   400       600       800    1000     1200     1400   1600
                                             Frequency, Hz                                                                                Frequency, Hz
  (a)                                                                                           (b)

                1                                                                                            1
                          SPF                                                                                                SPF
                                F                                                                                                  F
               0.9                                                                                          0.9
                                                                                                                                          SPFL
               0.8                          SPFL                                                            0.8

               0.7                                                        2SPFH                             0.7                                                         2SPFL
                                                                  2SPFL
   Coherence

                                                                                                Coherence

               0.6                                                                                          0.6

               0.5                                                                                          0.5

               0.4                                                                                          0.4
                                                   SPFH
               0.3                                                                                          0.3                                  SPFH

               0.2                                                                                          0.2

               0.1                                                                                          0.1

                0                                                                                            0
                     0     200      400     600    800    1000     1200    1400   1600                            0    200   400       600       800    1000     1200     1400   1600
                                             Frequency, Hz                                                                                Frequency, Hz
  (c)                                                                                           (d)

Figure 9. Coherence between ITPs NE801 (6 o’clock) and NE802 (7 o’clock) signals at a) 60%, b) 70%, c) 80%, and d) 90% power settings

    The top panels in Fig. 10 show the total noise signature and the educed combustor-noise component at the midfield-
microphone location and the 130◦ farfield-microphone location for the 60% power setting. The combustor-noise con-
tribution to the SPL was estimated using the 2-signal coherent output method, Eq. (3), with either the 6 o’clock (red
curves) or the 7 o’clock (blue curves) ITP providing the reference signal. The corresponding coherence results are
shown in lower panels of this figure. Broadband combustor noise is quite apparent in the expected frequency range
of 100-500 Hz at both the midfield and farfield locations. Additionally, another broadband hump appears in both the
midfield and farfield spectra at around 700-1000 Hz when the 7 o’clock ITP (NE802) serves as a reference. Low- and
high-pressure shaft passing frequencies and some harmonics can also be discerned in the coherence at midfield and

                                                                                         10 of 16

                                                                 American Institute of Aeronautics and Astronautics
farfield locations.

                                100                                                                                                           90
                                                                                MF101 Total                                                                                              FF021 Total
                                                                                Limit                                                                                                    Limit
                                 90                                             2s MF101-NE801                                                80                                         2s FF021-NE801
  Narrowband (6.1 Hz) SPL, Hz

                                                                                                                Narrowband (6.1 Hz) SPL, Hz
                                                                                2s MF101-NE802                                                                                           2s FF021-NE802

                                 80                                                                                                           70

                                 70                                                                                                           60

                                 60                                                                                                           50

                                 50                                                                                                           40

                                 40                                                                                                           30
                                      0   200   400       600   800   1000     1200    1400   1600                                                 0   200   400     600   800   1000   1200    1400   1600
                                                           Frequency, Hz                                                                                              Frequency, Hz
  (a)                                                                                                       (b)

                                  1                                                                                                           1
                                                                                  MF101-NE801                                                                                              FF021-NE801
                                0.9                                               MF101-NE802                                            0.9                                               FF021-NE802
                                                                                  Limit                                                                                                    Limit
                                0.8                                                                                                      0.8

                                0.7                                                                                                      0.7                  SPFL
          Coherence

                                0.6
                                                                                                            Coherence
                                                                                                                                         0.6
                                                 SPF
                                                      L
                                0.5                                                                                                      0.5
                                                                                                                                                                                               2SPFH
                                0.4                                                                                                      0.4
                                                                                      2SPFH                                                                                   2SPFL
                                                                                                                                                                       SPFH
                                0.3                                                                                                      0.3

                                0.2                                                                                                      0.2

                                0.1                                                                                                      0.1

                                  0                                                                                                           0
                                      0   200   400       600   800   1000     1200    1400   1600                                                 0   200   400     600   800   1000   1200    1400   1600
                                                           Frequency, Hz                                                                                              Frequency, Hz
  (c)                                                                                                       (d)

Figure 10. Midfield (a) and farfield (b) SPL and corresponding coherence (c) and (d) at 60% power, test point 4. Educed combustor SPL
component and coherence using ITP NE801, 6 o’clock position, (red curves) and ITP NE802, 7 o’clock position, (blue curves)

    The estimated duct-mode cut-on/off frequencies at the core-nozzle exit for various power settings are shown in
Table A 2 based on an engine-deck simulation for the DGEN 380 engine. The frequencies in this table are given to a
sufficient number of significant digits so that the trends are clearly displayed. Unfortunately, precise information on
how well the simulated conditions describe the actual engine conditions during this test is not available. In addition,
the simulation was run for slightly different ambient condition than those of the test. However, an estimate of how
representative the simulation is for the actual core-flow conditions can be obtained by comparing the exit-gas temper-
ature provided by the simulation to that reported by the engine control system. This leads to the conclusion that actual
and simulated mean-flow data should be within 4% of each other in the core nozzle.
    Based on Eqs. (A 1) and (A 2), it follows that the uncertainty in the predicted duct-mode cut-on/off frequencies is
given by
                                          |∆fc |    |∆c|        M2         |M |
                                                 6       +√             ×       .                                    (4)
                                            fc        c        1−M    2     M
Since the core-nozzle flow is hot, the (subsonic) Mach number is going to be rather modest and it can be assumed that
the factor multiplying the Mach-number relative error in Eq. (4) is of order unity (or less). Furthermore, the speed of
sound to leading order depends on the square root of the static temperature; hence, its relative error should be 2%.
Consequently, the Mach-number relative error could be as high as 6%. This leads to the conclusion that the upper
bound on the relative error for the predicted duct-mode cut-on/off frequencies, as they apply to the current test, is 8%.
    Using this information in combination with Table A 2 shows that the cut-on/off frequency for the (±1,0) duct
mode falls somewhere in the range of 730–860 Hz for the conditions corresponding to Fig. 10. It is therefore con-

                                                                                                     11 of 16

                                                                             American Institute of Aeronautics and Astronautics
cluded that the second broadband hump in the combustor-noise component is associated with the cut-on of the first
azimuthal mode. Why this feature is not visible when the 6 o’clock ITP (NE801) serves as a reference is not clear at
present, but this issue will be further explored in a planned upcoming experiment with a more extensive circumferential
instrumentation at the core-nozzle exit.

                                100                                                                                                            90
                                                                                 MF101 Total                                                                                                    FF021 Total
                                                                                 Limit                                                                                                          Limit
                                 90                                              2s MF101-NE801                                                80                                               2s FF021-NE801
  Narrowband (6.1 Hz) SPL, Hz

                                                                                                                 Narrowband (6.1 Hz) SPL, Hz
                                                                                 2s MF101-NE802                                                                                                 2s FF021-NE802

                                 80                                                                                                            70

                                 70                                                                                                            60

                                 60                                                                                                            50

                                 50                                                                                                            40

                                 40                                                                                                            30
                                      0   200   400     600      800   1000     1200   1400    1600                                                 0   200   400     600      800   1000      1200   1400   1600
                                                             Frequency, Hz                                                                                                 Frequency, Hz
  (a)                                                                                                        (b)

                                  1                                                                                                            1
                                                                                   MF101-NE801                                                                                                    FF021-NE801
                                0.9                                                MF101-NE802                                            0.9                                                     FF021-NE802
                                                                                   Limit                                                                                                          Limit
                                0.8                   SPFL                                                                                0.8

                                0.7                                                                                                       0.7
                                                                                         2SPFH
          Coherence

                                                                                                             Coherence

                                0.6                                                                                                       0.6
                                                               SPFH                                                                                                                                     2SPFH
                                0.5                                                                                                       0.5

                                0.4                                                                                                       0.4                       SPFL

                                0.3                                                                                                       0.3
                                                                                                                                                                                       2SPFL
                                0.2                                                                                                       0.2                                SPFH

                                0.1                                                                                                       0.1

                                  0                                                                                                            0
                                      0   200   400     600      800   1000     1200   1400    1600                                                 0   200   400     600      800   1000      1200   1400   1600
                                                             Frequency, Hz                                                                                                 Frequency, Hz
  (c)                                                                                                        (d)

Figure 11. Midfield (a) and farfield (b) SPL and corresponding coherence (c) and (d) at 70% power, test point 5. Educed combustor SPL
component and coherence using ITP NE801, 6 o’clock position, (red curves) and ITP NE802, 7 o’clock position, (blue curves)

     Figures 11–13 show the same information as in Fig. 10, but for the 70%, 80%, and 90% power settings (test points
5–7), respectively. As can be seen in these figures, the frequency range of combustor-noise component, educed by
using either of the two ITPs, increases with the power level. At the 70% power level, the upper limit is at least 550 Hz.
Also, the secondary hump in the two-signal results obtained using the 7 o’clock ITP (NE802) is still clearly identifiable
in the spectra. At 80% and 90% power, the upper frequency limit of the deduced broadband combustor noise is about
800 Hz and at least 900 Hz, respectively. It is not clear whether the secondary hump in the combustor-noise spectra,
observed at the lower power settings, now is below the levels that can be detected by the present two-signal method or
if the two humps have simply merged, i.e. they no longer have a clear demarcation. This latter uncertainty also points
to the need for a careful circumferential mapping of the sound field at the core-nozzle exit.

                                                                                              V.      Summary
    An initial analysis of acoustic data acquired during a baseline test using the new DART resource at NASA GRC
is presented here. This test is part of an effort to develop a better understanding of the core/combustor-noise source
leading to improved mitigation techniques and airport-community-noise prediction methods. The acoustic data are
deemed to be of high quality, compares well with results from a quick feasibility test carried out in 2014, and will

                                                                                                      12 of 16

                                                                              American Institute of Aeronautics and Astronautics
100                                                                                                            90
                                                                              MF101 Total                                                                                                 FF021 Total
                                                                              Limit                                                                                                       Limit
                                 90                                           2s MF101-NE801                                                   80                                         2s FF021-NE801
  Narrowband (6.1 Hz) SPL, Hz

                                                                                                                 Narrowband (6.1 Hz) SPL, Hz
                                                                              2s MF101-NE802                                                                                              2s FF021-NE802

                                 80                                                                                                            70

                                 70                                                                                                            60

                                 60                                                                                                            50

                                 50                                                                                                            40

                                 40                                                                                                            30
                                      0   200    400   600    800   1000     1200      1400    1600                                                 0   200    400   600   800    1000   1200    1400   1600
                                                        Frequency, Hz                                                                                                 Frequency, Hz
  (a)                                                                                                        (b)

                                  1                                                                                                            1
                                                                                MF101-NE801                                                                                                  FF021-NE801
                                0.9                                             MF101-NE802                                               0.9                                                FF021-NE802
                                          SPFF         SPFL                     Limit                                                                                                        Limit
                                0.8                                                                                                       0.8
                                                                                                                                                                     SPF
                                                                                                                                                                       L
                                0.7                                                      2SPFH                                            0.7
                                                                                                                                                                                                   2SPFH
          Coherence

                                0.6                           SPF

                                                                                                             Coherence
                                                                H                                                                         0.6
                                                                                                                                                                           SPFH
                                                                                                                                                        SPFF                             2SPFL
                                0.5                                         2SPF                                                          0.5
                                                                                   L

                                0.4                                                                                                       0.4

                                0.3                                                                                                       0.3

                                0.2                                                                                                       0.2

                                0.1                                                                                                       0.1

                                  0                                                                                                            0
                                      0   200    400   600    800   1000     1200      1400    1600                                                 0   200    400   600   800    1000   1200    1400   1600
                                                        Frequency, Hz                                                                                                 Frequency, Hz
  (c)                                                                                                        (d)

Figure 12. Midfield (a) and farfield (b) SPL and corresponding coherence (c) and (d) at 80% power, test point 6. Educed combustor SPL
component and coherence using ITP NE801, 6 o’clock position, (red curves) and ITP NE802, 7 o’clock position, (blue curves)

serve as a solid baseline for future work. Combustor-noise components of total noise signatures are educed using a
two-signal source-separation method and are found to occur in the expected frequency range. The results also suggest
that both the plane-wave mode and the first azimuthal mode, are present at the core-nozzle exit for this turbofan
engine—which will be further investigated in the near future.

                                                                                                 APPENDIX
                                                                     A.        Cut-On/Off Helmholtz Number
    The confined geometry leads to the existence of a multitude of acoustic modes, (m,n), where m and n denote
the azimuthal and radial mode numbers, respectively in the engine-internal passageways of turbofans. The plane
wave mode (0,0) can always propagate, but the other modes can only propagate if the frequency is higher than a
mode-dependent cut-on/off value. If the frequency is less than this value, the mode is evanescent.
    In the absence of any significant swirl, which is generally the situation in inter-turbine ducts and nozzles, a common
leading-order approximation is to assume the mean flow as locally uniform with constant properties. See Eversman6
for a discussion of duct acoustics and a comprehensive list of references. If the frequency of the acoustic mode is
expressed in terms of the nondimensional Helmholtz number, i.e.

                                                                                              ω = 2πf∗ b∗ /c∗ ,                                                                                            (A 1)

where f∗ , b∗ , and c∗ are the dimensional frequency, outer duct radius, and local speed of sound, respectively, it turns

                                                                                                      13 of 16

                                                                           American Institute of Aeronautics and Astronautics
100                                                                                                                90
                                                                                    MF101 Total                                                                                                  FF021 Total
                                                                                    Limit                                                                                                        Limit
                                 90                                                 2s MF101-NE801                                                 80                                            2s FF021-NE801
  Narrowband (6.1 Hz) SPL, Hz

                                                                                                                     Narrowband (6.1 Hz) SPL, Hz
                                                                                    2s MF101-NE802                                                                                               2s FF021-NE802

                                 80                                                                                                                70

                                 70                                                                                                                60

                                 60                                                                                                                50

                                 50                                                                                                                40

                                 40                                                                                                                30
                                      0   200    400   600      800       1000     1200     1400   1600                                                 0   200    400   600     800     1000   1200     1400   1600
                                                        Frequency, Hz                                                                                                     Frequency, Hz
                                (a)                                                                                                                (b)

                                  1                                                                                                                1
                                                                                      MF101-NE801                                                                                                  FF021-NE801
                                0.9                                                   MF101-NE802                                             0.9                                                  FF021-NE802
                                                         SPFL
                                                                                      Limit                                                                                                        Limit
                                0.8                                                                                                           0.8

                                0.7       SPFF                  SPF                                                                           0.7
                                                                      H                                                                                                   SPFL
                                                                                          2SPFL
          Coherence

                                0.6
                                                                                                                  Coherence
                                                                                                                                              0.6           SPFF
                                0.5                                                                                                           0.5
                                                                                                                                                                                 SPFH
                                0.4                                                                                                           0.4                                                      2SPFL
                                0.3                                                                                                           0.3

                                0.2                                                                                                           0.2

                                0.1                                                                                                           0.1

                                  0                                                                                                                0
                                      0   200    400   600      800       1000     1200     1400   1600                                                 0   200    400   600     800     1000   1200     1400   1600
                                                        Frequency, Hz                                                                                                     Frequency, Hz
  (c)                                                                                                             (d)

Figure 13. Midfield (a) and farfield (b) SPL and corresponding coherence (c) and (d) at 80% power, test point 6. Educed combustor SPL
component and coherence using ITP NE801, 6 o’clock position, (red curves) and ITP NE802, 7 o’clock position, (blue curves)

out that the cut-on/off value is given by                                                                 p
                                                                                            ωmnc =            1 − M 2 λmn ,                                                                                       (A 2)
where 0 6 M < 1 is the local Mach number. The λnm are the roots of

                                                       Ym0 (λmn a)Jm
                                                                   0           0
                                                                     (λmn ) − Jm (λmn a)Ym0 (λmn r) = 0 ,                                                            n = 0, 1, . . . ,                            (A 3)

where Jm and Ym are the Bessel functions of the first and second kind of order m, the prime indicates derivative with
respect to the argument, and a is the nondimensional inner radius of the duct. The eigenvalue index n is referred to as
the radial mode order and indicates the number of pressure nodes (zeroes) in the radial profile. Note that the eigen-
values λmn for hard-wall ducts are real and form an infinite set. Moreover, λmn only depends on the nondimensional
inner radius, a, i.e. the duct geometry, and hence can be interpreted as the no-flow cut-on/off Helmholtz number,
  (0)
ωmnc = λmn .
    Table A 1 lists a sample of the eigenvalues λmn , i.e. the roots of Eq. (A 3), to four decimal places for a = 0.805,
which corresponds to the geometry at the core-nozzle exit. The plane-wave (or bulk) modes (0,0) are always cut on.
Note that as the Helmholtz number is increased from zero, the (m,0) modes, with ±m = 1-14 are successively cut on
before the first radial mode (0,1) is cut on. It turns out that the cut-on/off Helmholtz numbers for radial modes (n 6= 0)
increase with decreasing duct height. This is the reason why so many azimuthal modes are sequentially cut on before
the first radial mode can propagate in this case. The cut-on/off Helmholtz number for any subsonic Mach number can
now be calculated using Table A 1 and Eq. (A 2).

                                                                                                          14 of 16

                                                                                 American Institute of Aeronautics and Astronautics
Table A 1. No-flow cut-on/off Helmholtz Numbers, λmn , for an annular duct with a = 0.805

                                                 n=0        n=1        n=2         n=3         n=4
                                   m=0             0       16.1394    32.2359     48.3418     64.4502
                                   m=1          1.1102     16.1783    32.2552     48.3547     64.4598
                                   m=2          2.2200     16.2944    32.3131     48.3933     64.4887
                                   m=3          3.3295     16.4863    32.4094     48.4575     64.5369
                                   m=4          4.4382     16.7514    32.5437     48.5472     64.6043
                                   m=5          5.5459     17.0864    32.7156     48.6624     64.6908
                                   m=6          6.6524     17.4877    32.9245     48.8028     64.7964
                                   m=7          7.7575     17.9509    33.1697     48.9683     64.9210
                                   m=8          8.8609     18.4718    33.4505     49.1585     65.0645
                                   m=9          9.9624     19.0459    33.7659     49.3732     65.2268
                                   m = 10       11.0618    19.6689    34.1152     49.6121     65.4076
                                   m = 11       12.1588    20.3366    34.4971     49.8748     65.6069
                                   m = 12       13.2534    21.0452    34.9108     50.1610     65.8246
                                   m = 13       14.3452    21.7910    35.3552     50.4703     66.0603
                                   m = 14       15.4342    22.5707    35.8291     50.8022     66.3140
                                   m = 15       16.5202    23.3814    36.3314     51.1564     66.5855
                                   m = 16       17.6031    24.2201    36.8610     51.5324     66.8744

    Mean-line data needed to convert the no-flow cut-on/off Helmholtz numbers to dimensional frequencies at flow
conditions, using Eqs. (A 1) and (A 2), were obtained using an engine-deck simulation for the DGEN 380 turbofan.
Table A 2 shows the resulting estimated cut-on/off frequencies for select duct modes at the core-nozzle exit at the 60%,
70%, 80%, and 90% power settings. As can be seen in this table, the radial (n 6= 0) duct-mode frequencies are well
outside of the range of interest for combustor noise.

     Table A 2. Select estimated cut-on/off duct-mode frequencies (Hz) at the core-nozzle exit at 60 %, 70 %, 80 % and 90 % power

                                        Power               n=0       n=1        n=2         n=3
                                        60 %       m=0        0      11,532     23,033      34,541
                                                   m=1       793     11,559     23,047      34,550
                                                   m=2      1,586    11,642     23,088      34,577
                                                   m=3      2,378    11,779     23,157      34,623
                                        70 %       m=0        0      11,491     22,951      34,417
                                                   m=1       790     11,518     22,964      34,426
                                                   m=2      1,580    11,601     23,005      34,454
                                                   m=3      2,370    11,738     23,074      34,500
                                        80 %       m=0        0      11,465     22,900      34,341
                                                   m=1       789     11,493     22,913      34,350
                                                   m=2      1,577    11,575     22,954      34,377
                                                   m=3      2,365    11,711     23,023      34,423
                                        90 %       m=0        0      11,414     22,797      34,187
                                                   m=1       785     11,441     22,810      34,196
                                                   m=2      1,570    11,523     22,851      34,223
                                                   m=3      2,355    11,659     22,919      34,268

                                                                 15 of 16

                                            American Institute of Aeronautics and Astronautics
References
     1 Berton, J. B., Envia, E., and Burley, C. L., “An Analytical Assessment of NASA’s N+1 Subsonic Fixed Wing Project Noise Goal,” AIAA

Paper 2009-3144, 16th AIAA/CEAS Aerocoustics Conference, Miami, Florida, 2009.
     2 Hultgren, L. S., Miles, J. H., and Jorgenson, P. C. E., “Engine System and Core Noise,” Assessment of NASA’s Aircraft Noise Prediction

Capability, edited by M. D. Dahl, chap. 3, NASA/TP-2012-215653, 2012, pp. 35–62.
     3 Hultgren, L. S., “A First Look at the DGEN380 Engine Acoustic Data From a Core-Noise Perspective,” Tech. Rep. NASA/TM–2015-218924,

NASA, 2015.
     4 Bendat, J. S. and Piersol, A. G., Engineering Applications of Correlation and Spectral Analysis, Wiley-Interscience, 1980.
     5 Ahuja, K. K., “Designing Clean Jet-Noise Facilities and Making Accurate Jet-Noise Measurements,” International J. Aeroacoustics, Vol. 2,

No. 3&4, 2003, pp. 371–412.
     6 Eversman, W., “Theoretical Models for Duct Acoustic Propagation and Radiation,” Aeroacoustics of Flight Vehicles: Theory and Practice,

edited by H. H. Hubbard, Vol. 2, chap. 13, NASA Reference Publication 1258, WRDC Technical Report 90-3052, 1991, pp. 101–163.

                                                         Acknowledgments
    This work is supported by the NASA Advanced Air Vehicles Program, Advanced Air Transport Technology
Project, under the Aircraft Noise Reduction Subproject. The AAPL staff are thanked for their expertise and dedi-
cation in preparing and executing the 2017 test campaign. Joseph W. Connolly of the NASA GRC Intelligent Control
and Autonomy Branch is thanked for previously supplying relevant engine operational parameters obtained from the
DGEN SIMMOT simulation system.
    Trade names and trademarks are used in this report for identification only. Their usage does not constitute an
official endorsement, either expressed or implied, by the National Aeronautics and Space Administration.

                                                                   16 of 16

                                              American Institute of Aeronautics and Astronautics
You can also read