Acea Investor Presentation - ''ITALIAN INVESTMENT CONFERENCE 2021 'ITALIAN INVESTMENT - Gruppo Acea
←
→
Page content transcription
If your browser does not render page correctly, please read the page content below
Acea Investor
  Presentation

    ‘‘ITALIAN INVESTMENT
       CONFERENCE
‘‘ITALIAN         2021’’
           INVESTMENT
 CONFERENCE
       May 19,2021’’
               2021
     May 19, 2021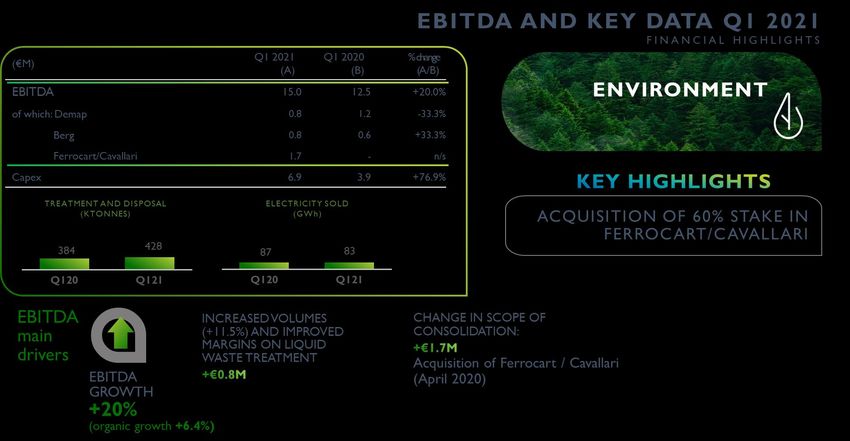
Agenda

         ACEA GROUP TODAY

         BUSINESS PLAN 2020-2024

                  STRATEGY AND TARGETS

                  BUSINESS LINE HIGHLIGHTS

                  STRATEGIC OPPORTUNITIES

         CLOSING REMARKS

  ?      Q&A

                                                                                    2
                                             MIL   201027_Piano Acea_Documento pe
                                                                 ...
Agenda

         ACEA GROUP TODAY

         BUSINESS PLAN 2020-2024

                  STRATEGY AND TARGETS

                  BUSINESS LINE HIGHLIGHTS

                  STRATEGIC OPPORTUNITIES

         CLOSING REMARKS

  ?      Q&A

                                                                                    3
                                             MIL   201027_Piano Acea_Documento pe
                                                                 ...
Acea is a leading multi-utility player in the Italian market
                                                                                                                                            Commercial &
2020 EBITDA                                                                 Water                                                           Trading                                                 Power generation
                                                                                                                                                                                              Green               With 269 MW
                                                                  Leader                          With more                        One of                    With 7.0                         player                 of installed
                                                                in the water                       than 9 M                       the main                     TWh                          in power                  capacity1
                     €1,155M                                  supply sector in                 customers                           players in the         of electricity sold           generation in Italy
                     EBITDA                                          Italy                        in Lazio,                        Italian energy
                       2020                                                                      Toscana,                               market
                                                                                                                                                                                                    Engineering and
                                                                                               Umbria, Molise e
                                                                                                 Campania
                                                                                                                                                                                                    services
               85% regulated                                                                                                                                                               Business line              With more
                                                                            Energy
                                                                                                                                                                                             offering               than 100 M€
Ownership structure                                                         Infrastructure                                                  Environment                                 technical                    of services
(Source: based on proof of share ownership filed
for AGM of April 2021)                                                                                                                                                                  services to                     every year
                     Caltagirone                                                                                                                                                             the Group
                     5.7%                                       Leading                       With ~9 TWh                         4th player                With ~
                                                                                                                                                                 1.6
                                                               Italian player in               of distributed                     in the Italian             M tons
Market                                     Roma                  the electricity                  electricity                    waste treatment             of treated /                           Gas distribution
20%                                        Capitale               distribution                                                        sector              disposed waste
                                           51%                      market                                                                                                                          Entry in the gas distribution
                                                                                                                                                                                                     business with ~100k
    Suez
    23.3%
                                                                                                                                                                                                    redelivery points

                                 Note: (1) ~120 from hydroelectric plants, ~97 from thermoelectric plants and 52 from photovoltaic plants
                                                                                                                                                                                                                             4
                                                                                                                                                    MIL            201027_Piano Acea_Documento pe
                                                                                                                                                                                 ...
Agenda

         ACEA GROUP TODAY

         BUSINESS PLAN 2020-2024

                  STRATEGY AND TARGETS

                  BUSINESS LINE HIGHLIGHTS

                  STRATEGIC OPPORTUNITIES

         CLOSING REMARKS

  ?      Q&A

                                                                                    5
                                             MIL   201027_Piano Acea_Documento pe
                                                                 ...
G                      R                          I                       D                                          S
      Growth             Renewables                 Innovation                  Delivery                               Sustainability
Growth driven by     …also supported by        …together with           …proving a                                …with increasing
regulated            investments in            investments for new      consistent track                          focus on
businesses, with     RES, both industrial      innovative services      record of                                 environmental
significant          scale and consumer        (VAS)                    outperforming                             impact and circular
investment related                                                      business plan                             economy
to RAB…                                                                 targets
      6.7%                747 MW                     0.6 B€                      >5%                                      -11 pp
    EBITDA CAGR        Installed PV capacity      Innovation capex      Avg. EBITDA outperformance
                                                                                                                      Water losses in 2024
       2019-24                 in 2024                2020-24              vs. plan (last 3 years)

     5.9 B€                 ~1000                    2200+                      4.7 B€                                     150+
                       Domestic PV plants in     EV charging stations                                                   «Smart Comp»
      2024 RAB                                                           Capex and M&A 2020-24
                              2024                    in 2024                                                         composters in 2024

            Acea as a leading player in infrastructure and sustainability
                                                                                                                                             6
                                                                          MIL        201027_Piano Acea_Documento pe
                                                                                                   ...
Strategy and targets                                                                                          EBITDA +6%/+8% versus 2020

Key financials                                                     2021 GUIDANCE                              CAPEX ~ €900M

                                                                                                              NET DEBT: €3.85÷€3.95B

EBITDA | M€                                                         NFP | M€                                                                                            RAB | B€
                                                                                                          3.1x            3.2x          3.0x
          CAGR +6.7%                                                                      2.9x
                                                                      NFP/EBITDA                                                                                                        CAGR +6.0%
                                                                                          0.7x            0.7x            0.8x          0.7x
                                    1,442                                NFP/RAB                                                                                                                                5.9
                                                                                                                                                                                       4.81        5.3
                    1,270                                                                                                              4,280
         1,155                                                                                                           4,007                                             4.4                                           Infr.
 1,042                                                                                                   3,528                                                                                                  2.7
                                                                                         3,063                                                                                          2.3            2.5
                                                                                                                                                                           2.2

                                                                                                                                                                                                       2.8      3.2      Water2
                                                                                                                                                                           2.2          2.5

 2019A   2020A      2022P           2024P                                                2019A          2020A            2022P         2024P                             2019A        2020A       2022P       2024P

Net Income | M€                                                      Dividend per share | € / share                                                                    Cumulative CAPEX | B€

         CAGR +6.2%                                                                   860M€ dividends distributed                                                                  Other CAPEX         Regulated CAPEX
                                                                                         throughout the plan

                                       382                                                                                                                                                       4.3
          285         317                                               0.78           0.80                                                                                                      0.8
  284
                                                                                                                                                                                                 3.5

 2019A   2020A      2022P            2024P                             2019A          2020A          2021P             2022P     2023P         2024P                                      Plan 20-24

                  Note: (1) Estimated value; (2) Water RAB value does not consider RAB of sub-consolidated companies                                                                                              7
                                                                                                                                 MIL              201027_Piano Acea_Documento pe
                                                                                                                                                                ...
Strategy and targets
Key financials

EBITDA | M€
                                                                                             CAGR +6.7%

                                            CAGR +6.8%                                                                                   CAGR +6.6%

 1,155              1
   6
  45
  72
   50

  368

                                                                                                                                                                                                              2

  614

 2020A

              Notes: (1) Does not represent –2M€ from the sum of Engineering & services, Overseas business and Corporate costs; (2) Includes Engineering & services, Overseas business and Corporate costs;
                                                                                                                                                                                                              8
                                                                                                                                  MIL                201027_Piano Acea_Documento pe
                                                                                                                                                                   ...
Strategy and targets
CAPEX and M&A

CAPEX e M&A evolution | B€

                             Total 4.7 B€                                                                 Total 4.3 B€
            CAPEX 4.3 B€                    M&A 0.4 B€                          Regulated 3.5 B€                         Other 0.8 B€

                                                           M&A

                                                           Innovation

                                                                                                           4.3 B€

                                                                                                         Regulated CAPEX
                                                           Organic
                                                           growth

                                                                              More than 80% RAB investments

                                                                                                                                    9
                                                         MIL            201027_Piano Acea_Documento pe
                                                                                      ...
Strategy and targets
Innovation as a driver for growth
I N N O VAT I O N

Capex related to Innovation | M€, 2020-2024   Selected initiatives
                                                      500k+ smart meters installed

                                                      Grids’ performance optimization through Water Management
                                                      System

                                                      1.3M 2G smart meters installed

                                                      New Control center for grids’ management

                                                      +100K digital customers (acquired through digital channels)

                                                      2,200+ EV charging stations installed

                                                      150+ “Smart Comp” composters installed

                                                      Corporate data lake and data-driven asset management
                                                      (data-driven company)

                                                      Development of new Salesforce CRM platform

                                                                                                                 10
                                                         MIL          201027_Piano Acea_Documento pe
                                                                                    ...
More than 2B€ related to specific sustainability targets with highest relevance
and priority to the Group
SUSTAINABILITY
Sustainable Development Goals (SDGs) CAPEX related to sustainability targets | M€, 2020-2024
Related to investments in 2.1B€ of investments related to sustainability targets over the plan
sustainability
(+400M€1 vs. previous Business Plan):
263 water losses reduction
220 resiliency of Rome aqueduct system
127 efficiency of purification system
234 installation of smart meters for water and electricity
492 resiliency and efficiency of electric grids
58 infrastructure modernization and remote mgmt.
Acea sustainability rating
4452 circular economy treatment of waste
29 e-mobility infrastructure
A- EE- 78/100
Leadership Positive 212 increase of green energy generation
Note: (1) +180M€ related to the installation of smart water and electric meters, +120M€ related to efficiency and resiliency of electric grids, +100M€ to improve the efficiency of the purification system;
(2) Includes 206M€ of M&A capex 11
MIL 201027_Piano Acea_Documento pe
...New and more challenging targets vs previous business plan
SUSTAINABILITY
Acea targets at 2024 (vs. 2019)
8
DECENT WORK
AND ECONOMIC
GDP and employment increase +5.8 B€ +21k
GROWTH Preliminary and partial estimate only for the selected period GDP stable FTEs
-11 pp1 +36
6
CLEAN WATER Water resource protection losses reduction
AND SANITATION rationalized
Losses reduction, IoT grids’ management, rationalization of purification system (440+ Mm3 of
purification plants
resource saved)
AFFORDABLE
Quality of electricity service -40% ~2,600
7 AND CLEAN
Intervention Risk cabins involved
ENERGY Improved resiliency of electric grids
Index (IRI)
INDUSTRY,
9 INNOVATION AND
INFRASTRUCTURE Smart city +2,200 ~1.8M2
SUSTAINABLE 2G and water
Installation of EV charging stations and water / electric smart meters charging stations
11 CITIES AND
COMMUNITIES
smart meter
RESPONSIBLE
CONSUMPTION
Circular economy +1.6 Mton -45%
12 AND Waste treated with circular economy logics and reduction of sludge coming out of (+120%) sludge coming out of
PRODUCTION purification plants waste treated purification thanks to process
innovation (drying)
CLIMATE Green energy -43% >140 kton/y
13 ACTION gCO2/KWh produced CO2 avoided for
Increase in production and consumption of green energy
by Acea produzione internal consumption
Note: (1) Weighted average for the area; (2) 1.3M of meters related to the Energy Infrastructure business (Areti) and 0.5M meters related to the Water business
12
MIL 201027_Piano Acea_Documento pe
...Strategy and targets
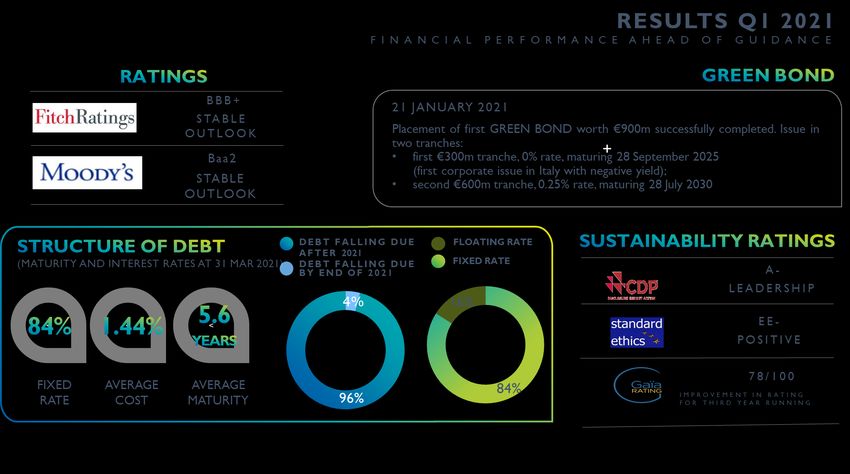
Solid financial structure
Highlights Net Financial Position | B€
4.0 4.3
3.1 3.5
Rating
BBB+ Baa2
Outlook stable Outlook stable 2019A 2020A 2022P 2024P
NFP / EBITDA 2.9x 3.1x 3.2 3.0x
Debt As of March 31, 2021 NFP / RAB 0.7x 0.7x 0.8 0.7x
5.6 years average debt duration
1.44% average cost of debt Financial marurities as of March 2021 | M€
84% fixed rate debt 799
688
Green Bond January 21st, 2021 – Acea successfully completed its 600 630
first green bond issuance worth €900m in two 552 575 557
tranches, under the Green Financing Framework and
form part of €4bn EMTN programme: 390
first tranche of €300m, coupon 0%, maturity
September 28th, 2025 207
second tranche €600m, coupon 0.25%, maturity July 98
28th, 2030
2021 2022 2023 2024 2025 2026 2027 2028 2029 2030
13
MIL 201027_Piano Acea_Documento pe
...Agenda
ACEA GROUP TODAY
BUSINESS PLAN 2020-2024
STRATEGY AND TARGETS
BUSINESS LINE HIGHLIGHTS
STRATEGIC OPPORTUNITIES
CLOSING REMARKS
? Q&A
14
MIL 201027_Piano Acea_Documento pe
...New organizational structure to maximize the value generated from the portfolio of
businesses
NEW O R G AN I Z AT I O N
Operations Commercial Generation / overseas
Generation
Commodity
Water Environment
Infrastructure Overseas
Engineering Smart Services
15
MIL 201027_Piano Acea_Documento pe
...Agenda
Operations Commercial Generation / overseas
Generation
Commodity
Environment
Water
Infrastructure Overseas
Smart Services
Engineering
16
MIL 201027_Piano Acea_Documento pe
...Water
Main initiatives
Smart water meters installation plan and +500k
projects for grids’ districtualization Smart meters installed
Development of a
On-going pursuit of water resource protection -11 pp
Smart Water Company and losses reduction water losses1
for the sustainability of
Rationalization of small water purification 36
the water resource plants Rationalized plants
through improved Grids’ performance optimization through Water -15 pp
Management System
quality and efficiency Failures incidence
Ensuring water supply continuity through the
doubling of Peschiera and Marcio aqueducts
170 M€
Expansion through CAPEX
tenders in new SII Terni full consolidation (32 municipalities in
the Province of Terni; November 2020)
>220K
territories CLIENTS SERVED
Note: (1) Weighted average for the area, equal to 440+ Mm3 of saved water over the plan
17
MIL 201027_Piano Acea_Documento pe
...Water
Key financials
CAGR +6.9%
CAGR +8.2% CAGR +5.0%
EBITDA, M€
1
614
2020A
CAGR +5.9%
ATO2, ATO5, Gori, AdF Sub-consolidated companies
CAPEX, M€
4.4
RAB, B€
3.7 2 4.1
476
3.3 1.2
1.2 1.3
1.2
2.8 3.2
2.2 2.5
2020A 2019A 2020A 2022P 2024P
Notes: Key financial also include numbers from the gas distribution business; (1) ~50 M€ related to the changes in the consolidation perimeter of AdF
(2) Estimated value 18
MIL 201027_Piano Acea_Documento pe
...Agenda
Operations Commercial Generation / overseas
Generation
Commodity
Environment
Water
Infrastructure Overseas
Smart Services
Engineering
19
MIL 201027_Piano Acea_Documento pe
...Energy Infrastructure
Main initiatives
A leading player in the Investments in grids’ resiliency with upgrades
on specific cabins rewarded with a premium vs. 145+ M€
CAPEX
energy transition the reference WACC
process through Digitalization through remote control and IoT 60%+
solutions on private and public grids MV/LV cabins
projects aimed at
Development work on grids to reflect new
regulation on service continuity (penalty 155+ M€
increasing suspension recognized)
CAPEX
electrification and 1.3 M
Installation of 2G smart meters installed meters
at 2024
integration of the
New Control center for grids’ management 13+ M€
distributed generation CAPEX
20
MIL 201027_Piano Acea_Documento pe
...Energy Infrastructure
Key financials
CAGR +2.9%
CAGR +3.2% CAGR +2.6%
EBITDA, M€
368
2020A
CAGR +4.0%
Distribution Measurement
CAPEX, M€
2.5 2.7
RAB, B€
2.3 1 0.3
286 2.2 0.2 0.3
0.2
2.1 2.3 2.4
2.0
2020A 2019A 2020A 2022P 2024P
Note: (1) Estimated value
21
MIL 201027_Piano Acea_Documento pe
...Agenda
Operations Commercial Generation / overseas
Generation
Commodity
Environment
Water
Infrastructure Overseas
Smart Services
Engineering
22
MIL 201027_Piano Acea_Documento pe
...Environment
Main initiatives
«Core business» consolidation in energy
Market consolidation recovery (WtE), disposal of non-separated waste,
+0.5 Mt/y
added capacity at
towards circular and disposal / treatment of organic waste 2024
economy also with a Strengthening of the Waste-to-Material (WtM)
chain with circular economy approach (e.g. +0.6 Mt/y
«one-stop-shop» plastic, paper, ...)
added capacity at
2024
approach
Further development of the special waste
segment promoting synergies with Water (e.g.
+0.5 Mt/a
Acceleration to close the sludge) and WtE (e.g. ashes) segments
added capacity at
2024
waste loop in Central
Value creation from the post-merger integration
Italy of acquired companies and development of 15+
industrial synergies through operating model acquired plants at
2024
commissioning and control systems integration
23
MIL 201027_Piano Acea_Documento pe
...Environment
Key financials
CAGR +19.6%
CAGR +19.1% CAGR +20.4%
EBITDA,
M€
1
50
2020A
CAGR +17.8%
CAPEX AND M&A,
M&A
VOLUMES, Mt
2.9
M€
2.2
1.6
1.3
24
2020A 2019A 2020A 2022P 2024P
Note: (1) Includes growth related to M&A already closed as of September 2020
24
MIL 201027_Piano Acea_Documento pe
...Agenda
Operations Commercial Generation / overseas
Generation
Commodity
Environment
Water
Infrastructure Overseas
Smart Services
Engineering
25
MIL 201027_Piano Acea_Documento pe
...Engineering & services
Main initiatives
Development of a
Integration of the acquisition of SIMAM and focus
on core engineering activities
+10 M€
2024 EBITDA
building oriented Construction of plants through internalization of +440 M€
realized plants at
construction activities with an EPC view 2024
company tasked with
Performance improvement to reduce unitary +20%
turnkey management costs related to SII general contractor
margin insourcing
of construction and End-to-end management of investment with reduction of
execution time and strengthening of laboratory activities
engineering activities
Development of a commercial unit to support growth and of a
research center
26
MIL 201027_Piano Acea_Documento pe
...Engineering & services
Key financials
CAGR +11.6%
CAGR +14.4% CAGR +7.5%
EBITDA towards
EBITDA,
3rd parties
M€
15
2020A
CAGR +11.5%
CAPEX AND M&A,
M&A 392
359
EPC/FTE, k€
REVENUES
Deal in
2020
(Simam) 253
M€
7
2020A 2020 2022P 2024P
27
MIL 201027_Piano Acea_Documento pe
...Agenda
Operations Commercial Generation / overseas
Generation
Commodity
Environment
Water
Infrastructure Overseas
Smart Services
Engineering
28
MIL 201027_Piano Acea_Documento pe
...Commercial & trading: focus on energy commodity
Main initiatives
Commercial Focus on core territories with growth in the +240k
Center and South of Italy customers (net growth
vs 2019)
expansion in the
Center and South of Cross-selling and up-selling opportunities ~700k
thanks to regulated market phase-out in 2022 customers switching
to free market
Italy, supported by
regulated market Boost of dual fuel penetration (i.e. gas) on the +80k
existing customer base gas customers
vs 2019
phase-out and
Digital Attack through a new platform for +100k
«digital» offerings customer journey management digital customer
vs 2019
29
MIL 201027_Piano Acea_Documento pe
...Commercial & trading: focus on Smart Services
Main initiatives
Development of a Organic development of e-mobility segment with 2,200+
charging stations increase and value-added services charging stations
at 2024
Services-Based
Company to Push on energy efficiency services leveraging on 100+
opportunities from fiscal incentives condominiums
at 2024
strengthen the
Installation of «Smart Comp» composters,
relationship with managed remotely through an IoT platform
150+
composters installed
developed by Acea at 2024
customers and
increase Acea Group Installation of residential PV and solar thermal ~1,000
plants plants installed
at 2024
brands franchise
30
MIL 201027_Piano Acea_Documento pe
...Commercial & trading
Key financials
CAGR +12.2%
25,14
CAGR +9.1% CAGR +17.2%
EBITDA, M€
72
2020A
CtA1 Smart Services CRM
CAGR +3.2%
CUSTOMERS, #M
Gas Free Regulated
CAPEX, M€
1.5 1.6
1.4 1.4
0.8 0.7 1.2
1.2
44
0.4 0.5
0.2 0.2 0.3 0.4
2020A 2019A 2020A 2022P 2024P
Note: (1) Cost-to-Acquire = cost to acquire new customers
31
MIL 201027_Piano Acea_Documento pe
...Agenda
Operations Commercial Generation / overseas
Generation
Commodity
Environment
Water
Infrastructure Overseas
Smart Services
Engineering
32
MIL 201027_Piano Acea_Documento pe
...Generation
Main initiatives
Growth of PV portfolio RES growth to exploit opportunities from the 747 MW
decarbonization process installed at 2024
to exploit opportunities
Greenfield development of PV in industrial and 569 MW
from the energy and agricultural areas installed at 2024
transition and
M&A development to accelerate PV portfolio 178 MW
decarbonization growth installed at 2024
processes
Deconsolidation of PV stake to reduce financial
exposure and focus on PV investments to
-150 M€
NFP deconsolidation
become one of the main players in the sector
33
MIL 201027_Piano Acea_Documento pe
...Generation
Key financials
CAGR +6.9%
CAGR +5.5% CAGR +9.1%
EBITDA,
1
M€
45
2020A
CAPEX AND M&A,
M&A CAGR +31.1%
POWER, MWe
Thermo+ Hydro PV
979
M€
680
747
269 448
39 253
36 52
217 217 232 232
2020A 2019A 2020A 2022P 2024P
Fonte: (1) Post deconsolidation the EBITDA value is equal to the Net Income pertaining to the company
34
MIL 201027_Piano Acea_Documento pe
...Agenda
Operations Market Generation / overseas
Generation
Commodity
Environment
Water
Infrastructure Overseas
Smart Service
Engineering
35
MIL 201027_Piano Acea_Documento pe
...Overseas
Current positioning and key financials
Current positioning EBITDA | 2019-2024, M€
• Acea International: overseas CAGR +10.8%
holding (management,
scouting, tender monitoring) 25
• Acea Dominicana:
management of commercial
services for the north and east
regions of Dominican Republic
• Consorcio Agua Azul: 2020A
provision of water and
51% 100% 50% discharge services in the city CAPEX | M€
Aguazul Bogotá Acea International Consorcio of Lima
Servicio Sur
• Agua de San Pedro:
companies
Overseas
100% 44% 61% management of water services
for the city of San Pedro Sula
Acea Dominicana Consorcio Aguas de in Honduras
Agua Azul San Pedro 3
• Acea Peru: subsidiary
100% 100% established to scout and
Consorcio Acea Perù
develop opportunities in the 2020A
– Acea Dominicana country
Organic growth on the same perimeter
36
MIL 201027_Piano Acea_Documento pe
...Agenda
ACEA GROUP TODAY
BUSINESS PLAN 2020-2024
STRATEGY AND TARGETS
BUSINESS LINE HIGHLIGHTS
STRATEGIC OPPORTUNITIES
CLOSING REMARKS
? Q&A
37
MIL 201027_Piano Acea_Documento pe
...Strategic opportunities
Additional potential upsides
Selected strategic opportunities EBITDA 2024 | M€ CAPEX 2020-24 | M€
Water • Consolidation of existing concessions in
consolida- which Acea has a minority stake
+100 +400
tion • Expansion within regions of interest
Gas portfolio • Growth in gas distribution through tender
expansion participation in relevant territories (big
cities/ ATEM), leveraging on the first +10-20 +50-130
«tactical» acquisitions
Boost M&A - • Acceleration of market consolidation
Waste through further M&A transactions on
segments / geographies considered strategic +25-50 +200-400
for Acea
• Opportunity for Acea to play an active role in
Recovery
the development of major projects financed
Fund by the “Recovery Fund” to close the - -
infrastructural gap in areas where it is not
possible to invest with tariff incentives
38
MIL 201027_Piano Acea_Documento pe
...Strategic opportunities and upsides
Full potential EBITDA
Strategic opportunities Target full potential EBITDA upside at 2024 | B€
39
MIL 201027_Piano Acea_Documento pe
...Agenda
ACEA GROUP TODAY
BUSINESS PLAN 2020-2024
STRATEGY AND TARGETS
BUSINESS LINE HIGHLIGHTS
STRATEGIC OPPORTUNITIES
CLOSING REMARKS
? Q&A
40
MIL 201027_Piano Acea_Documento pe
...Closing remarks
Significant growth at 2024, while maintaining a balanced capital structure
6.7% of EBITDA CAGR with a 2024 target of 1.4 B€
Group net profit growing to 0.38 B€ in 2024
4.3 B€ of organic CAPEX (~850 M€ / year) and 0.4B€ capex from M&A (~80
M€ / year)
RAB growing to 5.9 B€ in 2024
Balanced NFP
/ EBITDA ratio over the plan reaching 3.0x in 2024 and
NFP/RAB of 0.7x in 2024
860 M€ of dividends to be distributed throughout the plan
41
MIL 201027_Piano Acea_Documento pe
...Agenda
ACEA GROUP TODAY
BUSINESS PLAN 2020-2024
STRATEGY AND TARGETS
BUSINESS LINE HIGHLIGHTS
STRATEGIC OPPORTUNITIES
CLOSING REMARKS
? Q&A
42
MIL 201027_Piano Acea_Documento pe
...Q&A
43
MIL 201027_Piano Acea_Documento pe
...Appendix
MIL 201027_Piano Acea_Documento pe
...TITOLO
Q1 2021 Results
CAPITOLO
TITOLO PRESENTAZIONE / Luogo e data
MIL 201027_Piano Acea_Documento pe
...46
47
48
49
50
51
52
53
54
55
56
57
58
TITOLO
2020 Results
CAPITOLO
TITOLO PRESENTAZIONE / Luogo e data
MIL 201027_Piano Acea_Documento pe
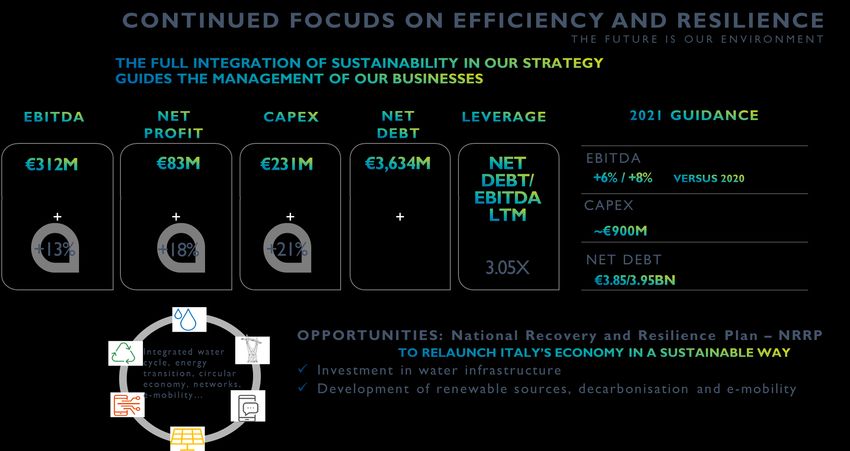
...P E R F O R M A N C E A N D D E L I V E RY
S U S TA I N A B I L I T Y A S A D R I V E R O F G RO W T H A N D VA L U E C R E AT I O N
REGULAT ED BUSINESSES SHOW LIMITED IMPACT ON
EXTRAORDINARY RESILIENC E ACTIVIT IES MOST
IN A CHALLENGING EXPOSED TO THE CRISIS
ENVIRONMENT
EBITDA
3.05X CAPEX
+11% +0.4% +14% IN LINE WITH
+
GUIDANCE, +
(~+22% normalised) DESPITE IMPACT
STRONG ONGOING 84% ON OF THE
ORGANIC VALUE REGULATED PANDEMIC AND
GROWTH CREATION ASSETS WIDER 0.74X NET DEBT
PERIMETER
60P E R F O R M A N C E A N D D E L I V E RY
D E V E L O P M E N T O F T H E B U S I N E S S M I X : AC Q U I S I T I O N S I N E N V I RO N M E N T
A N D P H OTO V O LTA I C S E C TO R S , C O N S O L I D AT I O N O F S I I T E R N I
< < <
APRIL 2020 M AY 2020
ACQUISITION OF 60% OF ‘‘FERROCART’’ ACQUISITION OF 70% OF SIMAM ACQUISITION OF
AND ‘‘CAVALLARI’’ leader in design, construction and operation PHOTOVOLTAIC PLANTS with
4 waste storage, treatment and sorting plants of liquid waste treatment plants, and in the total installed capacity of up to 52
(paper, steel, wood, plastic and metals), delivery of environmental and remediation MWp. Development of projects on
handling 145k tonnes per year projects, offering integrated high-technology primary market, 41 MWp already
solutions authorised out of a pipeline of >
300 MWp
< <
O C TO B E R 2020 NOVEMBER 2020
SUSTAINABILITY AT THE HEART OF BUSINESS AND LINE-BY-LINE CONSOLIDATION OF SERVIZI
OPERATIONAL STRATEGY IDRICI INTEGRATI DI TERNI
EBITDA CAGR: ~ 7% CAPEX: €4.7bn in 2020- following changes to articles of association and
2024 over €2bn linked to increase in interest held by Umbriadue (a subsidiary
specific sustainability targets of Acea) from 25% to 40%
612020 KEY ESG HIGHLIGHTS
S U S TA I N A B I L I T Y AT T H E H E A RT O F A C E A ’ S S T R AT E G Y
ACEA’S BUSINESSES ARE BY
DEFINITION
WAT E R ENERGY G E N E R AT I ON E N V I RO NME NT COMMERCIAL
I N F R A S T RU C T U R E & TRADING
WATER LOSSES 2G SMART ELECTRICITY TONNES OF WASTE
METERS PRODUCED TREATMENT CAPACITY
INSTALLED FROM
RENEWABLE
SMART METERS SOURCES*, OF GREEN «G.O.»
OUTAGE RISK MATERIALS RECOVERED ELECTRICITY SOLD ON FREE
INSTALLED (ACEA EQUIVALENT TO
INDICATOR OUT MARKET (+20.3%),
ATO2) TONNES OF OF TOTAL INCOMING EQUAL TO 30% OF TOTAL
CO2 SAVED WASTE ELECTRICITY SOLD ON FREE
MARKET
SOCIAL AND S U S TA I N A B I L I T Y
* WTE and biogas included
G OV E R N A N C E R AT I N G S
A-
OF ACEA BOARD MEMBERS ARE LEADERSHIP
WOMEN
EE-
OF PAPER A YEAR
POSITIVE
SAVED (+92%) THANKS TO E-BILLING
62C OV I D - 1 9 H E A LT H E M E R G E N C Y
E V E RY D AY E S S E N T I A L S E RV I C E S T O O U R C O M M U N I T I E S G U A R A N T E E D
D E L I V E R I N G C O N T I N U I T Y A N D E F F I C I E N C Y E V E N AT T H E H E I G H T O F T H E PA N D E M I C
ESTABLISHMENT OF A COMMITTEE TO MANAGE ADOPTION OF BIOSAFETY TRUST
COVID-19 PREVENTIVE MEASURES CERTIFICATION, AN INNOVATIVE
CERTIFICATION SCHEME AIMED AT PREVENTING
AND CONTROLLING THE SPREAD OF INFECTIONS
REORGANISATION OF WORK WITH EXPANDED USE
OF DIGITAL TOOLS AND THE LARGE-SCALE INTRODUCTION OF SPECIAL
ADOPTION OF REMOTE WORKING ARRANGEMENTS INSURANCE COVER FOR THE GROUP’S
(WITH OVER 85% OF STAFF WORKING FROM HOME) EMPLOYEES AND THEIR FAMILIES
• TWO ROUNDS OF SEROLOGICAL TESTING
(OVER 4,000 CARRIED OUT)
GUARANTEED CONTINUITY AND • FLU VACCINATIONS PROVIDED (OVER 400)
EFFICIENCY OF ALL THE SERVICES • MOLECULAR, RAPID ANTIGEN AND SALIVA-
PROVIDED BASED TESTS (OVER 1,000)
ONGOING DIALOGUE WITH LOCAL OVER 12,000 HOURS OF
COMMUNITIES AND ALL THE GROUP’S TRAINING ON THE COVID
STAKEHOLDERS EMERGENCY PROVIDED TO
EMPLOYEES
63R E S U LT S 2 0 2 0
KEY FINANCIAL HIGHLIGHTS
2020 2019 % CHANGE
EBITDA
(€M)
(A) (B) (A/B) WELL AHEAD OF GUIDANCE
CONSOLIDATED REVENUE 3,379.4 3,186.1 +6.1% INITIAL GUIDANCE: +6%/+8%
EBITDA 1,155.5 1,042.3 +10.9% GUIDANCE IN JULY 2020: ≥ +8%
EBIT 535.0 523.2 +2.3% ORGANIC GROWTH >+10%
GROUP NET PROFIT 284.9 283.7 +0.4%
NET PROFIT NORMALISED
DIVIDEND PER SHARE (€) 0.80 0.78 +2.6%
CAPEX 907.0 792.8 +14.4%
31 Dec 30 Sept 31 Dec % %
NET DEBT
(€M) 2020 2020 2019 CHANGE CHANGE
(A) (B) (C) (A/B) (A/C) IN LINE WITH GUIDANCE DESPITE
IMPACT OF FIRST-TIME
NET DEBT 3,528.0 3,535.4 3,062.8 -0.2% +15.2% CONSOLIDATION OF SII TERNI
64SHAREHOLDER RETURN
0.78 0.80
0.71
0.63
2017 2018 2019 2020
IN THE PERIOD 2020-2024
* Based on consolidated net profit after non-controlling interests * * Based on the average price for 2020
65R E S U LT S 2 0 2 0
EBITDA BY BUSINESS AREA
EB I T DA (€m)
109.4* 20.9 3.3 1,155.5
1%4% 1,042.3
(1.7) (18.7)
6%
53% EBITDA 36%
2020
2019 WATER ENERGY COMMERCIAL & ENVIRONMENT OTHER 2020
INFRASTRUCTURE TRADING BUSINESSES**
AND HOLDCO
EBITDA
(€m) 614.4 412.9 72.4 50.3 5.5
WATER ENERGY
INFRASTRUCTURE 2020 2019 CHANGE
ENVIRONMENT
OTHER + + +
COMMERCIAL BUSINESSES**
& TRADING AND HOLDCO
* Line-by-line consolidation of AdF and SII Terni ** Overseas, Engineering & Services ^Increase in workforce mainly reflects Group’s expansion (SII Terni, ACEA Perù, Environment, Simam)
66R E S U LT S 2 0 2 0
O R G A N I C E B I T DA G ROW T H
WIDER PERIMETER OF THE GROUP
(€m)
102 1,155
1,042 75
971 7 (€m) 2020 2019 Change
(36) (19) (16)
ADF 60.4 18.1 +42.4
SII TERNI 2.2 0.9 +1.3
CONSORCIO AGUA AZUL LIMA 8.9 1.1 +7.8
PESCARA DISTRIBUZIONE GAS 2.2 1.7 +0.5
A LTO S A N G RO D I S T R I B U Z I O N E 1.7 - +1.7
GAS
DEMAP 4.0 1.8 +2.2
BERG 2.0 0.5 +1.4
F E R RO C A RT / C AVA L L A R I 4.3 - +4.3
SIMAM 5.2 - +5.2
2019 WATER CIP6 ANTITRUST 2019 NON- WIDER ORGANIC 2020 P H OTO V O LTA I C 12.1 3.6 +8.5
BONUS FINE NORMALIS RECURRING PERIMETER GROWTH
ED COMPONENTS 2020
(REGULATORY
TOTA L 103.0 27.7 +75.3
ITEMS)
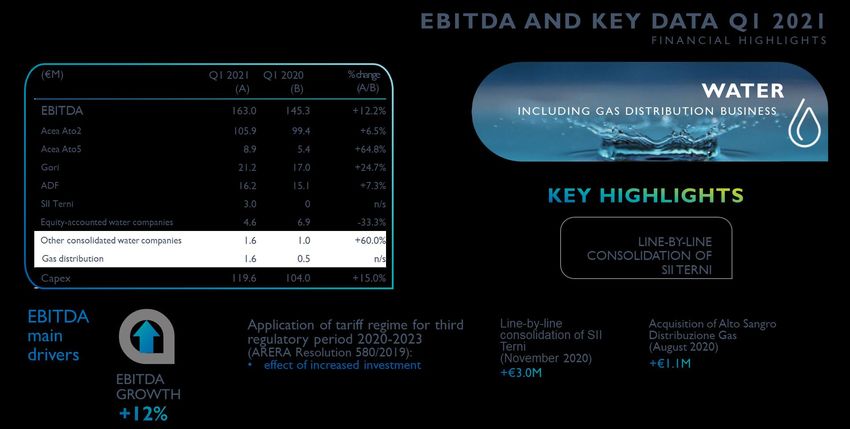
67E B I T DA A N D K E Y I N D I C ATO R S
FINANCIAL HIGHLIGHTS
(€m) 2020 (A) 2019 (B) % change (A/B)
WATER
EBITDA 614.4 505.0 +21.7% INCLUDING GAS DISTRIBUTION BUSINESS
Acea Ato2 410.0 356.1 +15.1%
Acea Ato5 26.7 24.4 +9.4%
Gori 78.7 68.6 +14.7%
ADF 60.4 18.1 N.S.
SII Terni 2.2 0.9 N.S.
Equity-accounted water companies 28.7 37.2 -22.8%
Other consolidated water companies 3.8 (2.0) N.S. LINE-BY-LINE CONSOLIDATION LINE-BY-LINE
Gas distribition 3.9 1.7 N.S. OF ACQUEDOTTO DEL FIORA CONSOLIDATION OF SII
TERNI
Capex 476.0 380.1 +25.2%
EBITDA Application of tariff regime Line-by-line Line-by-line Acquisition of Alto Sangro
main for third regulatory period consolidation of AdF consolidation of SII Terni Distribuzione Gas (August
2020-2023 (October 2019) (November 2020) 2020)
drivers (Arera Resolution 580/2019):
EBITDA • effect of increased investment
GROWTH • no award of bonus for
commercial quality (€35.8m),
offset by recognition of new cost
components (including those
relating to sludge disposal)
68E B I T DA A N D K E Y I N D I C ATO R S
FINANCIAL HIGHLIGHTS
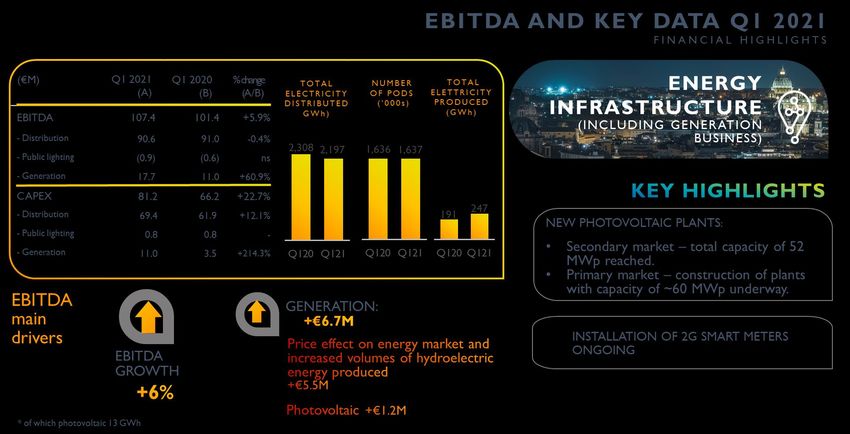
(€m) 2020 2019 % change TOTAL TOTAL
ENERGY
NUMBER
(a) (b) (a/b) ELECTRICITY OF PODS
ELECTRICITY
PRODUCED
DISTRIBUTED (‘000S)
(GWh) (GWh)
EBITDA 412.9
39
2.0
+5.3% INFRASTRUCTURE
( I N C LU D I NG G E NE R AT I ON
- Distribution 369.6 345.4 +7.0% 9,849
9,096 1,641 1,644 B U S INE S S)
- Public lighting (2,0) 1.9 N.S. 650 626*
- Generation 45.4 44.6 +1.8%
CAPEX 325.1 287.8 +13.0%
- Distribution 282.5 265.7 +6.3%
ACQUISITION OF NEW INSTALLATION OF
- Public lighting 3.6 3.3 +9.1% PHOTOVOLTAIC PLANTS: 2G SMART METERS
- Generation 39.0 18.8 +107.4% 2019 2020 2019 2020 2019 2020 total installed capacity of (~60,000 installed)
52 MWp
PUBLIC
DISTRIBUTION: LIGHTING: GENERATION:
EBITDA
main
drivers EBITDA
GROWTH
* Of which photovoltaic: 61 GWh
69E B I T DA A N D K E Y I N D I C ATO R S
FINANCIAL HIGHLIGHTS
(€m) 2020 (A) 2019 (B) % change (A/B)
EBITDA 72.4 69.1 +4.8%
Capex 44.1 43.1 +2.3%
COMMERCIAL
TOTAL ENERGY NUMBER OF TOTAL GAS NUMBER OF GAS &TRADING
SOLD (GWH) ELECTRICITY SOLD (Mmc 3 ) CUSTOMERS
CUSTOMERS (‘000s)
(‘000s)
192 212
140 165
INCREASED FREE MARKET CUSTOMER
2020
+
BASE WITH GREATER MARGIN
2019 2020 2019
FREE MKT EN. PROT. MKT
INCREASED FREE MARKET REDUCED MARGIN IN PRICE EFFECT
EBITDA MARGIN: greater number of ENHANCED PROTECTION on energy purchased
main mass market customers and MARKET:
and not sold to
drivers increased volumes of electricity lower number of customers and
EBITDA sold customers
revised mechanism for compensating
GROWTH for delinquent accounts (ARERA
Resolution 100/2020)
70E B I T DA A N D K E Y I N D I C ATO R S
FINANCIAL HIGHLIGHTS
(€m) 2020 (A) 2019 (B) % change (A/B)
EBITDA 50.3 52.0 -3.3% ENVIRONMENT
of which: Demap 4.0 1.8 N/S
Berg 2.0 0.5 N/S
Ferrocart/Cavallari 4.3 - N/S
Capex 23.6 51.9 -54.5%
TREATMENT AND DISPOSAL ELECTRICITY SOLD (GWh)
(KTONNES)
1,607
1,264
327 320
ACQUISITION OF 60% OF
FERROC ART/C AVALLARI
2019 2020 2019 2020
EBITDA HIGHER TREATED VOLUMES M&A: END OF CIP6 FEED- REDUCTION IN
(+27%) AND INCREASE IN IN TARIFFS FROM PRICES OF
main DISPOSAL TARIFFS: 1 AUGUST 2019 ENERGY SOLD
drivers Acquisition of Demap (July 2019):
+€2.2m
Acquisition of Berg (October 2019):
+€1.4m
Acquisition of Ferrocart/Cavallari (April 2020):
+€4.3m 71EBIT AND NET PROFIT
523.2 535.0 284 49 285
221 15
(25) (9) (13) (16)
2019 Water Release of CIP6 Antitrust fine 2019 Non-recurring Organic 2020
bonus Gala provisions normalised components 2020 growth
(mainly due to
2019 2020 revaluation following
consolidation of AdF)
(€m) 2020 2019 % CHANGE Increased investment across all areas of
business and first-time consolidations
DEPRECIATION 498.3 409.6 +21.7% (primarily AdF +€20.8m)
Release of provisions of €13.5m for Gala in
IMPAIRMENTS 79.4 61.7 +28.7%
2019
PROVISIONS 42.8 47.8 -10.5%
(28.6% in 2019)
72CAPEX
F U RT H E R A C C E L E R AT I O N I N I N V E S T M E N T S F O C U S I N G O N R E G U L AT E D A C T I V I T I E S
96 37 1 8 907
793
(28) 84% 16%
2019 WATER ENERGY COMMERCIAL & ENVIRONMENT OTHER 2020
INFRASTRUCTURE TRADING BUSINESSES*
AND HOLDCO
CAPEX 476 325 44 24 38 Investments in regulated businesses
(€m) Investments in non-regulated businesses
ENERGY COMMERCIAL
WATER ENVIRONMENT OTHER
INFRASTRUCTURE & TRADING
• MAINTENANCE AND EXPANSION • GRID UPGRADE AND • CUSTOMER ACQUISITION • SAN VITTORE PLANT • OVERSEAS: REDUCED
OF WATER AND SEWAGE EXPANSION • INFORMATION SYSTEMS • WORK ON ORVIETO INVESTMENT AT AGUAS DE SAN
NETWORK • ’’RESILIENCE’’ PLAN WITH LANDFILL PEDRO
• EXTRAORDINARY MAINTENANCE WORK ON SECONDARY • ENGINEERING AND SERVICES:
OF PLANTS AND NETWORKS SUBSTATIONS AND MV AND CONSOLIDAION OF SIMAM
• OPTIMIZATION OF TREATMENT LV NETWORK (€2.4m)
PLANTS • INSTALLATION OF 2G SMART • HOLDCO: IT PROJECTS
• CONSOLIDATION OF ADF (€26.2m) METERS
* Overseas and Engineering & Services
73R E S U LT S 2 0 2 0
F O C U S O N I M P RO V E M E N T S I N W O R K I N G C A P I TA L
(€m) 2020 2019
EBITDA 1,155 1,042 INCREASE €73M
CHANGE IN WORKING CAPITAL (38) (16)
CAPEX (886)* (793)
REGULATORY FACTORS: €63m
FREE CASH FLOW 231 233
FINANCE INCOME/(COSTS) (88) (90) IMPACT OF COVID-19 ON COLLECTIONS: €10m
CHANGE IN PROVISIONS (112) (107)
INCOME TAX PAID (123) (134) REDUCTION ~€50M
DIVIDENDS (166) (151)
OTHER (47) (12) INCREASED CAPITAL EXPENDITURE IN Q4 2020 (CASH EFFECT IN
M&A AND FIRST-TIME CONSOLIDATIONS (154) (171) 2021)
IFRS 16 (7) (64) INCREASED FACTORING OF RECEIVABLES (INSTALMENT PLANS)
TOTAL CASH FLOW (465) (495)
INCREASED REVERSE FACTORING
EBITDA 2020 CHANGE CAPEX FINANCE CHANGE IN INCOME DIVIDENDS OTHER M&A IFRS 16 TOTAL
IN WC COSTS PROVISIONS TAX PAID CASH FLOW
1,155
(38)
(886)* (88) (112) (123) (166) (47) (154) (7) (465)
* Net of financed capex and other non-cash items
74R E S U LT S 2 0 2 0
NET DEBT BETTER THAN GUIDANCE
31 Dec 2020 30 Sept 2020 31 Dec 2019 Change Change
(€m) (a) (b) (c) (a-b) (a-c)
799
688
Net debt 3,528.0 3,535.4 3,062.8 (7.4) 465.2
600
575 557
Medium/long-term 4,130.2 4,116.9 3,523.3 13.3 606.9
Short-term (602.2) (581.5) (460.5) (20.7) (141.7) 389
256
197
NET DEBT/EBITDA NET DEBT/EBITDA
31 Dec 2020 31 Dec 2019
109
30
NET DEBT/RAB NET DEBT/RAB*
31 Dec 2020 31 Dec 2019
2021 2022 2023 2024 2025 2026 2027 2028 2029 2030
* Estimated value
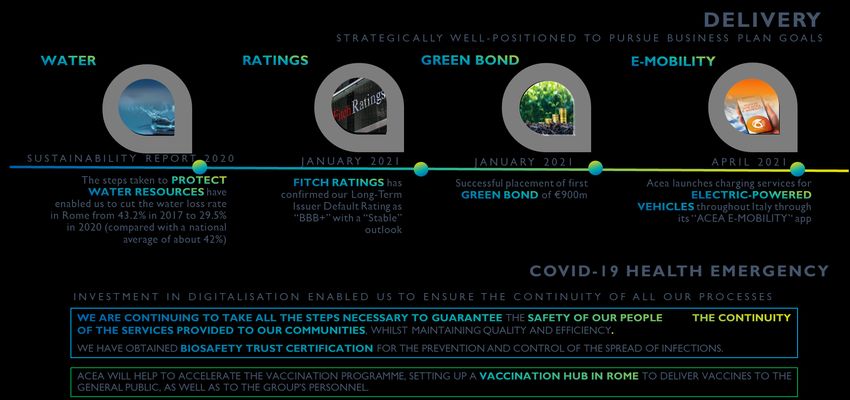
75R E S U LT S 2 0 2 0
FINANCIAL PERFORMANCE AHEAD OF GUIDANCE
21 JANUARY 2021
29 JANUARY 2020
Placement of first GREEN BOND of €900m successfully completed.
+ worth €500m under EMTN
Placement of bonds +
Issue under Green Financing Framework and EMTN programme in two
programme. Bonds have a 9-year term and pay a tranches:
fixed rate of 0.50% €300m tranche, 0% coupon, maturing 28 September 2025
(first ever Italian corporate bond issued with a negative yield);
€600m tranche, 0.25% coupon, maturing 28 July 2030
DEBT FALLING DUE FLOATING RATE
AFTER 2021
(MATURITY AND INTEREST RATES AT 31 DEC 2020) FIXED RATE
DEBT FALLING DUE
BY 2021
BBB+
3% 19% Stable outlook
< < <
Baa2
Stable outlook
FIXED AVERAGE AVERAGE 81%
RATE COST TERM 97%
76Regulatory framework
TITOLO
- Water CAPITOLO
- Electricity distribution
- Environment
TITOLO PRESENTAZIONE / Luogo e data
MIL 201027_Piano Acea_Documento pe
...Regulation
Water (1/2)
TARIFF REGIME FOR THE THIRD REGULATORY PERIOD (2020-2023)
Delibera ARERA 580/2019
WACC: 5.24% (previously 5.3%)
WACC on fixed assets in progress: 3.92% (provision amended by ARERA in Resolution 235/2020/R/idr of
23 June 2020)
Increase in inflation rate (from 1.5% to 1.7%)
The limits on annual growth of the tariff multiplier linked to classification in the matrix of regulatory
frameworks have been reduced
Reduction in standard coverage for late payments in Central Italy from 3.8% to 3%
EXPIRY OF CONCESSIONS
ATO2 Lazio Centrale (Acea ATO2) 2032
ATO5 Frosinone (Acea ATO5) 2033
ATO3 Regione Campania (Gori) 2032
ATO4 Alto Valdarno (Nuove Acque) 2027
ATO2 Basso Valdarno (Acque) 2031*
ATO3 Medio Valdarno (Publiacqua) 2024**
ATO6 Ombrone (Acquedotto del Fiora) 2031*
Municipality of Lucca (Geal) 2025
ATO1 Perugia (Umbra Acque) 2027
ATI4 Umbria (Umbriadue Servizi Idrici) 2032
* Extension of the concession approved by the concession authority at the time of the biennial review 2018-2019 (also approved by ARERA).
** Extension of the concession approved by the concession authority at the time of the biennial review 2018-2019, yet to be approved by ARERA. 78
MIL 201027_Piano Acea_Documento pe
...Regulation
Water (2/2)
ARERA RESOLUTION 235/2020
«Adoption of urgent measures for the integrated water service, in response to the Covid-19 emergency»
Deferral of deadlines for meeting tariff and technical quality requirements.
Recognition in allowed costs of 0.6% of turnover to cover late payments caused by restrictions linked to the spread of
Covid-19
Assessment of quality performance based on cumulative data for the two-year period 2020-2021
Amendment of cost recognition criteria (on a forecast basis, with any gaps to be made up through back-billing) linked to
the Covid-19 emergency
Selective measures for financial sustainability of concessions during the emergency (advance payments to be applied for
to CSEA – Cassa Servizi Energetici e Ambientali only for concessions where tariffs are approved by 30 September 2020)
Increase in returns on WIP (Work In Progress): 3.73% in the first two years of the regulatory cycle and 2.77% in the
subsequent years (previously 3.58%, 3.31%, 3.04% and 2.77%)
79
MIL 201027_Piano Acea_Documento pe
...Regulation
Electricity distribution (1/2)
ARERA RESOLUTION:
- 568/2019 tariffs for electricity distribution (TIT) and metering (TIME) revised for the sub-period 2020-2023
- 646/2015 "Quality of electricity distribution and metering services and output-based regulation" (TIQE) amended and supplemented by
RESOLUTION 566/2019/R/eel for the sub-period 2020-2023
- 534/2019 Initiatives designed to boost the resilience of electricity distribution networks, Areti plan for 2019-2021.
- 467/2019 experimental regulation for the upgrade of aging plumbing risers in buildings
- 306/2019 Revision for the three-year period 2020-2022 of the recognition of 2G smart metering costs
- 583/2015 TIWACC supplemented by resolutions 639/2018/R/com and 570/2019/R/gas
REGULATORY PERIOD: EIGHT YEARS 2016-2023 divided into two sub-periods, each lasting four years:
2016-2019
2020-2023
REGULATORY PERIOD WACC: SIX YEARS 2016-2021 Areti’s concession expires in 2030
WACC for 2016-2018 5.6%
WACC for 2019-2021 5.9%
WACC FOR OTHER ACTIVITIES
ELECTRICITY TRANSMISSION
ARERA RESOLUTION 380/2020: “Launch of the process of adopting provisions Electricity transmission WACC for 2019-2021 : 5.6%
regarding the methods and criteria for determining and revising the rate of return on
GAS NETWORKS
invested capital in the electricity and gas sectors for the second regulatory period”.
Gas transport WACC for 2019: 5.7% WACC for 2020-2021: 5.7%
Gas distrib WACC for 2019: 6.3%
Gas metering WACC for 2019: 6.8%
} WACC for 2020-2021: 6.3%
Gas storage WACC for 2019: 6.7% WACC for 2020-2021: 6.7%
80
MIL 201027_Piano Acea_Documento pe
...Regulation
Electricity distribution (2/2)
MAIN REGULATORY CHANGES IN 2020
Urgent measures linked to the COVID-19 epidemic
The regulator urgently issued a serious of resolutions designed to mitigate, as far as possible, the difficulties faced by final consumers and certain businesses connected with
the rules governing the response to non-payment by customers, with specific regard to the process for cutting off the supply of electricity.
ARERA Resolution 60/2020/R/com – Managing non-payments
In this Resolution, the regulator suspended application of the procedure for managing non-payments set out in supply contracts with final customers until 17 May of the current year.
Resolution ARERA 116/2020/R/com – Billing for transmission services
In Resolution 116/2020/R/com, ARERA suspended the application of default procedures in the event of non-payment by traders of transmission service charges due for payment in April 2020. This reflects
potential for non-payment by customers who have benefitted from the above Resolution 60/2020/R/com.
More specifically, the regulator has suspended the above procedures where the transmission service user has paid at least 70% of the total amount billed for LV withdrawal points. At the same time, given the
fact that the measures introduced could make it difficult for distributors to pay general system charges to the CSEA and GSE, the regulator has given distributors the option of making a payment in proportion to
the amount effectively collected. This payment must, in any event, be within the minimum amount (80%) needed to ensure the system is fully funded.
Resolution ARERA 248/2020/R/com – Procedures for recovering unpaid amounts
The measures introduced by Resolution 116/2020/R/com were extended on a number of occasions by the regulator, up to and including bills falling due in June 2020. As a result, the later Resolution
248/2020/R/com det out the procedures for recovering unpaid amounts payable to distributors by transmission users and general system charges not paid by the former to the CSEA and GSE.
Resolution ARERA 213/2020/R/eel – Temporary changes to the 2G directives
Within the above context, Resolution 213/2020/R/eel introduced, for 2020, a series of changes to the regulations governing the rollout of 2G smart metering systems with the aim of avoiding penalties to be
paid by distribution companies as a result of factors beyond their control linked to the epidemic.
The main changes introduced regard the preparation of detailed plans for the mass phase of the rollout, the suspension of penalties for falling behind the schedule set out in the plan and a halt to application
of the “Information Quality Incentive” matrix.
The regulator has reserved the right to extend, in full or in part, the measures adopted in this Resolution into 2021 depending on how the health emergency evolves.
81
MIL 201027_Piano Acea_Documento pe
...Regulation
Environment
ARERA RESOLUTION 443/2019
Regulatory period 2018-2021, structured in line with the previous tariff regulation (Presidential Decree 158/99), with the
introduction of certain elements such as sharing arrangements for revenue from the sale of material and energy derived
from waste and the related CONAI revenue.
Real pre-tax WACC: 6.3% for the period 2020-2021, with an additional 1% for the 2-year time lag between capex being
carried out and its recognition in RAB.
Determination of four different regulatory frameworks, limiting the annual rise in the tariff to reflect the quality of service
provided and changes in the scope of operations.
Cost recognition on the basis of accurate ex post data based on reliable accounting records for the previous two years and
no longer on forecasts.
Identification of efficient costs and subsequent adjustments for 2018 and 2019 (introduced on a progressive basis and
recognisable over no more than 4 years).
Whilst awaiting determination of the tariffs for incoming waste (to be determined by 31 December 2020), the charges
covering the costs of disposal and treatment and of treatment and recovery are determined on the basis of approved
and/or negotiated tariffs.
82
MIL 201027_Piano Acea_Documento pe
...Disclaimer
THIS PRESENTATION CONTAINS CERTAIN FORWARD-LOOKING STATEMENTS THAT REFLECT THE COMPANY’S
MANAGEMENT’S CURRENT VIEWS WITH RESPECT TO FUTURE EVENTS AND FINANCIAL AND OPERATIONAL
PERFORMANCE OF THE COMPANY AND ITS SUBSIDIARIES.
THESE FORWARD-LOOKING STATEMENTS ARE BASED ON ACEA S.P.A.’S CURRENT EXPECTATIONS AND PROJECTIONS
ABOUT FUTURE EVENTS. BECAUSE THESE FORWARD-LOOKING STATEMENTS ARE SUBJECT TO RISKS AND
UNCERTAINTIES, ACTUAL FUTURE RESULTS OR PERFORMANCE MAY MATERIALLY DIFFER FROM THOSE EXPRESSED
THEREIN OR IMPLIED THEREBY DUE TO ANY NUMBER OF DIFFERENT FACTORS, MANY OF WHICH ARE BEYOND THE
ABILITY OF ACEA S.P.A. TO CONTROL OR ESTIMATE PRECISELY, INCLUDING CHANGES IN THE REGULATORY
FRAMEWORK, FUTURE MARKET DEVELOPMENTS, FLUCTUATIONS IN THE PRICE AND AVAILABILITY OF FUEL AND OTHER
RISKS.
YOU ARE CAUTIONED NOT TO PLACE UNDUE RELIANCE ON THE FORWARD-LOOKING STATEMENTS CONTAINED HEREIN,
WHICH ARE MADE ONLY AS OF THE DATE OF THIS PRESENTATION. ACEA S.P.A. DOES NOT UNDERTAKE ANY OBLIGATION
TO PUBLICLY RELEASE ANY UPDATES OR REVISIONS TO ANY FORWARD-LOOKING STATEMENTS TO REFLECT EVENTS OR
CIRCUMSTANCES AFTER THE DATE OF THIS PRESENTATION.
THIS PRESENTATION DOES NOT CONSTITUTE A RECOMMENDATION REGARDING THE SECURITIES OF THE COMPANY.
THIS PRESENTATION DOES NOT CONTAIN AN OFFER TO SELL OR A SOLICITATION OF ANY OFFER TO BUY ANY
SECURITIES ISSUED BY ACEA S.P.A. OR ANY OF ITS SUBSIDIARIES.
***
PURSUANT TO ART. 154-BIS, PAR. 2, OF THE LEGISLATIVE DECREE N. 58 OF FEBRUARY 24, 1998, THE EXECUTIVE IN
CHARGE OF PREPARING THE CORPORATE ACCOUNTING DOCUMENTS AT ACEA, FABIO PARIS – CFO OF THE COMPANY -
DECLARES THAT THE ACCOUNTING INFORMATION CONTAINED HEREIN CORRESPOND TO DOCUMENT RESULTS, BOOKS
AND ACCOUNTING RECORDS.
83
MIL 201027_Piano Acea_Documento pe
...You can also read