Exergy analysis and performance study for sour water stripper units, amine regenerator units and a Sulphur recovery unit of a refining plant
←
→
Page content transcription
If your browser does not render page correctly, please read the page content below
Ibrahim et al. Journal of Engineering and Applied Science             (2021) 68:6
https://doi.org/10.1186/s44147-021-00006-y
                                                                                                                              Journal of Engineering
                                                                                                                              and Applied Science

 RESEARCH                                                                                                                                        Open Access

Exergy analysis and performance study
for sour water stripper units, amine
regenerator units and a Sulphur recovery
unit of a refining plant
Ahmed Y. Ibrahim1*, Fatma H. Ashour1 and Mamdouh A. Gadalla2,3

* Correspondence: yehiawe@
hotmail.com                              Abstract
1
 Department of Chemical
Engineering, Cairo University, Giza      A refining column in the middle east that started its official production in 2020 provides its
12613, Egypt                             sour wastewater from all refinery plants to two sour water units (SWS1 and SWS2) to strip
Full list of author information is       H2S and NH3. Sour gas from the refinery uses a lean amine solution for gas sweetening to
available at the end of the article
                                         absorb H2S in different absorbers. Rich amine with H2S is then stripped in two amine
                                         regeneration units (ARU1 and ARU2). The overhead of SWS and ARU units provide the acid
                                         gas feed to the sulphur recovery unit (SRU) to produce sulphur and prevent any acidic
                                         emissions against environmental regulations. First, the SWS1 unit is simulated using Aspen
                                         HYSYS V.11. A complete exergy study is conducted in the unit. Exergy destruction, exergy
                                         efficiency and percentage share in the destruction are calculated for all equipment. The
                                         highest exergy destruction rate was in the stripper with 5028.58 kW and a percentage share
                                         of 81.94% of the total destruction. A comparison was conducted between the exergy
                                         results of this study with two other exergy studies performed in the same refinery plant.
                                         The columns in the three studies showed the highest destruction rates exceeding 78% of
                                         the total destruction of each unit. The air coolers showed the second-highest destruction
                                         rates in their units with a percentage share exceeding 7% of the total destruction. The
                                         pumps showed the lowest destruction rates with values of less than 1% of the total
                                         destruction of each unit. Then, an individual simulation is conducted for stripper1 of SWS1,
                                         stripper2 for SWS2, regenerator1 of ARU1 and regenerator2 of ARU2. The individual
                                         simulations are combined in one simulation named combined simulation to compute the
                                         composition of acid gas from SWS and ARU units feeding SRU. Then, the SRU unit is
                                         simulated via a special package in HYSYS V.11 named SULSIM. The computed composition
                                         from SWS and ARU is exported to excel where it is linked with SRU simulation to calculate
                                         sulphur production. For the first time in any article in the world, all data feeding SWS, ARU,
                                         and SRU units are connected to a live system named Process Historian Database (PHD) to
                                         gather live data from the plant and perform plant optimization.
                                         Keywords: Amine regeneration unit, Exergy destruction, Exergy efficiency, Hysys, Sour
                                         water stripping, Sulphur recovery unit

                                      © The Author(s). 2021 Open Access This article is licensed under a Creative Commons Attribution 4.0 International License, which
                                      permits use, sharing, adaptation, distribution and reproduction in any medium or format, as long as you give appropriate credit to the
                                      original author(s) and the source, provide a link to the Creative Commons licence, and indicate if changes were made. The images or
                                      other third party material in this article are included in the article's Creative Commons licence, unless indicated otherwise in a credit
                                      line to the material. If material is not included in the article's Creative Commons licence and your intended use is not permitted by
                                      statutory regulation or exceeds the permitted use, you will need to obtain permission directly from the copyright holder. To view a
                                      copy of this licence, visit http://creativecommons.org/licenses/by/4.0/. The Creative Commons Public Domain Dedication waiver
                                      (http://creativecommons.org/publicdomain/zero/1.0/) applies to the data made available in this article, unless otherwise stated in a
                                      credit line to the data.
Ibrahim et al. Journal of Engineering and Applied Science   (2021) 68:6                                       Page 2 of 19

                  Introduction
                  Hydrogen sulphide is a hazardous toxic, corrosive pollutant produced from refinery in-
                  dustry. It produces acid rain causing severe damages to equipment and also for human
                  health [1, 2]. Hydrogen sulphide is used as feed to sulphur recovery plants (SRU) to
                  produce elemental sulphur [3, 4]. The main purpose of SRU plants is to prevent H2S
                  emissions against environmental regulations in the world [5–8]. The modified Claus
                  process is the most used one to produce sulphur [9, 10].
                    Processed sour water produced from refinery plants contains some hazardous con-
                  taminants. H2S and ammonia are considered as the main pollutants in sour water [11–
                  13]. Strippers are designed to remove H2S and NH3 from sour water [14–16].
                    The sweetening of sour gas that contains acid gas like H2S is performed in amine
                  treating units. The gas is contacted with a lean amine solution that absorbs H2S, then
                  the H2S is stripped from the rich amine in a regenerator [17, 18]. The diethanolamine
                  (DEA) and methyl diethanolamine (MDEA) amines are widely used to do this role [2,
                  19–21]. When acidic gas contains CO2 and H2S, MDEA is used for its high selectivity
                  to H2S rather than CO2 [22–24].
                    The world’s fastest expanding population leads to a dramatic increase in energy con-
                  sumption [25, 26]. Optimum energy consumption is substantial for community devel-
                  opment. Presently, from an energy point of view, optimum energy consumption is an
                  essential indicator of the community development level. Therefore, energy optimization
                  and preventing its losses in various industries are very important. Higher energy con-
                  sumption in chemical processes increases both operation and production cost and also
                  decreases system efficiency [27].
                    While energy is conserved in any chemical processes, exergy is destroyed irreversibly.
                  Exergy is the work or power that we can use from an energy amount with respect to
                  the natural environment. The total exergy components are potential, kinetic, chemical
                  and physical exergy. Actually, potential and kinetic exergy is neglected due to their
                  lower values if compared with physical and chemical exergy [10]. The chemical exergy
                  is defined as the maximum amount of work obtained when the substance is got from
                  an environmental state to a dead state. The process exchange of substances and heat
                  transfer is only with the environment. The physical exergy definition is also considered
                  as the maximum amount of work, but when the stream the substance is got from its
                  initial state to the state of environment by physical processes. Physical exergy involves
                  only a thermal interaction with the environment [28].
                    Rostami et al, Hashemi et al. and Zarei performed exergy studies on SRU plants con-
                  sidering the overall exergy of the SRU, the difference between individual sections and
                  exergy study on individual equipment [10, 27, 29].
                    The literature study showed no remarkable study of energy and exergy analysis of
                  amine scrubber units. Mohamadi-Baghmolaei et al. did an exergy study on different
                  compositions of a mixture of DEA and MDEA [19]. Ibrahim et al. performed an exergy
                  study for ARU No1 and ARU No2. As a result of system losses during start-up, the
                  DEA concentration dropped from 25 to 20%. Exergy studies were carried out on both
                  concentrations to determine the changes that occurred in the various exergy calcula-
                  tions [30, 31]. Also, they conducted an exergy study for an MDEA scrubber unit of an
                  SRU plant. As a result of system losses during start-up, the DEA concentration dropped
Ibrahim et al. Journal of Engineering and Applied Science   (2021) 68:6                                              Page 3 of 19

                  from 45 to 22%. Exergy studies were carried out on both concentrations to determine
                  the changes that occurred in the various exergy calculations [32].
                     The current SWS No.1 study results were compared with ARU No.1 results and
                  MDEA scrubber unit results to conclude the relationships between similar equipment.
                  The literature survey showed that no remarkable studies were performed on the exergy
                  of SWS units or ARU units, and also, no studies were done before considering the in-
                  teractions between SWS, ARU and SRU units. Ibrahim et al. carried out an energy
                  optimization analysis on the same refinery plant to conserve steam from the SWS1,
                  SWS2, ARU1 and ARU2 units. The research saved $1,537,206.38/year [33].
                     An SRU unit of a refinery plant that started its official production in 2020 receives an acid
                  gas feed from four units, sour water stripping unit1 (SWS1), sour water stripping unit2
                  (SWS2), amine regenerated unit1 (ARU1) and amine regenerated unit2 (ARU2). The sour
                  water stripping units will process the sour water coming from all refining plants.
                     The function of the SWS is to remove hydrogen sulphide and ammonia from the
                  sour water streams. The amine regeneration units are capable to strip hydrogen
                  sulphide (H2S) from “rich” amine solution to provide “lean” amine solution. LA is used
                  to treat sour gas of all refinery plants in different absorbers. RA saturated by absorbed
                  H2S from different units is then treated in ARU units to provide LA. The sulphur re-
                  covery unit (SRU) is designed to recover sulphur from amine acid gas and sour water
                  stripper acid gas. Sulphur product purity shall be 99.9% on a dry basis and produced as
                  solid sulphur.
                     A complicated simulation is performed by the HYSYS software V.11. The simulation
                  is validated with plant data to check its ability for study accuracy. The SWS1 was com-
                  pletely simulated, and a complete exergy study is done on the process equipment to see
                  the exergy of streams, the exergy destruction in equipment, the percentage share of de-
                  struction and the overall destruction efficiency. These current exergy research from
                  around the world will help to reduce exergy losses in process systems and will be an ef-
                  fective strategy for energy optimization.
                     Another combined simulation is performed for stripper1 of SWS1 unit, stripper2 of
                  SWS2 unit, regenerator1 of ARU1 and regenerator2 of ARU2. The overhead acid gas of
                  the 4 towers represents the feed to the SRU plant. The combined simulation computes
                  the composition inlet to SRU from SWS and ARU units. An AAG analyser exists in the
                  SRU plant, but it seems to give a wrong composition. While the estimated composition
                  is around 90% AAG, it gives 60% mole fraction reading. No analyser exists to measure
                  the SWSAG composition. The simulation was mandatory to compute the actual
                  sulphur production.
                     The calculated composition is exported to Excel. The SRU plant was also simulated with
                  HYSYS V.11 by a special sulphur package named SULSIM. The calculated composition in
                  Excel is exported to the SRU simulation to compute sulphur production and to test other pa-
                  rameters. Feed rates to the combined simulation and the SRU plant receive live data from a
                  system named Process Historian Database (PHD) that gathered all plant data instantly. Litera-
                  ture survey did not find any research about connecting a PHD live system with Excel, HYSYS
                  and other different simulations because this type of simulation is complicated and require a
                  live system in the companies that can connect the live plant data to Excel and then data are
                  transferred from Excel to HYSYS. This system does not exist in all companies. The integration
                  of simulations with PHD systems is a powerful tool for plant optimization.
Ibrahim et al. Journal of Engineering and Applied Science     (2021) 68:6                                             Page 4 of 19

                  Methods
                  Simulation step
                  The software used in the simulation is HYSYS V.11. The simulation is a complicated
                  one composed of a series of simulations connected together. The feed characteristics of
                  strippers1 and stripper2 are presented in Table 1. The main components of sour water
                  to stripper1 and stripper2 are water, ammonia and hydrogen sulphide.
                    The feed characteristics of regenerator1 and regenerator2 are presented in Table 2.
                  The main components of the RA solution feed to regenerator1 and regenerator2 are
                  diethanolamine, water and hydrogen sulphide. No ammonia exists in the RA feed.

                  Simulation sections
                  Simulation and process description of SWS1
                  This simulation is the simulation of the SWS1 whole plant. The output from the simu-
                  lation is presented in Fig. 1 and can be considered as a PFD for SWS1 plant. The
                  SWS1 and SWS2 units are designed to treat process water contaminated with hydrogen
                  sulphide (H2S) and ammonia (NH3). The sour water is generated from all the refinery
                  process units. Sour water is heated in E-1, and then H2S and NH3 are stripped from
                  the water in the stripper. The stripped water is cooled in E-1, then in an air cooler and
                  divided into two streams: wash water stream used in refining units and wastewater
                  stream. A detailed exergy study is conducted on this one.

                  Simulation criteria of SWS1
                  The package selected for the plant is Peng Robinson, a wrong selection for the package
                  deviates totally the results. The stripper is selected as a distillation tower with some
                  modifications in the column environment, a pump around is selected to cool the over-
                  head of the tower instead of the condenser to meet the design of the tower. Exchanger
                  1 and exchanger 2 are selected as normal heat exchangers, and the air cooler is selected
                  from HYSYS to simulate the air cooler.

                  Simulation and process description of combined towers
                  This simulation actually is composed of five simulations; the first four simulations for 4
                  different towers are built up separately, stipper1 for SWS1, stripper2 for SWS2, regen-
                  erator1 for ARU1 and regenerator2 for ARU2. The fifth simulation combines the four
                  towers together.

                  Table 1 Sour water feed characteristics to stripper1 and stripper2
                  Stream number                       108                              208
                  Stream name                         Sour water feed to stripper 1    Sour water feed to stripper2
                  Temperature (°C)                    87                               87
                  Pressure (kg/cm2g)                  6.3                              6.3
                  Mass (kg/h)                         126,066.3                        39,000
                  Components weight fraction
                     H2O                              0.981                            0.991
                     NH3                              0.006                            0.003
                     H2S                              0.013                            0.006
Ibrahim et al. Journal of Engineering and Applied Science    (2021) 68:6                                              Page 5 of 19

                  Table 2 Sour water feed characteristics to regenerator1 and regenerator2
                  Stream name                   Rich amine feed to regenerator1     Rich amine feed to regenerator2
                  Stream number                 140                                 214
                  Temperature (°C)              103                                 103
                  Pressure (kg/cm2g)            5.3                                 2
                  Mass flow (kg/h)              496,025.8                           73,176.4
                  Components weight fraction
                     DEA                        0.245                               0.243
                     Water                      0.734                               0.728
                     H2S                        0.020                               0.028

                     Sour water stripper is designed to produce stripped water with a normal sour water
                  flow rate. Also, it minimizes H2O contents in sour gas from stripper overhead with a
                  condenser system. The stripped water contains 3 wt. ppm H2S and 30 wt. ppm NH3. It
                  has a pump around the system as a column condenser. The advantage of a pump-
                  around system is to reduce overhead plugging and corrosion potential. The simulation
                  of stipper1 represents its PFD and extracted from the column environment of the
                  tower. Stripper1 simulation is shown in Fig. 2. The column environment of the strip-
                  pers gives a clear view of the strippers’ equipment. The pump around the cooler does
                  not appear in the main environment.
                     Stripper1 and stripper2 reboilers supply heat to the strippers to strip the hydrogen
                  sulphide and ammonia from the sour water. The simulation of stipper2 is also extracted
                  from the column environment and shown in Fig. 3. The pump around the coolers is
                  the source of cooling at the top of the stripping towers.
                     Regenerator1 simulation is shown in Fig. 4. The hydrogen sulphide (H2S) is stripped
                  off from the rich amine solution as it flows downward through the regenerator. Regen-
                  erator1 and regenerator2 reboilers supply the heat to the regenerators to strip H2S off
                  from the rich amine solution. The condenser is the source of cooling of overhead acid
                  gas to SRU.
                     Regenerator2 is also simulated as regenerator1 and shown in Fig. 5. The design of re-
                  generator2 is also similar to regenerator1 for the reboiler and condenser.
                     All distillation towers in general need some information in the simulation to solve as
                  the number of trays, the feed tray location, the top temperature and the bottom

                    Fig. 1 Sour water stripper1 plant
Ibrahim et al. Journal of Engineering and Applied Science   (2021) 68:6                                       Page 6 of 19

                    Fig. 2 Stripper1

                  temperature. The columns also use some specifications: we select the following exam-
                  ples: the reflux rate, the top and the bottom product rates and the top or bottom com-
                  ponent fractions. A pump around is added for stripper1 and stripper2, and some
                  modifications are made in the column environment. Regenerator1 and regenerator2 are
                  simulated as normal distillation towers.
                    Finally, the fifth simulation of the combined towers is shown in Fig. 6. This simula-
                  tion is composed of four templates for the four towers in the addition to the main
                  simulation. The combined tower simulation contains four templates for the four
                  towers; the overheads from stripper1 and stripper2 (streams 111 and 211) are com-
                  bined together as acid gas feed to SRU from the SWS units. The overheads from regen-
                  erator1 and regenerator2 are combined together (streams 153 and 223) as AAG feed to
                  SRU. AAG drum and SWSAG drums are used to remove any condensates from the gas
                  feed to SRU.

                  Simulation and process description of Sulphur recovery unit
                  The SRU simulation is done by HYSYS V.11 with the Sulphur Sulsim package prepared
                  especially for sulphur units and shown in Fig. 7. The sulphur recovery facilities consist
                  of Claus section, sulphur degassing, TGT section and incineration section. The Claus
                  section consists of the thermal Claus section and the catalyst Claus section. The Claus

                    Fig. 3 Stripper2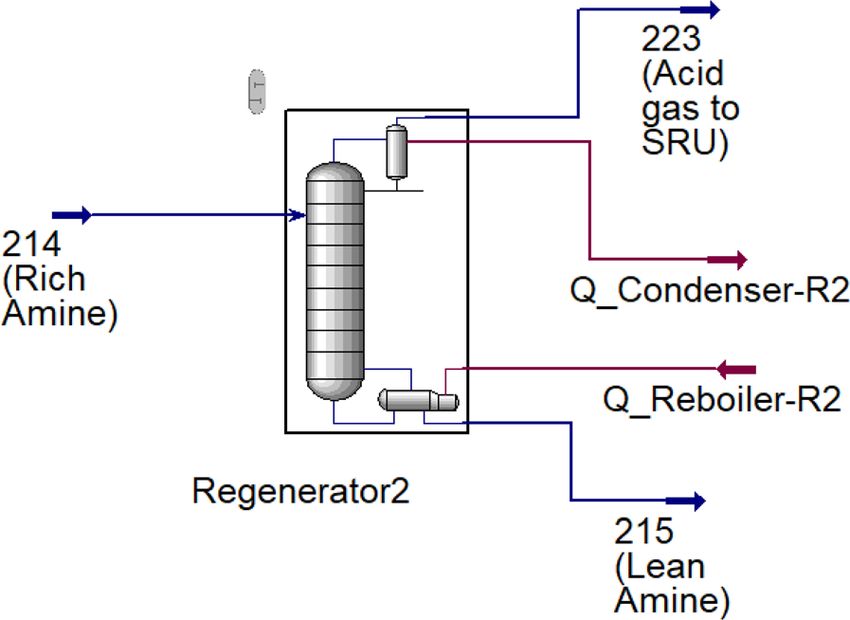
Ibrahim et al. Journal of Engineering and Applied Science   (2021) 68:6                                       Page 7 of 19

                    Fig. 4 Regenerator1

                  process is used on acid gas streams containing essentially H2S and ammonia. The con-
                  cept of the process is that one-third of the H2S contained in the acid gas feed is trans-
                  formed into SO2 in the thermal Claus section. SO2 reacts with the remaining two-
                  thirds of H2S to form sulphur in the catalyst Claus section. Tail gas treatment unit
                  (TGTU) treats Claus tail gas to convert SO2 into H2S. The converted H2S is cooled and
                  then absorbed by lean amine then recycled for reprocessing.
                    The liquid sulphur produced in the SRU contains soluble H2S and H2Sx (hydrogen
                  polysulphides). During sulphur conveyance and handling, the presence of H2S in the li-
                  quid could cause safety and environmental problems due to its toxicity and explosion
                  hazards. Therefore, liquid sulphur is degassed in order to reduce the H2S content at
                  the safety value of 10 ppm by weight. The incineration of the tail gas produced in the
                  Claus and TGT units is necessary to transform all sulphured compounds present into
                  SO2. The flue gas produced in the incineration is discharged to the atmosphere via a
                  stack. A detailed description of the simulation with a case study is prepared in another

                    Fig. 5 Regenerator2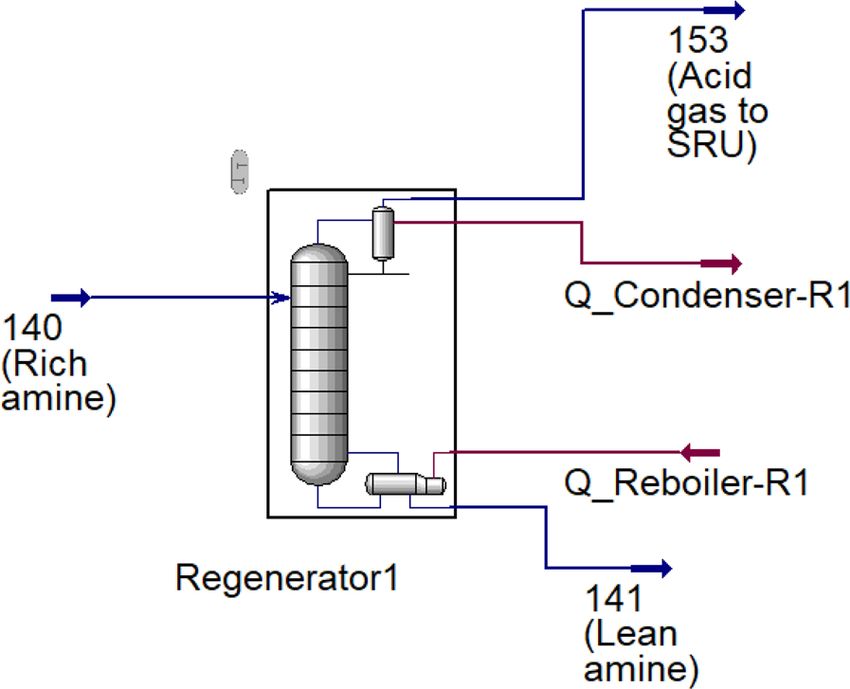
Ibrahim et al. Journal of Engineering and Applied Science   (2021) 68:6                                      Page 8 of 19

                    Fig. 6 Combined towers

                  article with the name Performance assessment and process optimization of a sulphur re-
                  covery unit: a real starting up plant. The amine regenerator section in the SRU is simu-
                  lated in another article where a complete exergy study is conducted with actual case
                  studies with the name (Exergy study of amine scrubber unit using MDEA in a refinery
                  sulfur recovery unit: a real starting up plant).

                  Validation step
                  The simulated results are compared with plant data for validation. The validation
                  streams concentrate on SWSAG to SRU and AAG to SRU streams as these are the
                  combined streams from the towers. Low percentage deviation exists. The validation cri-
                  teria required a comparison of the chosen simulated streams to plant data. The simula-
                  tions’ success is dependent on the low percentage deviation between simulated streams
                  and plant data.

                  Exergy calculations
                  The exergy analysis is done for SWS1 plant. The physical and chemical exergy are cal-
                  culated based on the following equations:
                    Physical exergy = (H − H0) − T0(S − S0) (1)
                    Chemical exergy = ∑ xiex0che + RT0 ∑ xi ln xi (2)

                    Fig. 7 SRU simulation
Ibrahim et al. Journal of Engineering and Applied Science (2021) 68:6 Page 9 of 19
Destruction exergy = ∑ miei − ∑ meee (3)
where xi is the mole fraction of specie i in the mixture, and ex0che is the standard
chemical exergy found directly from tables or calculated through methods [27].
The terms of H, T, S and R stands for enthalpy, temperature, entropy and global con-
stant of gases, respectively. Term 0 represents the standard conditions of the species.
We did not neglect chemical exergy due to its higher value in comparison with phys-
ical exergy.
Eph = m ˙ eph (4)
Ech = m ˙ ech (5)
The sum of the physical and chemical exergy of each stream represents the total
exergy of the stream.
E = Eph + Ech (6)
A term in exergy is called exergy efficiency of the system. It is defined as the ratio be-
tween the value of the outlet exergy to the value of the inlet exergy, while the exergy ef-
ficiency of the whole system is the percentage of inlet exergy that is converted to outlet
1 in the system [10, 27–29].
Exergy destruction calculation for equipment of SWS1 unit
The exergy destruction calculations are performed based on the equations in Table 3.
Composition calculations for SRU feed streams
The SRU feed is composed of SWS acid gas and ARU acid gas; both composition
streams are calculated from the combined simulation shown in Fig. 6.
Calculation of the SRU production capacity
The output calculated composition from the combined towers simulation is exported
to Excel, then Excel export the calculated composition to SRU simulation to calculate
the SRU sulphur production capacity. We can explain the calculation from the begin-
ning: the feed to all towers is first exported from a PHD system to export live data to
an Excel file, then the live data are exported to combined tower simulation from Excel
to calculate the composition of streams inlet to SRU plant. The feed to the SRU plant
is imported from the PHD live system to calculate the capacity.
Steps for linkage excel with HYSYS
From the Aspen Simulation Workbook inside Excel, select enable (to enable the con-
nection between Excel and HYSYS), then select the “add button” and search your
HYSYS case from the PC, so the name of the HYSYS case will appear on the bar beside
Table 3 Exergy destruction for SWS1 equipment
Equipment Exergy in Exergy out Exergy destruction
E1 E107+E122 E108+E123 E107+E122-E108-E123
Pump E107+E122 E121+Q_P E107+E122-E121-Q_P
Stripper E108+Q_Reboiler E111+E121+Q_Cooler E108+Q_Reboiler-E111-E121-Q_Cooler
Air cooler E123 E124 E123-E124
E2 ECW-in+E125 ECW-out+E126 ECW-in+E125-ECW-out-E126Ibrahim et al. Journal of Engineering and Applied Science (2021) 68:6 Page 10 of 19
the add button. Select “connect” and wait until the connection ends, and the simulation
connection will appear. Click “visible”, the HYSYS simulation will open from Excel, and
no need to open the case from HYSYS. Now, we need to add any variable from HYSYS
to Excel, and after that, any changes in Excel will reflect in HYSYS. From HYSYS, select
the value of any variable and copy it (for example, the inlet temperature of a feed
stream). Go to Excel and select organizer (the glass shape from Aspen Simulation
Workbook). Select model variable and just paste it in the model variable. The
temperature will appear inside the model variable. Right-click the temperature and se-
lect “create table”. Select a cell in the Excel sheet to show your temperature variable in-
side excel. The value of the temperature will appear in Excel in the form of a table.
Change the temperature now inside Excel; it will be changed in HYSYS automatically.
If you have a system like PHD talks the data life of the plant, you can make the
temperature cell gathering the data directly and this will reflect in HYSYS.
Steps of using the simulation with actual live plant process data
The simulations are validated first by comparing them to plant PFD data. Following the
success of the simulation, the Process Historian Data (PHD) system is linked to Excel
with actual plant units, such as m3/h instead of kg/h as the unit measurement, and then
Excel is linked to HYSYS simulation as described with the actual plant units.
Example 1: Using SWS dynamic units
The feed tag numbers are written in the Excel file used to enter the feed data of the
SWS units as stored in the PHD system, as shown in Table 4.
The new dynamic feed is linked to the validated simulation, as given in ‘Composition
calculations for SRU feed streams’ and the combined simulation computes the compos-
ition out from the SWS and ARU units to the SRU, as specified in ‘Exergy
Calculations’.
Example 2: Using SRU dynamic units
The feed tags numbers are entered as saved in the PHD system with actual units Nm3/h
in the Excel file used to enter the feed data from the SWS units and the ARU units to the
SRU, as illustrated in Table 5. The actual dynamic live data is linked to the HYSYS SRU
validated model, and the new feed values with Nm3/h reset the validated feed values with
kg/h, and the SRU simulation computes the sulphur production in kg/h.
Table 4 SWS tag names in the PHD system
Feed tag name Value (m3/h)
SWS1.FIC0005.PIDA.PV 124.03
SWS2.FIC0004.PIDA.PV 27.74
ARU1.FIC0038.PIDA.PV 472.67
ARU2.FIC0006.PIDA.PV 74.44Ibrahim et al. Journal of Engineering and Applied Science (2021) 68:6 Page 11 of 19
Table 5 Actual SRU dynamic units
SWS to SRU (Nm3/h)
1028.26
AAG to SRU (Nm3/h)
1213.32
Results and discussion
Validation results
The validation concentrates on two main streams (the SWS AG inlet to SRU, and the
AAG inlet to SRU) because these streams reflect the accuracy for all the simulations of
the combined model. The validation results are shown in Table 6.
Exergy calculations
Physical and chemical exergy calculations for streams
The physical and chemical exergy calculations for streams are calculated based on the
equations of ‘Simulation and process description of Sulphur recovery unit’; HYSYS cal-
culated molar flow rates, mass flow rates and mass exergy for streams are presented in
Table 7.
The physical exergy, chemical exergy and total exergy for the streams were calculated
using the equations in ‘Simulation and process description of Sulphur recovery unit’
and listed in Table 8.
The total exergy of some streams is higher than other streams. For example, Etot for
stream 111 is 15,173.82 kW while Etot for stream 125 is 870.03 kW. The purpose is de-
scribed in the following: The total exergy was the summation of the physical and chem-
ical exergy values. Usually, the chemical exergy value is extremely higher than the
physical exergy values, so it is the main influencer of Etot values. The composition of
the components had the main effect on the Ech value calculated using the equation ∑
xiex0che + RT0 ∑xi ln xi. The ex0che values of components are the main influencer of the
Ech value. Stream 111 is composed of 0.501 wt.-Fr. H2S, 0.231 NH3 and the remaining
is water. Stream 125 is approximately 100% water. The H2S standard chemical exergy
and the NH3 standard chemical exergies were much higher than that of water. The
ex0che values for H2S, NH3 and H2OL are 812.00 kJ/mol, 337.90 and 0.90 kJ/kmol, re-
spectively. Consequently, the chemical exergy at stream 111 was much higher than that
of stream 225; consequently, Etot for stream 111 is higher than Etot for stream 125.
Table 6 Validation results
Design Simulation Dev % Design Simulation Dev %
Stream name AAG to SRU SWS AG to SRU
Temperature 55 55 0.00 92 92 0.00
Pressure 0.75 0.75 0.00 0.77 0.77 0.00
Mass 11,975 12,263.52 − 2.41 3674 3762.59 − 2.41
Component Mole fraction Mole fraction
H2O 0.100 0.091 8.94 0.338 0.343 − 1.54
NH3 0.000 0.000 0.00 0.337 0.315 6.42
H2S 0.900 0.909 − 0.99 0.325 0.341 − 5.02Ibrahim et al. Journal of Engineering and Applied Science (2021) 68:6 Page 12 of 19
Table 7 HYSYS calculations for streams
Stream number Molar flow (Kmol/h) Mass flow (kg/h) Mass exergy (kJ/kg)
107 6957.36 126,066.30 6.39
108 in 6957.36 126,066.30 26.68
108 6957.36 126,066.30 26.68
111 140.97 3268.32 151.53
121 6816.39 122,797.98 61.49
122 6816.39 122,797.98 62.34
123 6816.39 122,797.98 27.32
124 6816.39 122,797.98 8.91
125 2953.08 53,200.00 8.91
126 2953.08 53,200.00 2.15
127 3863.31 69,597.98 8.91
CW in 11,673.82 210,305.00 1.02
CW out 11,673.82 210,305.00 1.70
The values for Q_P, Q_Reboiler and Q_Cooler were 31.8, 10,560 and 3839 kW, re-
spectively. These values were used in the destruction calculations for the equipment, as
listed in Table 3. Usually, the chemical exergy magnitude is higher than that for the
physical exergy in most streams as shown in Table 8.
Exergy destruction and exergy efficiency of equipment
Exergy destruction calculations of equipment are calculated based on the equations in
Table 3; exergy efficiencies of equipment and percentage share of destruction are calcu-
lated based on Section 2.4 and presented in Table 9.
The highest destruction rate is observed in stripper with a value of 5028.58 kW and a
percentage share of 81.06% of the total destruction, then air cooler with a value of
627.98 kW and a percentage share of 10.12% of the total destruction. The percentage
share of destruction is shown in Fig. 8. The overall efficiency of exergy is 89.71%.
Table 8 Streams exergies
Stream number Eph (kW) Ech (kW) Etot (kW) % share of Eph in Etot
107 223.86 16,348.95 16,572.81 98.65
108 in 934.17 16,348.95 17,283.11 94.59
108 934.17 16,348.95 17,283.11 94.59
111 137.57 15,036.25 15,173.82 99.09
121 2097.30 1704.42 3801.72 44.83
122 2126.44 1704.42 3830.86 44.49
123 931.78 1704.42 2636.20 64.65
124 303.80 1704.42 2008.23 84.87
125 131.62 738.41 870.03 84.87
126 31.81 738.41 770.22 95.87
127 172.19 966.01 1138.20 84.87
CW in 59.52 2918.45 2977.97 98.00
CW out 99.10 2918.45 3017.55 96.72Ibrahim et al. Journal of Engineering and Applied Science (2021) 68:6 Page 13 of 19
Table 9 Exergy destruction and exergy efficiency results
Equipment Destructed energy (kW) Percentage share Exergy efficiency (%)
Stripper 5028.58 81.06 81.94
Air cooler 627.98 10.12 76.18
E1 484.35 7.81 97.63
E2 60.22 0.97 98.43
Pump 2.65 0.04 99.93
Sum 6203.78 100.00 89.71
Table 10 represents the standard chemical exergy values for the components used in
the study. The H2S has the highest value of 812.00 kJ/mol, then NH3 with a value of
337.90 kJ/mol. It is important to know that the standard chemical exergy value of
H2O(L) is different from H2O(V). It is mandatory to check the actual status of water to
select the proper value of ex0che.
Standard chemical exergy values for the components were used in the study [29].
Exergy results comparison with ARU1 and MDEA scrubber study
Ibrahim et al. performed an exergy study of the amine scrubber unit of the SRU plant
on different equipment. MDEA is used in this unit. The study was conducted on two
different concentrations (45% and 22%) by weight.
Also, they performed an exergy study of one of the two ARU units of the plant. DEA
is regenerated in this unit. The DEA concentration decreased from the design concen-
tration 25 to 20% wt.% due to system losses. The design concentration value of the
amine is set by the licensor of the process to guarantee that the amine will perform effi-
ciently for H2S gas sweetening. The decrease in this concentration due to any purposes
may lead also to other severe problems.
System losses in general for amine may happen due to many purposes explained in
‘Purposes of amines losses’. The study was conducted on two different concentrations
(25% and 20%) by weight. A comparison was conducted between the similar equipment
Fig. 8 Percentage share of equipmentIbrahim et al. Journal of Engineering and Applied Science (2021) 68:6 Page 14 of 19
Table 10 Standard chemical exergy values for the components used in the study
Components ex0che (kJ/mol)
H2O(L) 0.90
H2O(V) 9.50
NH3 337.90
H2S 812.00
CO2 19.48
H2 236.09
of the current study and the previous two studies to conclude the similar relationships
between equipment [30, 31].
Columns comparison
It was observed that the main highest exergy destruction in the three units was in the
columns (regenerators and stripper). Table 11 shows the tower values in the three units
and the percentage share of these values in total unit destructions.
It was observed that the columns in the three units have the highest destruction rate.
All destruction rate values of the columns exceed 78% of the total destruction of the
units [29, 30].
Air coolers comparison
The air coolers exist in ARU and SWS. The air coolers in their units have the second-
highest destruction rates and percentage shares in destruction as shown in Table 12.
The destruction values exceed 7% in the two units [30, 32].
Pumps comparison
The pumps in the three units have the lowest percentage share in the destruction of
the units. Table 13 shows the comparison between pump destructions in three units.
The pumps have a contribution low than 1% in three units [30, 32].
Purposes of amine losses
The decrease in amine concentration in plants is due to process losses. The concentra-
tion of the amine can decrease during the start-up phase for three reasons: amine deg-
radation, foaming and flooding. Amines are converted into undesirable products during
the degradation process, which is not recoverable by normal regeneration. Amines may
be degraded for a variety of reasons. The make-up water used to prepare the Amine
Table 11 Comparison between columns destructions in three units
Columns (regenerator or stripper)
Unit Destructed energy (KW) Total unit destruction (kW) % share of destruction in its unit
MDEA 45% 1937.89 2404.85 80.58
MDEA 22% 1494.27 1908.86 78.28
ARU 25% 13,459.73 16,907.45 79.61
ARU 20% 15,571.65 18,964.53 82.11
SWS1 5028.58 6203.78 81.06Ibrahim et al. Journal of Engineering and Applied Science (2021) 68:6 Page 15 of 19
Table 12 Comparison between air coolers destructions in two units
Air cooler
Unit Destructed energy (kW) Total unit destruction (kW) % share of destruction in its unit
ARU 25% 2096.65 16,907.45 12.40
ARU 20% 2034.29 18,964.53 10.73
SWS1 627.98 6203.78 7.81
solution is one of these purposes. Suspended solids, nonvolatile substances, lower and
higher molecular weight hydrocarbon, additives and antifoaming agents, corrosion in-
hibitor, make-up water and water impurities, and inorganic and organic acids are some
of the other purposes. Flushing and cleaning procedures, such as degreasing, must be
performed before the start-up of any plant. In a lot of instances, it is not done correctly.
Unwanted compounds are present, particularly during start-up if there is a problem
with the unit’s cleaning. As a result, a large number of these pollutants are present in
the system, causing amine degradation. One of the concerns about amine degradation
is foaming. Foaming allows a portion of the amine to escape from the top of the tower
rather than the bottom, resulting in MDEA loss and a decline in concentration. Other
degradation issues include reduction solution capability and plant efficiency, corrosion
effect of degradation products, capital/material issues, the environmental effect of deg-
radation products and the fouling effect of degradation products. The flooding
phenomenon, which occurs at high sour gas feed flow rates and causes a portion of the
DEA or MDEA to exit with the sweet gas from the top, is the third explanation for the
decrease in concentration. Foaming and flooding phenomena in the plant absorbers
were observed many times during the start-up process [30, 34].
Sulphur production calculation results
Sulphur production is calculated from the SRU simulation. The calculated composition
for SWSAG to SRU, and AAG to SRU from the combined simulation is exported to
Excel, then they are connected to HYSYS as explained in ‘Composition calculations for
SRU feed streams’. Table 14 shows the computed SWS AG and AAG compositions.
It was observed that the upsets in temperature upstream the amine drain drum
strongly affects the sulphur production. Table 15 shows the sulphur production at dif-
ferent temperatures. The normal temperature is 55 °C, while the purpose of deviations
in temperatures is process upsets.
Table 13 Comparison between pumps destructions in three units
Pumps
Unit Destructed energy (kW) Total unit destruction (kW) % share of destruction in its unit
MDEA 45% 5.01 2404.85 0.11
MDEA 22% 4.06 1908.86 0.11
ARU 25% 198.41 16,907.45 0.59
ARU 20% 198.95 18,964.53 0.53
SWS1 2.65 6203.78 0.04Ibrahim et al. Journal of Engineering and Applied Science (2021) 68:6 Page 16 of 19
Table 14 Computed SWS AG and AAG mole fraction from the combined model
Combined SWS AG composition AAG composition
model
Mole fraction
computed
compositions
H2O 0.36 0.09
NH3 0.37 0.00
H2S 0.27 0.91
The production is affected due to the vaporization of more water in the top of the stream
decrease the mole fraction of H2S which is the source of sulphur product. Table 16 presents
this variation.
Conclusions
A refinery plant in the Middle East that started its official production in 2020 has an
SRU plant to recover sulphur from H2S with 99.9% SRE. The acid gas feed containing
mainly H2S and NH3 to the SRU plant is provided from SWS1, SWS2, ARU1 and
ARU2 units. First, a complete exergy study was conducted on SWS1.
The destruction rate of all equipment was calculated. It was observed that the highest
destruction rate was in the stripper with a destruction rate of 5028.58 kW and a per-
centage share of 81.06% of the total destruction. The stripper exergy efficiency was
81.94%. The air cooler showed the second-highest one with a destruction rate of 627.98
kW and a percentage share of 10.12% of the total destruction. The exergy efficiency of
the air cooler was 76.18%.
We must evaluate the exergy from two points of view: the first one is the destruction
rate, and the second one is the exergy efficiency. Although the destruction rate of the
stripper is higher than the air cooler, its exergy efficiency is higher. The overall exergy
efficiency of the SWS1 process is 89.75%.
The SWS1 exergy study results were compared by the study of two other units in the
same refinery plant (the amine scrubber unit of SRU and an amine regenerator unit). It
was observed that the main highest exergy destruction in the three units was in the col-
umns (regenerators and stripper) with a percentage share values exceeding 78% of the
total destruction of each unit. The air coolers existing in SWS and ARU units slowest
the second-highest destruction rates with values exceeding 7% of the total destruction
of their units. The pumps in the three units have the lowest percentage share in the de-
struction of the units with a contribution low than 1% of the total destruction in the
three units. These recent exergy studies from around the world will help to reduce
exergy losses in process systems.
Table 15 Sulphur production versus AAG to amine drum stream temperature
Temperature (°C) Sulphur production (tons/day)
70 230.21
65 239.51
60 247.21
55 253.56
50 258.73
45 262.61Ibrahim et al. Journal of Engineering and Applied Science (2021) 68:6 Page 17 of 19
Table 16 AAG composition at different inlet temperatures to SRU
AAG Temperature
components
45 50 55 60 65 70
Components mole fractions
H2O 0.06 0.07 0.09 0.12 0.14 0.18
H2S 0.94 0.93 0.91 0.88 0.86 0.82
Four columns are simulated individually and combined in one simulation (stripper1,
stripper2, regenerator1 and regenerator2) for SWS1, SWS2, ARU1 and ARU2, respect-
ively. The computed composition for SWS acid gas feeding the SRU in normal oper-
ation was 0.36 mole fraction H2O, 0.37 mole fraction NH3 and 0.27 mole fraction H2S.
While the computed composition for ARU acid gas feeding the SRU in normal oper-
ation was: 0.09 mole fraction H2O and 0.91 mole fraction H2S and 0 mole fraction
NH3. The sulphur production in normal conditions was 253.56 tons/day. During up-
sets, the sulphur production is strongly affected by variation of AAG temperature inlet
to SRU plant.
Nomenclature
e specific exergy
E exergy rate
ε exergy efficiency
H enthalpy
m˙ mass rate
S entropy
T temperature
R Gas constant
Subscripts
che chemical
e exit
i Inlet, specie in a mixture
0 Standard conditions
Superscripts
ch chemical
ph physical
0 Standard conditions
Abbreviations
AAG: Amine acid gas; AG: Acid gas; ARU: Amine regeneration unit; CW: Cooling water; DEA: Diethanolamine;
E: Exchanger; Eq: Equation; LA: Lean amine; MDEA: Methyl diethanolamine; P: Pump; PC: Personal computer;
PFD: Process flow diagram; PHD: Process Historian Database; RA: Rich amine; SRE: Sulphur recovery efficiency;
SRU: Sulphur recovery unit; SWS: Sour water stripping; SWSAG: Sour water stripping acid gas; TG: Tail gas; TGTU: Tail
gas treatment unit; wt.: Weight
Acknowledgements
The authors would like to thank all refinery company team and process engineering team for the support by data
availability and shared ideas.Ibrahim et al. Journal of Engineering and Applied Science (2021) 68:6 Page 18 of 19
Authors’ contributions
A.Y.I, F.H.A and M.A.G have made substantial contributions to the conception design of the work; the acquisition,
analysis and interpretation of the data and the creation of new software used in the work; have drafted the work or
substantively revised it; have approved the submitted version (and any substantially modified version that involves the
author’s contribution to the study); have agreed both to be personally accountable for the author’s own contributions;
and have ensured that questions related to the accuracy or integrity of any part of the work, even ones in which the
author was not personally involved, are appropriately investigated and resolved, and the resolution documented in
the literature. All authors have read and approved the final manuscript and ensure that this is the case.
Funding
This study had no funding from any resource.
Availability of data and materials
All the data required are included in the manuscript.
Declarations
Competing interests
The authors declare that they have no competing interests.
Author details
1
Department of Chemical Engineering, Cairo University, Giza 12613, Egypt. 2Department of Chemical Engineering, Port
Said University, Port Fuad 42526, Egypt. 3Department of Chemical Engineering, The British University in Egypt,
Misr-Ismalia Road, El Shorouk City, Cairo 11837, Egypt.
Received: 23 March 2021 Accepted: 18 June 2021
References
1. Khatami A, Heidari Y, Safadoost A, Aleghafouri A, Davoudi M (2016) The activity loss modeling of catalytic reactor of
sulfur recovery unit in south pars gas complex (SPGC) 3rd refinery based on percolation theory. Journal of Natural Gas
Science and Engineering 28:723–736. https://doi.org/10.1016/j.jngse.2015.08.059
2. Abdolahi-Mansoorkhani H, Seddighi S (2019) H2S and CO2 capture from gaseous fuels using nanoparticle membrane.
Energy 168:847–857. https://doi.org/10.1016/j.energy.2018.11.117
3. Mahmoodi B, Hosseini SH, Ahmadi G, Raj A (2017) CFD simulation of reactor furnace of sulfur recovery units by
considering kinetics of acid gas (H2S and CO2) destruction. Appl. Therm. Eng. 123:699–710. https://doi.org/10.1016/j.a
pplthermaleng.2017.05.148
4. Abdoli P, Hosseini SA, Mujeebu MA (2019) Effect of preheating inlet air and acid gas on the performance of sulfur
recovery unit—CFD simulation and validation. Forsch. Ingenieurwes. 83(1):81–89. https://doi.org/10.1007/s10010-019-002
99-9
5. Lavery CB, Marrugo-Hernandez JJ, Sui R, Dowling NI, Marriott RA (2019) The effect of methanol in the first catalytic
converter of the Claus sulfur recovery unit. Fuel 238:385–393. https://doi.org/10.1016/j.fuel.2018.10.128
6. Sui R, Lavery CB, Li D, Deering CE, Chou N, Dowling NI, Marriott RA (2019) Improving low-temperature CS2 conversion
for the Claus process by using La (III)-doped nanofibrous TiO2 xerogel. Appl. Catal. B Environ. 241:217–226. https://doi.
org/10.1016/j.apcatb.2018.09.027
7. Ibrahim S, Rahman RK, Raj A (2017) Effects of H2O in the feed of sulfur recovery unit on sulfur production and aromatics
emission from Claus furnace. Ind. Eng. Chem. Res. 56(41):11713–11725. https://doi.org/10.1021/acs.iecr.7b02553
8. Ibrahim A, Y. (2021) Performance assessment of a Sulphur recovery unit. Petroleum and Petrochemical Engineering
Journal. 5(1)
9. Ibrahim A, Y. (2021) Performance monitoring of a Sulphur recovery unit: a real startup plant. Petroleum and
Petrochemical Engineering Journal. 5(1)
10. Rostami A, Tavan Y (2019) A survey on exergy, energy and environmental analysis of sulfur recovery unit in case of five
intensified configurations. Chem. Pap. 73(6):1529–1539. https://doi.org/10.1007/s11696-019-00705-0
11. Minier-Matar J, Janson A, Hussain A, Adham S (2017) Application of membrane contactors to remove hydrogen sulfide
from sour. J. Membr. Sci. 541:378–385. https://doi.org/10.1016/j.memsci.2017.07.025
12. Gai H, Chen S, Lin K, Zhang X, Wang C, Xiao M, Huang T, Song H (2020) Conceptual design of energy-saving stripping
process for industrial sour water. Chin. J. Chem. Eng. 28(5):1277–1284. https://doi.org/10.1016/j.cjche.2019.12.020
13. Dardor D, Janson A, AlShamari E, Adham S, Minier-Matar J (2019) The effect of hydrogen sulfide oxidation with
ultraviolet light and aeration. Sep. Purif. Technol. 236:116262
14. Zahid Z (2019) Techno-economic evaluation and design development of sour water stripping system in the refineries. J.
Clean. Prod. 236:117633. https://doi.org/10.1016/j.jclepro.2019.117633
15. Zhu M, Sun L, Ou G, Wang K, Wang K, Sun Y (2016) Erosion corrosion failure analysis of the elbow in sour water stripper
overhead condensing reflux system. Eng. Fail. Anal. 62:93–102. https://doi.org/10.1016/j.engfailanal.2016.01.002
16. Hassan-Beck H, Firmansyah T, Suleiman MI, Matsumoto T, AL-Musharfy M, Chaudry A, Abdur-Rakiba M (2019) Failure
analysis of an oil refinery sour water stripper overhead piping loop: assessment and mitigation of erosion problems.
Eng. Fail. Anal. 96:88–99. https://doi.org/10.1016/j.engfailanal.2018.09.035
17. Amini J, Davoodi A, Jafari H (2018) Analysis of internal cracks in type 304 austenitic stainless steel cladding wall of
regenerator column in amine treating unit. Eng. Fail. Anal. 90:440–450. https://doi.org/10.1016/j.engfailanal.2018.04.028
18. Wang M, Hariharan S, Shaw R, A. & Hatton, T., A. (2019) Energetics of electrochemically mediated amine regeneration
process for flue gas CO2 capture. International Journal of Greenhouse Gas Control 82:48–58. https://doi.org/10.1016/j.
ijggc.2018.12.028Ibrahim et al. Journal of Engineering and Applied Science (2021) 68:6 Page 19 of 19
19. Mohamadi-Baghmoleaei M, Hajizadeh A, Zahedizadeh P, Azin R, Zendehboudi S (2020) Evaluation of hybridized
performance of amine scrubbing plant based on exergy energy, environmental, and economic prospects: a gas
sweetening plant case study. Energy 31:118715
20. Pashaei H, Ghaemi A (2020) CO2 absorption into aqueous diethanolamine solution with nano heavy metal oxide
particles using stirrer bubble column: hydrodynamics and mass transfer. Journal of Environmental Chemical Engineering
8(5):104110. https://doi.org/10.1016/j.jece.2020.104110
21. Aghel B, Sahraie S, Heidaryan E (2019) Carbon dioxide desorption from aqueous solutions of monoethanolamine and
diethanolamine in a microchannel reactor. Sep. Purif. Technol. 237:116390
22. Concepción EI, Moreau A, Martín MC, Vega-Maza D, Segovia JJ (2020) Density and viscosity of aqueous solutions of
methyldiethanolamine (MDEA) + diethanolamine (DEA) at high pressures. J. Chem. Thermodyn. 148:106141. https://doi.
org/10.1016/j.jct.2020.106141
23. Shunji K, Xizhou S, Wenze Y (2020) Investigation of CO2 desorption kinetics in MDEA and MDEA+DEA rich amine
solutions with thermo-gravimetric analysis method. International Journal of Greenhouse Gas Control 95:102947. https://
doi.org/10.1016/j.ijggc.2019.102947
24. Pal P, AbuKashabeh A, Al-Asheh S, Banat F (2015) Role of aqueous methyldiethanolamine (MDEA) as solvent in natural
gas sweetening unit and process contaminants with probable reaction pathway. Journal of Natural Gas Science and
Engineering 24:124–131. https://doi.org/10.1016/j.jngse.2015.03.007
25. Mores P, Scenna N, Mussati S (2012) CO2 capture using monoethanolamine (MEA) aqueous solution: modeling and
optimization of the solvent regeneration and CO2 desorption process. Energy 45(1):1042–1058. https://doi.org/10.1016/j.
energy.2012.06.038
26. Yang H, Xu Z, Fan M, Gupta R, Slimane RB, Bland AE, Wright I (2008) Progress in carbon dioxide separation and capture:
a review. J. Environ. Sci. 20(1):14–27. https://doi.org/10.1016/S1001-0742(08)60002-9
27. Hashemi M, Pourfayaz, F.& Mehrpooya, M. (2019) Energy, exergy, exergoeconomic and sensitivity analyses of modified
Claus process in a gas refinery sulfur recovery unit. J. Clean. Prod. 220:1071–1087. https://doi.org/10.1016/j.jclepro.2019.
02.213
28. Kotas, T., J (1985) The exergy method of thermal plant analysis, Butterworths.
29. Zarei S (2019) Exergetic, energetic and life cycle assessments of the modified Claus process. Energy 191:116584
30. Ibrahim AY, Ashour FH, Gadallah MA (2021) Exergy study of amine regeneration unit using diethanolamine in a refinery
plant: a real start-up plant. Heliyon 7:2
31. Ibrahim, A. Y., Ashour, F. H., Gadallah, M. A. (2021). Exergy study of amine regeneration unit for diethanolamine used in
refining gas sweetening: a real start-up plant. Alexandria Engineering Journal.
32. Ibrahim, A. Y., Ashour, F. H., Gadallah, M. A. (2021). Exergy study of amine scrubber unit of a sulphur recovery plant
using methyl diethanolamine: a real starting up plant, petroleum and coal, 63(1): 155-165.
33. Ibrahim AY, Ashour FH, Gadallah M (2021) Refining plant energy optimization. Alexandria Engineering Journal 60:4593–
4606
34. Islam MS, Yusoff R, Ali B, S. (2010) Degradation studies of amines and alkanolamines during CO2 absorption and
stripping system. Engineering e-Transaction 5:97–109
Publisher’s Note
Springer Nature remains neutral with regard to jurisdictional claims in published maps and institutional affiliations.You can also read