Hydrology of the Po River: looking for changing patterns in river discharge
←
→
Page content transcription
If your browser does not render page correctly, please read the page content below
Hydrol. Earth Syst. Sci., 16, 3739–3747, 2012
www.hydrol-earth-syst-sci.net/16/3739/2012/ Hydrology and
doi:10.5194/hess-16-3739-2012 Earth System
© Author(s) 2012. CC Attribution 3.0 License. Sciences
Hydrology of the Po River:
looking for changing patterns in river discharge
A. Montanari
Department DICAM, University of Bologna, Bologna, Italy
Correspondence to: A. Montanari (alberto.montanari@unibo.it)
Received: 13 May 2012 – Published in Hydrol. Earth Syst. Sci. Discuss.: 30 May 2012
Revised: 1 September 2012 – Accepted: 1 October 2012 – Published: 22 October 2012
Abstract. Scientists and public administrators are devoting largest average and largest maximum daily river flow, which
increasing attention to the Po River, in Italy, in view of con- are 275 m3 s−1 , 1470 m3 s−1 and 10 300 m3 s−1 , respectively.
cerns related to the impact of increasing urbanisation and ex- The Po River has 141 main tributaries and the related river
ploitation of water resources. A better understanding of the network has a total length of about 6750 km and 31 000 km
hydrological regime of the river is necessary to improve wa- for natural and artificial channels, respectively. The average
ter resources management and flood protection. In particu- volume of annual precipitation is 78 km3 , of which 60 % is
lar, the analysis of the effects of hydrological and climatic converted in outflow volume at the closure section. About
change is crucial for planning sustainable development and 450 lakes are located in the Po River basin. The water level
economic growth. An extremely interesting issue is to inspect of the larger south-alpine lakes of glacial origin is regulated
to what extent river flows can be naturally affected by the according to given management policies, therefore obtaining
occurrence of long periods of water abundance or scarcity, a regulation volume of 1.3 km3 approximately. It is interest-
which can be erroneously interpreted as irreversible changes ing to mention that 9 hydro-ecoregions are identified within
due to human impact. In fact, drought and flood periods alter- the Po River (Po River Basin Authority, 2006), which are de-
natively occurred in the recent past in the form of long-term fined as geographic areas where freshwater ecosystems have
fluctuations. This paper presents advanced graphical and an- a limited range of variation in terms of chemical, physical
alytical methods to gain a better understanding of the tem- and biological characteristics (Wasson et al., 1996).
poral distribution of the Po River discharge. In particular, we The above synthetic description clearly highlights the
present an analysis of river flow variability and persistence complexity of Po River basin, where significantly differ-
properties, to gain a better understanding of natural patterns, ent hydrological behaviours and ecosystems coexist and co-
and in particular long-term changes, which may affect the evolve. In fact, it is interesting to note that the Po River Basin
future flood risk and availability of water resources. Authority (2006) has identified 12 different fluvial regimes in
the Po catchment. Figure 1 presents a schematic map of the
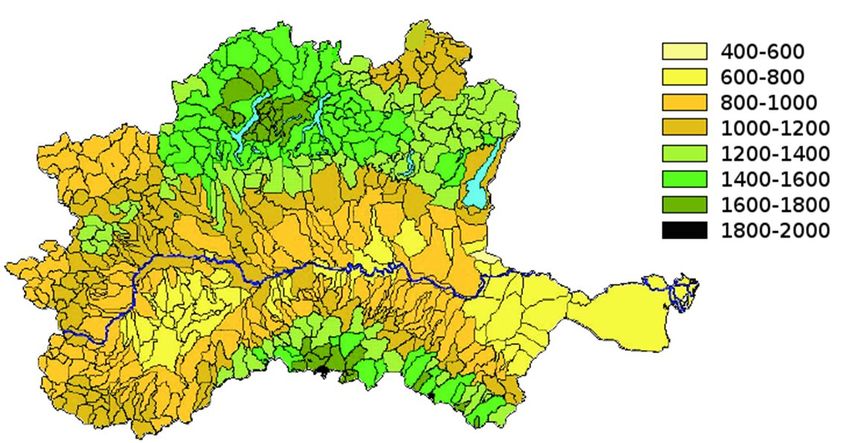
Po River basin, while Fig. 2 shows the spatial distribution of
rainfall over the catchment.
1 Introduction The history of the Po River floods is well known. In fact,
starting from the middle age the lands surrounding the river
The Po River is known to the public as the longest river were intensively cultivated. As a consequence, high river
entirely flowing in the Italian peninsula, being its main stages have significantly impacted local communities since
stream about 652 km long. It is also the Italian river with the that time and were thus recorded. The magnitude of the river
most extended catchment, whose area is about 71 000 km2 flows for ancient events is not known, and therefore it is
at the delta. Its observed discharge time series at the clo- difficult to assess the severity of the recorded floods. By
sure river cross section, which is conventionally located at observing their frequency, one may assess that events with
Pontelagoscuro (44◦ 530 19.3400 N and 11◦ 360 29.6000 E), in- about 5-yr return period were recorded. In fact, historical
cludes the observed values in Italy of largest minimum,
Published by Copernicus Publications on behalf of the European Geosciences Union.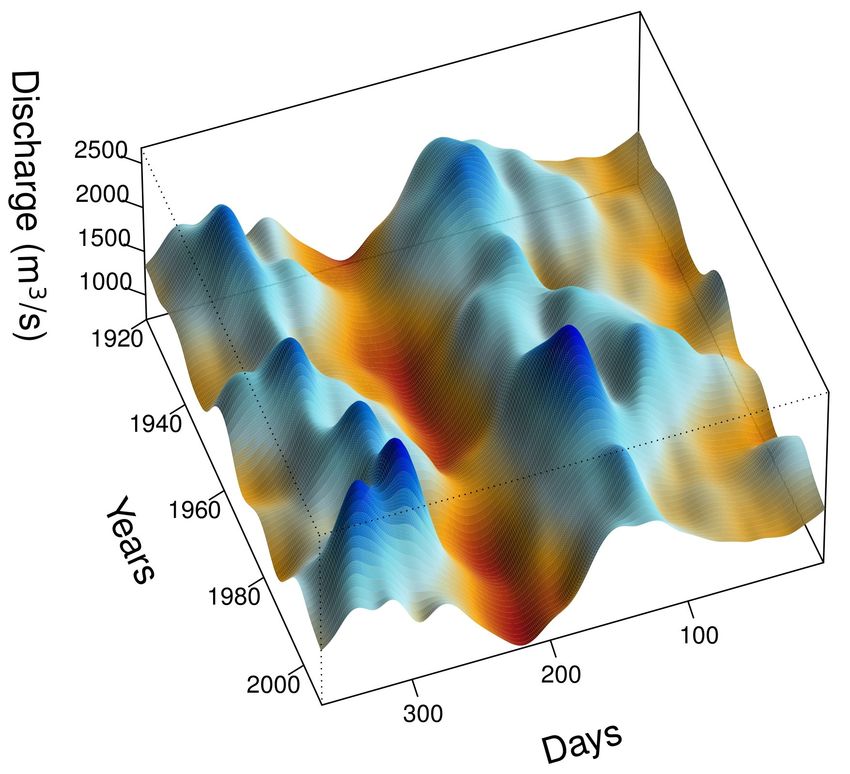
3740                                                              A. Montanari: Changing patterns in Po River discharge

                                                                  Fig. 2. Mean annual rainfall over the Po River basin (from Po River
                                                                  Basin Authority, 2006).

                                                                  their persistence properties, to gain a better understanding of
Fig. 1. Map of the Po River basin (from Wikipedia).               the behaviours of the river regime, the possible presence of
                                                                  footprints of human impact and the occurrence of the above
                                                                  anomalous periods of water abundance and scarcity.
information enables us to assess that 22, 14 and 18 floods
occurred in the 16th, 17th and 18th century, respectively.
The 1705 flood was recorded as a particularly destructive         2   Anthropisation and sustainability
event. In the 19th century there were 19 floods, with the
severest ones occurring in 1801, 1839, 1846, 1857, 1868 and       The downstream reach of the Po River flows across the
1872. The most important floods in the 20th century occurred      Padana Plain, a flat and fertile area that is very attractive for
in 1926, 1928, 1937, 1945, 1949, 1951, 1953, 1957, 1959,          human settlement. In fact, it experienced an intensive agri-
1966, 1968, 1976, 1977, 1986, 1993, 1994 and 2000. The            cultural and industrial development during the 20th century,
1951 flood was particularly severe, with inundations due to       in particular after the Second World War. Currently, about
broken embankments occurring at Gualtieri (close to Reggio        17 million people live in the Po River basin, where 40 % of
Emilia) and Occhiobello (close to Ferrara).                       the gross domestic product of Italy is produced (Po River
   The hydrological behaviours of the Po River have been          Basin Authority, 2006). Employment, agricultural produc-
extensively studied, especially for what refers to the flood      tion and energy consumption in the Po River basin amount
regime (see for example, Marchi, 1994; Visentini, 1953; Pic-      to 46 %, 35 % and 48 %, respectively, of the Italian total. In
coli, 1976; Zanchettini et al., 2008). However, many relevant     fact, water resources are intensely exploited in the catchment
questions are still open on the hydrology of the Po River, and    for irrigation, hydro-power production, civil and industrial
in particular with regard to the impact of the intense human      use. The mean annual hydrological fluxes for the Po River
activity that has developed in the catchment during the 20th      basin are summarised in Fig. 3 (see also Po River Basin Au-
century and the impact of climate change. In fact, the occur-     thority, 2006). In detail, the aforementioned average volume
rence of long periods characterised by abundance or scarcity      of annual precipitation feeds the river discharge at the out-
of river flows led to the development of scientific questions     let, the annual inflow to the underground aquifer (approxi-
that are largely unexplored.                                      mately 9 km3 ) and evapotranspiration from vegetation (ap-
   In a more general context, the analysis of the persistence     proximately 20–25 km3 ). The withdrawal from the aquifer
properties of complex river systems is attracting a renewed       is about 6.5 km3 , thus revealing that groundwater resources
interest today, in view of the related implications on natural    are close to overexploitation (deep percolation is about 1 km3
hydrological variability in the face of environmental change.     and there is some groundwater flow to the sea). Thus, the
Within this respect, a relevant role is played by long-term       margins to ensure future sustainability of groundwater re-
persistence, which means that river flows may keep memory         sources are limited, especially during years with lower than
of their past for a very extended period (Cohn and Lins, 2005;    average rainfall. The annual water withdrawal for irrigation,
Mudelsee, 2007; Koutsoyiannis, 2003, 2010). As a matter of        which contributes to evapotranspiration, is 17 km3 , while wa-
fact, long-term persistence implies the presence of fluctua-      ter withdrawals for industrial and civil use amount to 5 m3 ,
tions that may behave as irreversible tendencies in the short     80 % of which being withdrawn from groundwater. Most of
term and therefore have important consequences on flood           this latter flux evaporates and part of it contributes to the re-
mitigation and water resources management.                        turn flow to the river.
   This paper makes use of advanced graphical and analytical         The overall situation depicted in Fig. 3 reveals an intense
techniques to inspect the variability of the Po River flows and   exploitation of water resources that is currently sustainable

Hydrol. Earth Syst. Sci., 16, 3739–3747, 2012                                   www.hydrol-earth-syst-sci.net/16/3739/2012/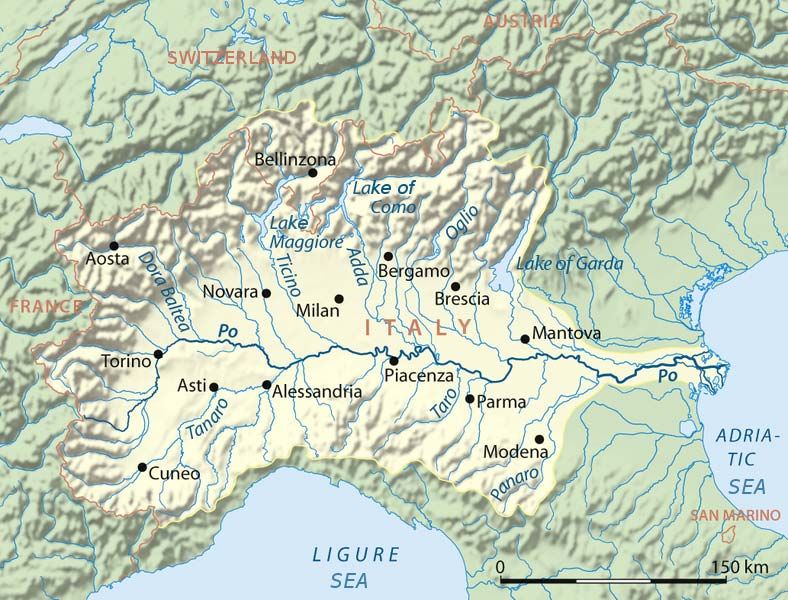
A. Montanari: Changing patterns in Po River discharge                                                                           3741

                                                                       acterised by a mixed pluvial/alpine regime, and the Stura
                                                                       di Lanzo River, where the alpine regime is dominant. The
                                                                       Dora Baltea River is a typical example of alpine regime,
                                                                       with one peak flow period only that occurs during sum-
                                                                       mer. The human impact along the tributaries is mainly due
                                                                       to urbanisation, river training, artificial reservoirs and wa-
                                                                       ter withdrawal for irrigation and civil use. River training
                                                                       and water storage/withdrawal may have a significant impact
                                                                       on the occurrence of floods and droughts. However, a vi-
                                                                       sual inspection of the river flow data did not provide any
                                                                       clear evidence of the presence of non-stationarity during the
                                                                       observation period. Further information on the above tribu-
                                                                       taries can be found in the Water Resources Protection Plan
Fig. 3. Mean annual main hydrological fluxes for the Po River basin.   of the Italian administrative regions Piemonte (available on-
                                                                       line at http://www.regione.piemonte.it/acqua/pianoditutela/
                                                                       tutela.htm, in Italian) and Valle D’Aosta (available online at
on average, as we previously mentioned, but it is poten-
                                                                       http://www.regione.vda.it, in Italian).
tially problematic during drought periods. Increasing arti-
                                                                          The seasonal component for the time series presented in
ficial water storage and water withdrawals for irrigation is
                                                                       Table 1 was estimated by computing the daily average flow,
an option that has been considered. However, concerns have
                                                                       for each calendar day, across the years of the observation pe-
been expressed about reducing the river outflow to the sea,
                                                                       riod. The LOESS smoother was applied to reduce the vari-
which would exacerbate water quality problems along the
                                                                       ability of the periodical component, with a 30-day interpo-
river reach and the coastal areas. It is clear that efficient wa-
                                                                       lation window (Grimaldi and Montanari, 2000). Figure 4
ter resources management strategies are needed to ensure fu-
                                                                       shows the obtained seasonal components. They reflect the
ture sustainability of water uses, which need to be supported
                                                                       dominant climatic behaviours and thus confirm what was
by a detailed analysis of river discharge variability. Not sur-
                                                                       anticipated in Table 1. It is interesting to note that the sea-
prisingly, this research area is gaining increasing attention
                                                                       sonal components of the Po River at Piacenza and Ponte-
by the international scientific community (see, for example,
                                                                       lagoscuro are characterised by a minor peak in spring that
Bloeschl and Montanari, 2010).
                                                                       occurs around the end of March, which is likely due to melt-
                                                                       ing snow from mid-altitude mountains. For the Tanaro and
3     Analysis of river discharge variability                          Stura di Lanzo rivers, the late spring peak is anticipated and
                                                                       delayed, respectively, with respect to what is observed in the
3.1    Intra-annual analysis                                           lower course of the Po River. The seasonal component for the
                                                                       Dora Baltea River is distinctly different, being characterized
River discharge variability is frequently analysed in hydrol-          by a single peak in the summer months, as expected.
ogy with reference to the intra-annual period, in order to es-
timate the seasonal component, namely the progress of the              3.2   Inter-annual analysis: assessment of patterns in
average river flow along the year. The seasonal component                    peak and low flows
was herein estimated for the daily river flow time series ob-
served along the Po River at Pontelagoscuro, Piacenza and              The intra-annual variability analysis carried out in the previ-
Moncalieri, as well as for the tributaries Stura di Lanzo River        ous section provides indications about water resources avail-
at Lanzo, Tanaro River at Farigliano and Dora Baltea River             ability in different periods of the year, but it does not pro-
at Tavagnasco. Table 1 reports the observation period of the           vide any information on the possible presence of inter-annual
series, their mean value and standard deviation along with             trends. Actually, these latter are important because they may
the catchment area and synthetic information on the domi-              be due to human impact and imply long-term variations that
nant fluvial regime. The series are complete; that is, they are        may affect the future efficiency of water resources manage-
not affected by missing values.                                        ment strategies. Inter-annual tendencies in time series are of-
   To complete the information provided by Table 1, one                ten studied by analysing extreme flow values. For example,
may note that the dominant flood season for the Po River               Figs. 5 and 6 show the progress of the annual maximum and
at Pontelagoscuro and Piacenza is autumn, while the peak               minimum value, respectively, of the daily river flows of the
discharge volumes are generally observed in late spring. At            Po River at Pontelagoscuro, along with the related linear re-
Moncalieri the alpine fluvial regime exerts a significant in-          gression line estimated over the whole period. The results
fluence. Accordingly, the discharge volume in autumn is re-            show that an increasing and decreasing tendency seems to
duced and the dominant flood season is late spring. Similar            affect peak and drought flows, respectively, therefore imply-
behaviours are observed for the Tanaro River, which is char-           ing an exacerbation of the flood and drought risk in recent

www.hydrol-earth-syst-sci.net/16/3739/2012/                                        Hydrol. Earth Syst. Sci., 16, 3739–3747, 2012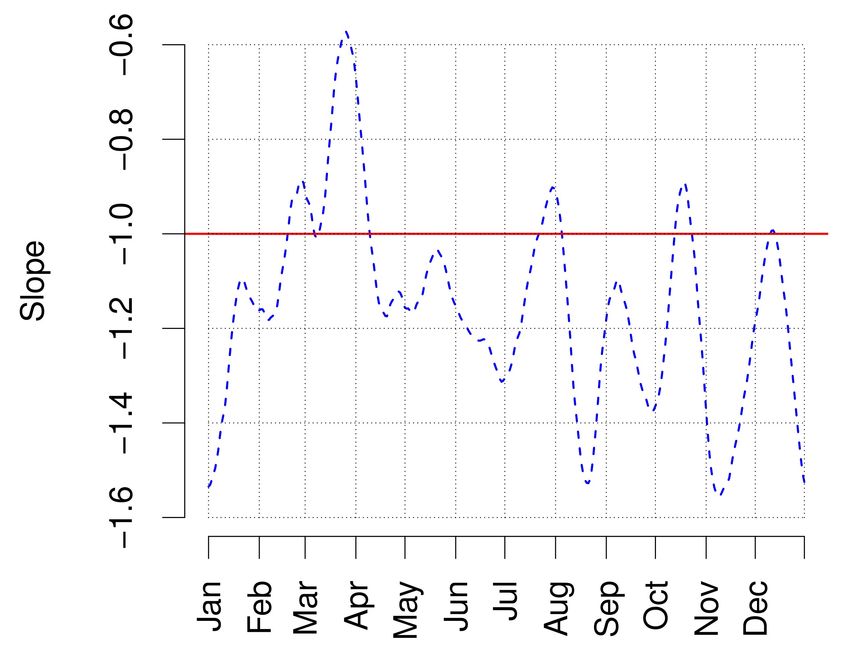
3742                                                                     A. Montanari: Changing patterns in Po River discharge

Table 1. Observation period, mean value µ and standard deviation σ of the observed time series, along with the catchment area A at the
considered location and the dominant fluvial regime according to the Po River Basin Authority (2006).

  Location                      Period      µ (m3 s−1 )   σ (m3 s−1 )   A (km2 )   Fluvial regime
  Po at Pontelagoscuro        1920–2009           1470          1007     71 000    Pluvial regime with two peak periods
  Po at Piacenza              1924–2009            959           773     42 030    Pluvial regime with two peak periods
  Po at Moncalieri            1942–1984             80            89      4885     Pluvial regime with two peak periods
  Tanaro at Farigliano        1944–1973             39            49      1522     Pluvial regime with two peak periods and high variability
  Stura di Lanzo at Lanzo     1946–1981             19            27        582    Mixed alpine and pluvial regime; autumn discharge is low
  Dora Baltea at Tavagnasco   1951–1989             91            78      3314     Alpine regime with only one peak during summer

Fig. 4. Seasonal components for the considered time series.

years. Similar results have been repeatedly obtained by pre-            assess the variability of the results along the observation pe-
vious analyses carried out by local administrations.                    riod. The results of such analyses are presented in the Supple-
   However, it should be noted that the above trends are                ment with animated pictures (see files regression-minima.gif
scarcely relevant from a statistical perspective. In fact, as-          and regression-maxima.gif). For the case of annual minima,
suming that the data are independent and assuming that the              19 negative slope values are obtained against 22 positive
null hypothesis of no trend is true, the p-values for the slope         ones, while the average value is even positive, being equal
of the linear regressions are 11 % and 26 % for annual max-             to 0.18 m3 (s yr)−1 . For the annual maxima the situation is
ima and minima, respectively. As a matter of fact, the un-              seemingly more clear, with 5 negative versus 36 positive
certainty of the estimate is relevant and becomes even more             slopes, with an average value of 9.24 m3 (s yr)−1 . However,
clear if one performed the linear regression over 41 subse-             even in the latter case the average p-value of the slope of the
quent 50-yr time windows, starting from 1920, in order to               regression line is equal to 46 % only. These results show that

Hydrol. Earth Syst. Sci., 16, 3739–3747, 2012                                           www.hydrol-earth-syst-sci.net/16/3739/2012/
A. Montanari: Changing patterns in Po River discharge                                                                                                                                3743
Maximum annual river discharge (m3/s)

                                        10000

                                         8000

                                         6000

                                         4000

                                         2000
                                                1920

                                                       1930

                                                              1940

                                                                     1950

                                                                            1960

                                                                                   1970

                                                                                          1980

                                                                                                 1990

                                                                                                        2000

                                                                                                               2009
Fig. 5. Annual maxima of the Po River at Pontelagoscuro daily dis-
charge series (1920–2009) and linear regression line.
Minimum annual river discharge (m3/s)

                                         1000

                                          800
                                                                                                                      Fig. 7. 3-D representation of the Po River daily discharge time series
                                          600                                                                         (1920–2009). The resulting surface was smoothed by applying a
                                                                                                                      moving average and a Gaussian filter.
                                          400

                                          200
                                                                                                                      but it is difficult to obtain a clear picture when dealing with
                                                                                                                      long series.
                                                1920

                                                       1930

                                                              1940

                                                                     1950

                                                                            1960

                                                                                   1970

                                                                                          1980

                                                                                                 1990

                                                                                                        2000

                                                                                                               2009

                                                                                                                         A careful analysis was carried out for the series of the Po
Fig. 6. Annual minima of the Po River at Pontelagoscuro daily dis-                                                    River at Pontelagoscuro by depicting the yearly time series
charge series (1920–2009) and linear regression line.                                                                 one by one. The results of such investigation are presented
                                                                                                                      in the supplementary material with an animated picture (see
                                                                                                                      file yearly-series.gif). They reveal the possible concentra-
the long-term tendency of the river flow is not easy to as-                                                           tion of floods and droughts in some periods that are several
sess, for local and opposite tendencies alternating irregularly                                                       years long.
along time.                                                                                                              In order to obtain an overall graphical representation of
   The above results show that the analysis of peak and low                                                           river discharge time series, for the purpose of detecting long-
river flows that is traditionally carried out to detect trends is                                                     and short-term patterns, we devised a 3-dimensional repre-
hardly useful to predict future configurations, even when ap-                                                         sentation where river discharge is plotted on the vertical axis
plying robust tools such the linear regression to extended data                                                       as a function of the respective year and calendar day that
bases like the Po River one. More refined analyses should                                                             are represented on the horizontal axes. The resulting surface
be carried out to inspect the possible presence of patterns in                                                        needs to be smoothed to make it regular. Smoothing was ob-
river flows, which should make use of all the observed values                                                         tained by applying a moving average filter followed by a
of river discharge.                                                                                                   Gaussian one. The width of the filter window was 25 and
                                                                                                                      10 adjacent values along the intra-annual and inter-annual
3.3                                      Inter-annual analysis: a graphical technique to                              direction, respectively.
                                         assess long-term variability                                                    Figure 7 shows the resulting surface for the Po River at
                                                                                                                      Pontelagoscuro. An animated revolving version of the same
Variability analysis and pattern identification for long hydro-                                                       figure is presented in the supplementary material with an an-
logical time series is a complex task because seasonality is                                                          imated picture (see file perspective-discharge.gif) that allows
superimposed to long-term and local behaviours, which are                                                             one to better identify local patterns. The seasonal regularity
buried in a large amount of data. Analytical techniques, like                                                         can be clearly seen, as well as singularities in the inter-annual
investigation of the persistence properties of the process, are                                                       direction that are extended well beyond the filter width. In
useful tools but sometimes the presence of uncertainty makes                                                          particular, the summer drought is clearly exacerbated in the
the physical interpretation of results cumbersome (see, for                                                           recent period, but a similar local perturbation occurred from
instance, Sect. 3.4). Graphical techniques are more effec-                                                            1940 to 1960, when a prolonged situation of water scarcity
tive in providing a perspective on local and global patterns,                                                         occurred. The singularity arising from the occurrence of two

www.hydrol-earth-syst-sci.net/16/3739/2012/                                                                                         Hydrol. Earth Syst. Sci., 16, 3739–3747, 2012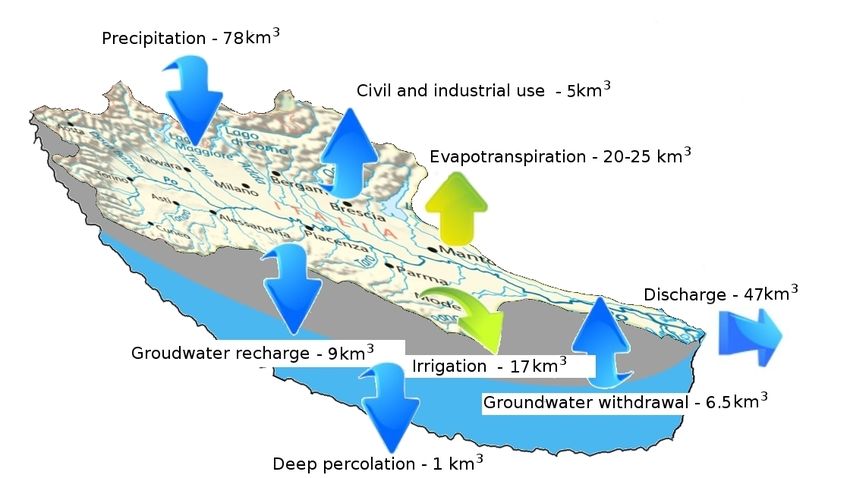
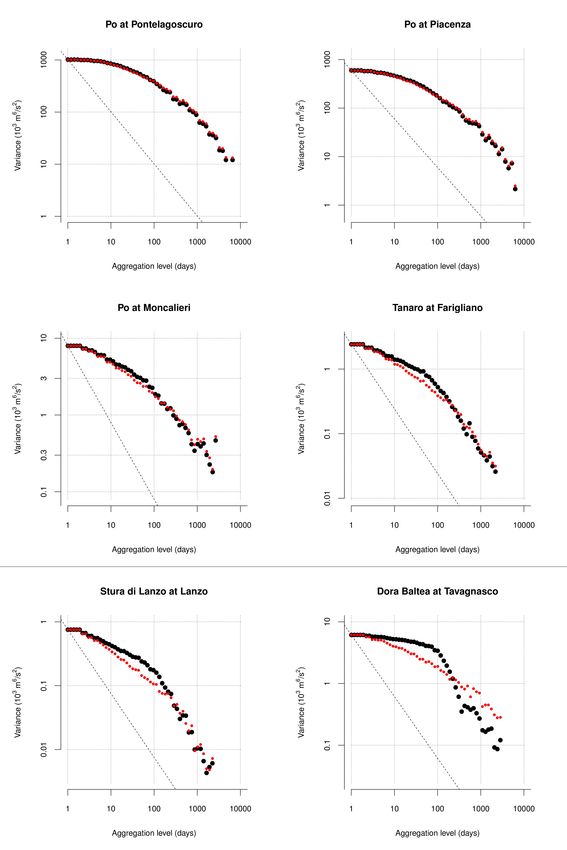
3744                                                                       A. Montanari: Changing patterns in Po River discharge

Fig. 8. Analysis of the variance for the considered time series. Black and red symbols refer to original (not deseasonalised) and deseasonalised
daily series, respectively.

Hydrol. Earth Syst. Sci., 16, 3739–3747, 2012                                             www.hydrol-earth-syst-sci.net/16/3739/2012/
A. Montanari: Changing patterns in Po River discharge                                                                           3745

                                                                       1995)

                                                                       Var XN ≈ cN −1 ,

                                                                                                                                  (1)

                                                                       where XN is the data series aggregated over N time steps
                                                                       and c > 0 is a constant. Then, by plotting the variance against
                                                                       the aggregation level in logarithmic scale, one should obtain
                                                                       points displaced along a straight line with slope equal to −1.
                                                                       The analysis of the variance was applied to the time series
                                                                       listed in Table 1 by using equally spaced N values in loga-
                                                                       rithmic scale and allowing blocks of aggregated data to over-
                                                                       lap. Figure 8 shows the obtained results, where black and
                                                                       red symbols refer to original (not deseasonalised) and de-
                                                                       seasonalised daily series, respectively. In fact, the presence
                                                                       of seasonality may have an impact on persistence estimation
Fig. 9. Analysis of the inter-annual variance for the time series of   (Montanari et al., 1999), which is, however, not very signifi-
the Po River at Pontelagoscuro (1920–2009).                            cant here but for the Dora Baltea river, which is commented
                                                                       below. By focusing on the River Po at Pontelagoscuro, one
                                                                       notes that the variability decreases slower than expected.
major floods in 1994 and 2000 is visible as well. It is interest-      This result is due to the presence of correlation that violates
ing to note the presence of other singularities. For instance,         the above assumption of independence. Its effect should be-
the spring peak occurring around the end of March was more             come negligible when the aggregation level becomes com-
pronounced in the years from 1950 to 1980 approximately,               parable to the temporal extension of the process persistence.
while it is less evident in recent years.                              However, Fig. 8 shows that the decreasing rate for variabil-
   Overall, Fig. 7 shows that the discharge time series of the         ity that is expected for independent data is never reached, but
Po River at Pontelagoscuro is affected by long-term natu-              only approached when aggregation reaches about 10 yr. This
ral fluctuations that significantly affect distribution and tem-       latter result is consistent with the presence of long-term per-
poral variability of water resources. This situation is com-           sistence.
patible with the presence of long-term persistence, which in              Similar results are obtained for the series of the Po River
hydrology is also called ”Hurst-Kolmogorov behaviour,” for             at Piacenza, while in Moncalieri, and especially for the trib-
which a convincing physical interpretation was not yet pro-            utaries, persistence is less extended. The results for the Dora
vided (see, for example, Hurst, 1951; Montanari et al., 1997;          Baltea series are significantly affected by the presence of
Koutsoyiannis, 2003; Montanari, 2003; Koutsoyiannis and                seasonality. However, in this case also one may conclude
Montanari, 2007; Koutsoyiannis et al., 2009). In particular,           that persistence vanishes after about 500–1000 days. These
the surface depicted in Figure 7 is compatible with the pres-          results seem to indicate that the superimposition of sev-
ence of a 2-dimensional Hurst-Kolmogorov pattern (Kout-                eral regimes affected by short-term persistence may induce
soyiannis et al., 2011). In order to provide a more substantial        the presence of long-term persistence in the receiving river
support to the above interpretation, a quantitative analysis of        reach. In fact, the same conclusion was previously reached
the persistence of the process has been carried out.                   by Mudelsee (2007).
                                                                          The above-described analysis of the variance was carried
3.4   Inter-annual analysis: assessment of the persistence             out by aggregating data in chronological order. A subsequent
      properties                                                       investigation was made of the variability after inter-annual
                                                                       aggregation. In detail, reference was made to an assigned day
The literature has proposed numerous techniques to assess              of the year and aggregation was performed over an increas-
the persistence properties of time series to provide support           ing number of years. The analysis was repeated for the 365
to the possible presence of the Hurst-Kolmogorov effect. An            calendar days, and the obtained slopes of the regression line
extended description of a selection of such techniques was             were subsequently regularised by using a 10-day wide mov-
provided by Taqqu et al. (1995) and Montanari et al. (1997).           ing average filter. Intuition suggests that anomalous events
In the present work we preferred to focus on variability anal-         observed in a given day of the year should not impact what
ysis and therefore applied the analysis of the variance method         will occur on the same day in subsequent years, and therefore
(Koutsoyiannis, 2003). In detail, the method investigates the          we expected to obtain slopes close to −1. Figure 9 shows that
variability of the time series obtained by aggregating the ob-         the results did not confirm such preliminary expectation.
served river flow over time periods of increasing extension. It           In fact, most of the slope values are lower than −1, which
can be shown that, for independent data, the variance rescales         implies the presence of anti-persistence, with the exception
after aggregation according to the relationship (Taqqu et al.,         of the March–April period for which positive correlation is

www.hydrol-earth-syst-sci.net/16/3739/2012/                                        Hydrol. Earth Syst. Sci., 16, 3739–3747, 2012
3746 A. Montanari: Changing patterns in Po River discharge
found, which could be induced by the presence of the spring and a pragmatic planning of future strategies. In fact, an in-
peak during some windows of the observation period. Over- complete understanding of the natural river flow regime pre-
all, Fig. 9 shows the presence of singularities for which a vents one to gain a reliable assessment of the human impact
physical interpretation is not readily available, which should and to devise efficient mitigation plans for natural risks. The
be investigated with more detail. In fact, they have significant unavoidable presence of uncertainty suggests the opportunity
practical implications for water resources management. to give high priority to no-regret strategies of reduced envi-
ronmental impact (Wilby and Dessay, 2010).
4 Conclusions
Supplementary material related to this article is
The analysis of the variability of mean daily flow series ob- available online at: http://www.hydrol-earth-syst-sci.net/
served along the Po River and some tributaries highlights 16/3739/2012/hess-16-3739-2012-supplement.zip.
the presence of local fluctuations of water scarcity and abun-
dance that last for several years. They seem to be originated
by perturbations whose memory is maintained in the long Acknowledgements. The author wishes to thank Giovanni Semi-
term. Likewise, statistical analyses confirm that the river flow nara for providing useful advice, and Silvano Pecora, Francesco
series seem to be affected by long-term persistence, whose Laio and Daniele Ganora for kindly providing the data series. An
intensity increases for increasing catchment size. The above anonymous Referee and Demetris Koutsoyiannis are gratefully
results show that the long-term behaviours of the Po River acknowledged for their comments on an earlier version of the paper.
flows are not easily decipherable. Traditional methods for This work has been partially supported by the Italian government
trend detection could be inadequate for interpreting patterns through the grant “Uncertainty estimation for precipitation and
that seem to be far more complex than monotonic tendencies. river discharge data. Effects on water resources planning and flood
In fact, the picture emerges of a hydrological system that is risk management”.
affected by local patterns that are likely to be related to natu-
Edited by: F. Laio
ral climate variability, even if one cannot exclude more com-
plex interpretations that could refer to the intrinsic dynam-
ics of the rainfall-runoff transformation. Similar phenomena
References
were detected in other major rivers all over the world (Mon-
tanari et al., 1997; Montanari, 2003; Grimaldi, 2004). The Autorità di Bacino del Fiume Po: Behaviours of the Po River catch-
literature has not proposed a convincing physical explana- ment and first investigation of the impact of human activities on
tion for such behaviours so far (Mudelsee, 2007). Yet, their water resources, 2006 (in Italian).
implications in water resources management are potentially Bloeschl, G. and Montanari, A.: Climate change impacts: throwing
very relevant; inasmuch, they imply the above occurrence of the dice?, Hydrol. Proc., 24, 374–381, 2010.
long periods of water abundance and scarcity. These phe- Cohn, T. A. and Lins, H. F.: Nature’s style: Naturally trendy, Geo-
nomena have been called “Noah Effect” and “Joseph Effect” phys. Res. Lett., 32, L23402, doi:10.1029/2005GL024476, 2005.
by Mandelbrot and Wallis (1968). Grimaldi, S.: Linear parametric models applied on daily hydrologi-
The above summary puts in evidence that more research cal series, J. Hydrol. Eng., 9, 383–391, 2004..
Grimaldi, S. and Montanari, A.: On techniques for estimating the
efforts are needed to improve the interpretation of such long-
seasonal components of daily hydrological data, in: Proceedings
term fluctuations. The links between local patterns in river
of the XXVII National Conference on Hydraulics and Hydraulic
flows and weather variables, like rainfall and atmospheric Works, Genoa, 12–15 September 2000, Vol. II, 237–244, CNR-
pressure, should be better investigated to improve our pre- GNDCI, Genoa, 2000 (in Italian).
diction capabilities of future critical situations. Such analyses Hurst, H. E.: Long Term Storage Capacity of Reservoirs, T. Am.
are indeed complicated for the uncertainty related to the esti- Soc. Civ. Eng., 116, 770–799, 1951.
mation of mean areal values for the above weather variables. Koutsoyiannis, D.: Climate change, the Hurst phenomenon, and hy-
However, they are definitely worth attempting, because a bet- drological statistics, Hydrol. Sci. J., 48, 3–24, 2003.
ter understanding of hydrological dynamics would allow us Koutsoyiannis, D.: HESS Opinions “A random walk on water”,
to gain very interesting insights into natural variability and Hydrol. Earth Syst. Sci., 14, 585–601, doi:10.5194/hess-14-585-
its incidence with respect to human-induced changes (Mon- 2010, 2010.
Koutsoyiannis, D. and Montanari, A.: Statistical analysis of hy-
tanari and Koutsoyiannis, 2012). In fact, for the Po River flu-
droclimatic time series: Uncertainty and insights, Water Resour.
vial regime the human impact is not as clearly emerging as
Res., 43, W05429, doi:10.1029/2006WR005592, 2007.
the above temporary tendencies. Koutsoyiannis, D., Makropoulos, C., Langousis, A., Baki, S., Ef-
The present work highlights that the identification of opti- stratiadis, A., Christofides, A., Karavokiros, G., and Mamassis,
mal water resources management policies, which are needed N.: HESS Opinions: “Climate, hydrology, energy, water: rec-
to support sustainable development planning, must necessar- ognizing uncertainty and seeking sustainability”, Hydrol. Earth
ily be based on the identification of the scientific priorities Syst. Sci., 13, 247–257, doi:10.5194/hess-13-247-2009, 2009.
Hydrol. Earth Syst. Sci., 16, 3739–3747, 2012 www.hydrol-earth-syst-sci.net/16/3739/2012/A. Montanari: Changing patterns in Po River discharge 3747 Koutsoyiannis, D., Paschalis, A., and Theodoratos, N.: Two- Mudelsee, M.: Long memory of rivers from spatial aggregation, dimensional Hurst-Kolmogorov process and its application to Water Resour. Res., 43, W01202, doi:10.1029/2006WR005721, rainfall fields, J. Hydrol., 398, 91–100, 2011. 2007. Mandelbrot, B. B. and Wallis, J. R.: Noah, Joseph, and Taqqu, M. S., Teverovski, V., and Willinger, W.: Estimators for lon- Operational Hydrology, Water Resour. Res., 4, 909, grange dependence: an empirical study, Fractals, 3, 785–798, doi:10.1029/WR004i005p00909, 1968. 1995. Marchi, E.: Hydraulic aspects of the Po River flood occurred in Piccoli, A.: The most important floods of the Po River from 1900 to 1951, in: Proceedings of the XVII Conference on Historical 1970, Accademia Nazionale dei Lincei, Rome, 1976 (in Italian). Studies, Rovigo, 2–24 November 1991, Minnelliana Editions, Visentini, M.: The latest floods of the Po River, in: Proceedings of Rovigo, 1994 (in Italian). the XVIII International Conference on Navigation, Rome, 1953. Montanari, A.: Long range dependence in hydrology, in: The- Wasson, J.-G., Chandesris, A., Pella, H., and Blanc, L.: Typology ory and Applications of Long-Range Dependence, edited by: and reference conditions for surface wtaer bodies in France - The Doukhan, P., Oppenheime, M. S., and Taqqu, G., Birkhauser, hydro-ecoregion approach, in Typology and ecological classifi- Boston, 461–472, 2003. cation of lake and rivers, edited by: Ruoppa, M. and Karttunen, Montanari, A. and Koutsoyiannis, D.: A blueprint for process-based K., TemaNord, Helsinki, 37–41, 1996. modeling of uncertain hydrological systems, Water Resour. Res., Wilby, L. R. and Dessay, S.: Robust adaptation to climate change, 48, W09555, doi:10.1029/2011WR011412, 2012. Weather, 65, 180–185, 2010. Montanari, A., Rosso, R., and Taqqu, M. S.: Fractionally differ- Zanchettini, D., Traverso, P., and Tomasino, M.: Po River dis- enced ARIMA models applied to hydrologic time series: identifi- charge: a preliminary analysis of a 200-year time series, Climatic cation, estimation and simulation, Water Resour. Res., 33, 1035– Change, 88, 411–433, doi:10.1007/s10584-008-9395-z, 2008. 1044, 1997. Montanari, A., Taqqu, M. S., and Teverovsky, V.: Estimating long- range dependence in the presence of periodicity: an empirical study, Math. Comput. Model., 29, 217–228, 1999. www.hydrol-earth-syst-sci.net/16/3739/2012/ Hydrol. Earth Syst. Sci., 16, 3739–3747, 2012
You can also read