A Review of Indian Mobile Phone Sector - Akash C.Mathapati, Dr.K Vidyavati - IOSR Journal
←
→
Page content transcription
If your browser does not render page correctly, please read the page content below
IOSR Journal of Business and Management (IOSR-JBM)
e-ISSN: 2278-487X, p-ISSN: 2319-7668. Volume 20, Issue 2. Ver. II (February. 2018), PP 08-17
www.iosrjournals.org

                         A Review of Indian Mobile Phone Sector
                                     Akash C.Mathapati, Dr.K Vidyavati
Assistant Professor, Department of Management Studies, Dr.P G Halakatti College of Engineering, Vijayapura
          Professor, MBA Department, Sahyadri College of Engineering & Management, Mangaluru
                                Corresponding Author: Akash C.Mathapati,

Abstract: The Paper Has Attempted To Understand The Indian Mobile Handset Overview, Market Size,
Competitive Landscape With Some Of The Category Data. Also Some Relevant Studies On Indian Mobile
Handset And Its Global Comparison Have Been Focused With The Impact On Economy And Society.
Keywords: India, Mobile handsets, market size, Global Comparisons, GSM
---------------------------------------------------------------------------------------------------------------------------------------
Date of Submission: 15-01-2018                                                                  Date of acceptance: 09-02-2018
-------------------------------------------------------------------------------------------------------------------------------------

                                                     I.      Introduction
          India is currently the 2nd second-largest telecom market and has registered strong growth in the past
decade and a half. The Indian mobile economy is growing quickly and will contribute extensively to India’s
Gross Domestic Product (GDP), according to report prepared by GSM Association (GSMA) in association with
the “Boston Consulting Group” (BCG).
          The direct and reformist strategies of the GoI have been instrumental alongside solid customer request
in the quick development in the Indian telecom division. The administration has empowered simple market
section to telecom gear and a proactive administrative and reasonable structure that has guaranteed openness of
telecom administrations to the customer at sensible costs. The deregulation of "Outside Direct Investment"
(FDI) standards has made the segment one of the top developing and a main 5 business opportunity maker in the
nation.
          The Indian telecom segment is probably going to create 4 million immediate and roundabout business
openings throughout the following 5 years as indicated by figures made by Randstad India. The employments
are relied upon to be made because of the mix of government's endeavors to build entrance in provincial zones
and the quick increment in cell phone deals and high web utilization.
          "Worldwide Data Corporation" (IDC) predicts India to go past the US as the second biggest cell phone
showcase all inclusive by 2017 and to proceed with high development rate throughout the following couple of
years as individuals change to cell phones and relentlessly move up to 4G.

Market Size
         Driven by solid acknowledgment of information utilization on handheld gadgets, the whole portable
administrations showcase income in India is relied upon to touch 37 billion USD in 2017, enlisting a 5.2 for
each penny (CAGR) in the vicinity of 2014 and 2017, as indicated by research firm IDC.
         India is required to have more than 180 million cell phones by 2019, contributing around 13.5 for every
penny to the worldwide cell phones advertise, in light of rising moderateness and better accessibility of
information administrations among different elements. According to a report by top Market research firm, the
Indian telecom services market will likely grow by 10.3 per cent YoY to reach 103.9 billion USD by 2020.
According to a report by Ericsson Mobility Report India, mobile phones subscriptions in India is expected to
increase four-fold to 810 million users by 2021, while the total mobile phones traffic is expected to grow 17 fold
to 4.2 Exabytes (EB) per month by 2021.
         According to a study by GSMA, mobile phones are expected to account for 2 out of every 3 mobile
connections globally by 2020 making India the fourth largest mobile phones market. Total number of 4G
enabled mobile phones shipments in India stood at 13.9 million units in the quarter ending Dec 2015, which was
more than 50% of total shipments, thereby surpassing number of Third-Generation (3G) enabled mobile phones
shipments for the first time. Broadband services user-base in India is likely to grow to 250 million connections
by 2017.

DOI: 10.9790/487X-2002020817                                       www.iosrjournals.org                                      8 | Page
A REVIEW OF INDIAN MOBILE PHONE SECTOR
II. The India Mobile Handset Overview
2015, has seen some tectonic industry. We kept on observing passage of new brands and the
development of arrangement of existing ones. From a leap forward perspective, there wasn't anything
noteworthy aside from that Samsung's dispatch of the bended plan (Edge arrangement) and Apple's IPhone 6S
and 6S Plus with 3D touch usefulness. Both the advancements occurred in the excellent portion (> Rs.50,000),
which in India is only 0.6% (Percentage of Unit Shipments) of the market.
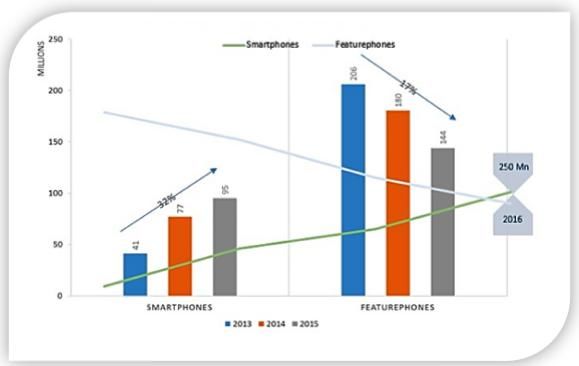
Figure 1.1 : India mobile phone versus Feature phones, 2013-2015
Source: CRM (Cyber Media Research Report, 2016)
Along these lines, while it has been on numerous occasions demonstrated India is a low to medium
estimated handsets showcase, 2015, has not added some awesome capabilities to client encounter. In any case,
the industry has possessed the capacity to offer more to a client for same or even less. Episodically, the ASP
(Average Selling Price) for a Mobile telephone in 2013 was Rs.13,000 (vol: 41 mn units), which has come down
to Rs.10,700 (vol: 95 mn units) before the finish of 2015. In the meantime, the determinations of a Mobile
telephone have enhanced generously. In 2013, just 0.07% of Mobile telephones delivered had 4GB RAM for
example, which in 2015, was somewhat more than 0.6%. Also, other real details that trigger the purchaser's
choice to buy a Mobile telephone have enhanced while ASPs displayed a subsiding pattern.
Cell phones kept on indicating strength and developed at a yearly normal development of 32% while
Feature telephones kept on contracting. The decrease in highlight telephone shipments was 17% on a yearly
normal premise. An examination of the present situation, combined with an investigation of chronicled patterns
reveals to us that the market for India portable handsets industry will settle around 250 mn units in 2016, a
simple 4% development contrasted with 2015. The standpoint appears recommend that this pattern will proceed
for a couple of more years, as we move towards a 'Cell phones just' market; this is on account of the anticipated
end of Feature telephones does not appear to be likely at whatever time soon.
Mobile Phones in India
Volume sales of feature phones witness a decline of 17% in 2016 to 98.7 million units
Increasing popularity of mobile phones underpins decline in demand for feature phones in India
Volume sales of mobile phones grow by 27% in 2016 to 102.4 million units
Samsung India Electronics Pvt Ltd maintains its leadership position in mobile phones with a 26% volume
share in 2016
With decreasing unit prices for mobile phones, consumers are shifting from feature phones to mobile
phones
Volume sales of mobile phones are expected to post a CAGR of 7% over the forecast period to reach 277.4
million units by 2021
DOI: 10.9790/487X-2002020817 www.iosrjournals.org 9 | PageA REVIEW OF INDIAN MOBILE PHONE SECTOR TRENDS Volume sales of mobile phones grew by 1% in 2016, driven entirely by the increase in demand for mobile phones. With an increasing number of manufacturers in the mobile phone category, prices of mobile phones have been declining. With falling prices of mobile phones, consumers have started replacing devices such as tablets, portable media players and cameras with mobile phones. Mobile phones remained the fastest growing category under mobile phones in 2016. Volume sales of mobile phones grew by 27% in 2016 to reach 102.4 million units. Mobile phones provide multiple options including but not limited to taking photographs, playing audio and video files, storing data, playing games, internet connectivity etc. Instead of using multiple devices, consumers are replacing their existing devices with mobile phones. In terms of operating systems, Android accounted for 96% of volume sales in 2016 followed by iOS with just 3%. Android-running mobile phones are available across all price ranges and are highly customisable compared to iOS devices. The Android operating system also allows users the option of installing third party apps unlike Apple. iOS is only used on Apple devices and Apple phones are very expensive and targeted at a smaller consumer base. Rural India accounted for 40% of mobile phone volume sales in India in 2016. The number of electronics and appliance specialist stores in rural India is on the rise which is increasing the demand for mobile phones. Most consumers in rural India tend to buy mobile phones when they visit cities or tell their friends or relatives working in cities to send them a mobile phone. The penetration rate for mobile phones increased from 66.3% in 2015 to 88.3% in 2016 and at the same time the penetration rate of feature phones decreased from 153% in 2015 to 116% in 2016. Many manufacturers have started entering the mobile phones category in India and as a result prices of mobile phones are in decline. With falling prices of mobile phones, consumers have started replacing their feature phones with mobile phones. The share of mobile phones with a screen size from 4.7 inch - 5.49 inch increased from 32% in 2015 to 35% in 2016. In addition, demand for mobile phones with a screen size of more than 5.5 inches is also on the rise. With greater numbers of larger-screen mobile phones introduced onto the market, consumers are replacing their tablets with larger-screen mobile phones. The average price of a mobile phone in India declined from INR9,268 in 2015 to INR9,006 in 2016. Every year a large number of new mobile models are introduced and prices of these products are expected to drop to sustain demand. In India, most consumers use pre-paid mobile services as these can be recharged as per consumers’ needs. In this way, customers can change recharge plans frequently based on their usage and availability of money. Post-paid mobile services are typically used by working professionals and they tend to spend more compared to pre-paid users. Electronics and appliance specialist retailers accounted for 79% of volume sales of mobile phones in 2016. The internet retailing share increased from almost 15% in 2015 to over 18% in 2016. Internet retailers are offering heavy discounts and also exchange offers which are encouraging consumers to buy from online retailers. COMPETITIVE LANDSCAPE Samsung India Electronics Pvt Ltd maintained its leadership position in feature phones with a 28% volume share in 2016. The company’s share improved from 23% in 2015. With manufacturers sinking production due to falling demand, Samsung was able to see growth in its sales due to enhanced customer service and higher brand value. Samsung India Electronics Pvt Ltd also led sales of mobile phones in India with a volume share of almost 25% in 2016. Apple India Pte Ltd saw a 40% jump in sales in 2016 to reach 2.8 million units. The company launched the iPhone 6 and iPhone 6s, which were well received by consumers. With these new launches there was also a drop in the price of the Apple iPhone 5, adding to the demand. Sales of mobile phones in India are equally dominated by national and international brands. Among the international players, Samsung India Electronics Pvt Ltd, Lenovo India Pvt Ltd and Xiaomi Technology India Pvt Ltd led the market. Domestic players such as “Micromax Informatics Ltd”, Intex Technologies (India) Ltd and Lava International Ltd saw good growth in their sales. Reliance Industries and Idea Cellular have become the second and third players, respectively, to launch 4G services in India after Bharti Airtel Limited. With this the prices of 4G services are expected to come down, increasing demand for 4G mobile phones in the country. DOI: 10.9790/487X-2002020817 www.iosrjournals.org 10 | Page
A REVIEW OF INDIAN MOBILE PHONE SECTOR
PROSPECTS
Declining unit prices for larger-screen mobiles are expected to drive demand for mobile phones in India
over the forecast period. With more larger-screen mobile phones available at economical prices and better
specification, consumers will slowly start replacing their tablets with mobile phones, pouring demand for
mobile phones in the country
Volume sales of mobile phones in India are expected to post a CAGR of 18% over the forecast period to
reach 231.5 million units by 2021.
On the other hand, demand for feature phones is expected to decline, with a negative CAGR of 14% over
the forecast period, taking sales to 45.9 million units by 2021. With mobile phone prices falling, consumers
are replacing their feature phones with mobile phones. Having said that, there are many uneducated people
in India who do not know how to use mobile phones and will continue to use feature phones and this will
drive demand for feature phones over the forecast period.
The penetration rate for feature phones is expected to decrease from 117% in 2016 to 90% in 2017. The
limited demand for feature phones is expected to be driven by people in rural India and also people who are
economically disadvantaged.
In contrast to feature phones, the penetration rate for mobile phones is expected to increase from 85% in
2016 to 107% in 2017, which will be driven by decreasing unit prices for mobile phones.
The replacement cycle for mobile phones is expected to remain at 22 months during the forecast period.
People spend a large sum of money on a mobile phone and expect to use the product until damaged or new
technology is available at an affordable price.
Rural India’s share of retail volume sales of mobile phones is expected to increase from 40% in 2016 to
46% in 2021. Increasing availability of mobile phones in rural India is likely to drive demand
for mobile phones in these areas.
Mobile phones are having a negative impact on sales of tablets. With more larger-screen mobile
phones introduced onto the market and at cheaper prices, demand for tablets is expected to decline over the
forecast period.
Android will continue to dominate mobile phone volume sales in terms of operating system during the
forecast period.
CATEGORY DATA
Table 1.1 Sales of Mobile Phones by Rural vs Urban: % Retail Volume 2016-2021
% retail volume 2016 2017 2018 2019 2020 2021
Rural 40 41 42 43 44 46
Urban 60 59 58 57 56 54
Total 100 100 100 100 100 100
Source: “Euromonitor International from official statistics, trade associations, trade press, company research,
store checks, trade interviews, trade sources”
Table 1.2 Sales of Mobile Phones by Category: Volume 2011-2016
'000 units 2011 2012 2013 2014 2015 2016
Feature Phones 172,052.3 206,462.7 207,082.1 146,278.0 118,229.8 98,721.9
Mobile phones 11,201.6 16,197.6 44,008.8 62,328.0 80,609.1 102,362.5
Mobile Phones 183,253.9 222,660.3 251,090.9 208,606.0 198,838.9 201,084.4
Source: Euromonitor International from official statistics, trade associations, trade press, company research,
store checks, trade interviews, trade sources
Table 1.3 Sales of Mobile Phones by Category: Value 2011-2016
INR bn 2011 2012 2013 2014 2015 2016
Feature Phones 815.0 929.1 838.9 543.4 408.9 328.6
Mobile phones 153.7 195.8 451.8 601.4 747.2 922.0
Mobile Phones 968.7 1,124.9 1,290.7 1,144.8 1,156.1 1,250.5
Source: Euromonitor International from official statistics, trade associations, trade press, company research,
store checks, trade interviews, trade sources
Table 1.4 Sales of Mobile Phones by Category: % Volume Growth 2011-2016
% volume growth 2015/16 2011-16 CAGR 2011/16 Total
Feature Phones -16.5 -10.5 -42.6
DOI: 10.9790/487X-2002020817 www.iosrjournals.org 11 | PageA REVIEW OF INDIAN MOBILE PHONE SECTOR
% volume growth 2015/16 2011-16 CAGR 2011/16 Total
Mobile phones 27.0 55.7 813.8
Mobile Phones 1.1 1.9 9.7
Source: Euromonitor International from official statistics, trade associations, trade press, company research,
store checks, trade interviews, trade sources
Table 1.5 Sales of Mobile Phones by Category: % Value Growth 2011-2016
% current value growth 2015/16 2011-16 CAGR 2011/16 Total
Feature Phones -19.7 -16.6 -59.7
Mobile phones 23.4 43.1 499.8
Mobile Phones 8.2 5.2 29.1
Source: Euromonitor International from official statistics, trade associations, trade press, company research,
store checks, trade interviews, trade sources
Table 1.6 Sales of Mobile Phones by Type of Contract: % Retail Volume 2011-2016
% retail volume 2011 2012 2013 2014 2015 2016
Monthly Subscription 2.0 1.5 1.0 0.8 0.6 0.4
Pay as You Go 0.3 0.2 0.1 - - -
Phone Only 97.7 98.3 98.9 99.2 99.4 99.6
Total 100.0 100.0 100.0 100.0 100.0 100.0
Source: Euromonitor International from official statistics, trade associations, trade press, company research,
store checks, trade interviews, trade sources
Table 1.7 Sales of Mobile phones by Operating System: % Retail Volume 2011-2016
% retail volume 2011 2012 2013 2014 2015 2016
Windows 4.5 2.6 3.5 4.8 3.0 1.4
iOS 2.4 2.8 3.5 2.2 2.5 2.7
Android 40.9 65.3 87.8 92.7 94.3 95.8
Symbian 32.7 16.5 4.4 - - -
BlackBerry OS 9.2 5.6 0.8 0.4 0.2 0.0
Other 10.3 7.2 - - - -
Total 100.0 100.0 100.0 100.0 100.0 100.0
Source: Euromonitor International from official statistics, trade associations, trade press, company research,
store checks, trade interviews, trade sources
Table 1.8 Sales of Mobile phones by Screen Size: % Retail Volume 2016
% retail volume 2016
= 5.5 inch 12.0
Total 100.0
Source: Euromonitor International from official statistics, trade associations, trade press, company research,
store checks, trade interviews, trade sources
Table 1.9 NBO Company Shares of Mobile Phones: % Volume 2012-2016
% retail volume 2012 2013 2014 2015 2016
Samsung India Electronics Pvt Ltd 13.8 23.8 19.3 24.0 26.3
Micromax Informatics Ltd 6.6 11.8 15.2 14.4 14.8
Lava International Ltd 5.3 6.5 7.2 10.6 11.6
Intex Technologies (India) Ltd 1.5 2.6 4.9 10.7 11.6
Karbonn Mobile India Pvt Ltd 7.7 9.0 9.1 6.2 4.5
Lenovo India Pvt Ltd - 0.2 0.7 2.0 2.6
Microsoft Corp (India) Pvt Ltd - - 11.5 6.7 2.3
Xiaomi Technology India Pvt Ltd - - 0.4 1.4 1.7
DOI: 10.9790/487X-2002020817 www.iosrjournals.org 12 | PageA REVIEW OF INDIAN MOBILE PHONE SECTOR
% retail volume 2012 2013 2014 2015 2016
Gionee Communication Equipment Co Ltd 1.5 1.8 2.0 1.7 1.6
Apple India Pte Ltd 0.2 0.6 0.6 1.0 1.4
Celkon Impex Pvt Ltd 1.0 1.7 1.6 1.4 1.4
Maxx Moblink Pvt Ltd 1.8 2.8 2.0 1.4 1.4
Spice Mobility Ltd 2.9 2.3 2.2 1.5 1.2
LG Electronics India Pvt Ltd 6.0 5.0 3.1 1.7 0.9
Best IT World (India) Pvt Ltd 0.3 0.3 0.4 0.8 0.9
Sony India Pvt Ltd 3.7 1.2 1.2 1.0 0.8
ZTE Corp 1.3 0.9 0.9 0.8 0.6
Videocon Industries Ltd 1.4 2.3 1.8 1.2 0.6
High Tech Computer Corp 0.1 0.1 0.1 0.1 0.1
Motorola India Pvt Ltd 0.8 1.1 0.5 0.1 0.1
Huawei Technologies Co Ltd 0.7 0.2 0.1 0.1 0.1
Kyocera Wireless India 0.1 0.1 0.1 0.1 0.0
Research in Motion Ltd 0.4 0.1 0.1 0.1 0.0
Nokia India Pvt Ltd 21.8 16.7 - - -
Pantech&Curitel Communications Inc - - - - -
Sony Ericsson Mobile Communications AB - - - - -
Others 21.1 8.8 15.0 11.2 13.4
Total 100.0 100.0 100.0 100.0 100.0
Source: Euromonitor International from official statistics, trade associations, trade press, company research,
store checks, trade interviews, trade sources
Table 1.10 LBN Brand Shares of Mobile Phones: % Volume 2013-2016
% retail volume Company (NBO) 2013 2014 2015 2016
Samsung (Samsung Corp) Samsung India Electronics Pvt Ltd 23.8 19.3 24.0 26.3
Micromax Micromax Informatics Ltd 11.8 15.2 14.4 14.8
Intex Intex Technologies (India) Ltd 2.6 4.9 10.7 11.6
Lava Lava International Ltd 6.0 6.3 10.2 11.2
Karbonn Karbonn Mobile India Pvt Ltd 9.0 9.1 6.2 4.5
Lenovo (Lenovo Group Ltd) Lenovo India Pvt Ltd 0.2 0.7 2.0 2.6
Nokia (Microsoft Corp) Microsoft Corp (India) Pvt Ltd - 11.5 6.7 2.3
Xiaomi (Xiaomi Inc) Xiaomi Technology India Pvt Ltd - 0.4 1.4 1.7
Gionee (Shenzhen Gionee Communication Equipment Co Gionee Communication Equipment Co
Ltd) Ltd 1.8 2.0 1.7 1.6
iPhone (Apple Inc) Apple India Pte Ltd 0.6 0.6 1.0 1.4
Celkon CelkonImpex Pvt Ltd 1.7 1.6 1.4 1.4
Maxx Maxx Moblink Pvt Ltd 2.8 2.0 1.4 1.4
Spice (Spice Group) Spice Mobility Ltd 2.3 2.2 1.5 1.2
LG (LG Corp) LG Electronics India Pvt Ltd 5.0 3.1 1.7 0.9
iBall Best IT World (India) Pvt Ltd 0.3 0.4 0.8 0.9
Sony (Sony Corp) Sony India Pvt Ltd 1.2 1.2 1.0 0.8
ZTE ZTE Corp 0.9 0.9 0.8 0.6
Videocon Videocon Industries Ltd 2.3 1.8 1.2 0.6
Xolo Lava International Ltd 0.6 0.9 0.4 0.4
HTC (HTC Corp) High Tech Computer Corp 0.1 0.1 0.1 0.1
Motorola (Lenovo Group Ltd) Motorola India Pvt Ltd - 0.5 0.1 0.1
Huawei Huawei Technologies Co Ltd 0.2 0.1 0.1 0.1
Kyocera (Kyocera Corp) Kyocera Wireless India 0.1 0.1 0.1 0.0
Blackberry (BlackBerry Ltd) Research in Motion Ltd 0.1 0.1 0.1 0.0
Nokia (Nokia Corp) Nokia India Pvt Ltd 16.7 - - -
Motorola (Google Inc) Motorola India Pvt Ltd 1.1 - - -
Motorola (Motorola Inc) Motorola India Pvt Ltd - - - -
DOI: 10.9790/487X-2002020817 www.iosrjournals.org 13 | PageA REVIEW OF INDIAN MOBILE PHONE SECTOR
% retail volume Company (NBO) 2013 2014 2015 2016
Motorola (Motorola Mobility Inc) Motorola India Pvt Ltd - - - -
Pantech (Pantech Group) Pantech&Curitel Communications Inc - - - -
Blackberry Research in Motion Ltd - - - -
Others Others 8.8 15.0 11.2 13.4
Total Total 100.0 100.0 100.0 100.0
Source: Euromonitor International from official statistics, trade associations, trade press, company research,
store checks, trade interviews, trade sources
Table 1.11 Distribution of Mobile Phones by Channel: % Volume 2011-2016
% retail volume 2011 2012 2013 2014 2015 2016
Store-Based Retailing 97.5 96.4 94.5 90.0 85.3 81.7
- Grocery Retailers 2.0 2.2 2.3 2.6 2.8 2.9
-- Discounters - - - - - -
-- Hypermarkets 2.0 2.2 2.3 2.6 2.8 2.9
-- Supermarkets - - - - - -
-- Other Grocery Retailers - - - - - -
- Non-Grocery Specialists 95.5 94.2 92.2 87.4 82.5 78.8
-- Electronics and Appliance Specialist Retailers 95.5 94.2 92.2 87.4 82.5 78.8
--- Telco-Operated Stores 1.2 1.4 1.1 0.8 0.5 0.3
--- Other Electronics and Appliance Specialist Retailers 94.2 92.8 91.0 86.7 82.0 78.5
-- Mixed Retailers - - - - - -
-- Other Non-Grocery Specialists - - - - 0.0 -
Non-Store Retailing 2.5 3.6 5.5 10.0 14.7 18.3
- Direct Selling - - - - - -
- Home shopping - - - - - -
- Internet Retailing 2.5 3.6 5.5 10.0 14.7 18.3
Total 100.0 100.0 100.0 100.0 100.0 100.0
Source: Euromonitor International from official statistics, trade associations, trade press, company research,
store checks, trade interviews, trade sources
Table 1.12 Forecast Sales of Mobile Phones by Category: Volume 2016-2021
'000 units 2016 2017 2018 2019 2020 2021
Feature Phones 98,721.9 83,518.7 71,158.0 61,053.5 52,750.3 45,892.7
Mobile phones 102,362.5 126,232.1 151,667.1 178,073.9 204,864.6 231,496.9
Mobile Phones 201,084.4 209,750.8 222,825.1 239,127.4 257,614.8 277,389.7
Source: Euromonitor International from trade associations, trade press, company research, trade interviews,
trade sources
Table 1.13 Forecast Sales of Mobile Phones by Category: Value 2016-2021
INR bn 2016 2017 2018 2019 2020 2021
Feature Phones 328.6 257.1 203.7 163.3 132.3 108.0
Mobile phones 922.0 1,057.5 1,187.6 1,311.1 1,425.1 1,522.0
Mobile Phones 1,250.5 1,314.6 1,391.3 1,474.3 1,557.4 1,630.0
Source: Euromonitor International from trade associations, trade press, company research, trade interviews,
trade sources
Table 1.14 Forecast Sales of Mobile Phones by Category: % Volume Growth 2016-2021
% volume growth 2016/17 2016-21 CAGR 2016/21 Total
Feature Phones -15.4 -14.2 -53.5
Mobile phones 23.3 17.7 126.2
Mobile Phones 4.3 6.6 37.9
Source: Euromonitor International from trade associations, trade press, company research, trade interviews,
trade sources
DOI: 10.9790/487X-2002020817 www.iosrjournals.org 14 | PageA REVIEW OF INDIAN MOBILE PHONE SECTOR
Table 1.15 Forecast Sales of Mobile Phones by Category: % Value Growth 2016-2021
% constant value growth 2016/2017 2016-21 CAGR 2016/21 TOTAL
Feature Phones -21.7 -20.0 -67.1
Mobile phones 14.7 10.5 65.1
Mobile Phones 5.1 5.4 30.3
Source: Euromonitor International from trade associations, trade press, company research, trade interviews,
trade sources
Table 1.16 Forecast Sales of Mobile phones by Operating System: % Retail Volume 2016-2018
% retail volume 2015 2016 2017
Windows 3.0 1.4 0.5
iOS 2.5 2.7 3.0
Android 94.3 95.8 96.5
Symbian - - -
BlackBerry OS 0.2 0.0 -
Other - - -
Total 100.0 100.0 100.0
Source: Euromonitor International from trade associations, trade press, company research, trade interviews,
trade sources
Table 1.17 Forecast Sales of Mobile phones by Screen Size: % Retail Volume 2016-2021
% retail volume 2016 2017 2018 2019 2020 2021
= 5.5 inch 12.0 14.0 16.0 17.0 18.0 19.0
Total 100.0 100.0 100.0 100.0 100.0 100.0
Source: Euromonitor International from trade associations, trade press, company research, trade interviews,
trade sources
III. Review of Relevant Studies on Indian Mobile Handset Sector
The competitiveness of Indian mobile hand set sector is very broad multi-dimensional concept that
holds numerous aspects such as quality, price, technology, efficiency and macro-economic environment.
In this section, various studies on the Indian mobile hand set sector are reviewed, under different heads
pertaining to competitiveness, namely, global comparisons, on- going technology, Revenue and investment
trends, Mobile contributing to jobs and economic growth, Employment and public funding, Contribution to
public funding and Outlook and trends for 2016−2020 of Indian Mobile handset sector
Global Comparisons
As stated by GSMA’s “The Mobile Economy Report” (2017), two-thirds of the world’s number at
that point required A membership with portable by those wind from claiming 2016, what added up to 4. 8
billion selective subscribers. There may be a self-evident geographic shift underway, for APAC area set will
represent two-thirds of the 860 million new subscribers needed Comprehensively Toward those wind of the
decade. Toward 2020, Practically three-quarters of the world’s people – alternately 5. 7 billion people, will
subscribe to portable benefits. Those estimates about territorial infiltration rates might go from 87% On Europe
to half On sub-Saharan Africa. Ten nations will represent 72% of Growth On new mobile subscribers around
the world. There is an acceptable geographic movement done progress, with Asia situated on represent two-
thirds of the incremental membership Growth through the estimated time. India, as of now the world’s second-
biggest portable market, will make those enter driver for this growth, for 310 million new select subscribers
required in the period with 2020, aided Toward enhancing technology, affordability, bring down gadget costs
What's more superior organise scope. This is trailed towards China and fast-growth Asian business sectors
including Indonesia, Pakistan Furthermore Bangladesh.
GSMA (2017) examination says that there were 3. 8 billion cell phone associations during the
conclusion for 2016, helping to A large portion about downright associations around the world (excluding
M2M). Acknowledgement rates need to top 65% of the joined build over created businesses. Similarly as with
membership growth, Creating business sectors What's more especially Asia may be driving the present period
of cell phone Growth. In Creating business sectors cell telephone subscriptions arrived at 47% of the aggregate
build at the wind for 2016 and would forecast on scope dependent upon 62% Toward 2020. Done general,
DOI: 10.9790/487X-2002020817 www.iosrjournals.org 15 | PageA REVIEW OF INDIAN MOBILE PHONE SECTOR
Asia-Pacific district will represent half of the 1. 9 billion new cell telephone subscriptions conjecture
Comprehensively by 2020. India surpassed us should get the second biggest cell phone showcase on 2016,
with 347 million cell telephone associations. India will representable simply bashful of one-fifth for new
wireless memberships universally in the 4 quite some time will 2020; its wireless build will twofold on 686
million through those time. Moderateness may be getting to be Lesquerella of a boundary should cell telephone
selection Likewise incomes climb Also there is proceeded development for sub-$100 devices, headed by
Chinese makers, for example, Oppo, OnePlus, Huawei, Also Xiaomi. Same time China, Japan and South
Korea need being those customary cell telephone manufacturing hubs Previously, Asia Pacific region, nearby
Makers would also pick up importance to India, Indonesia and the Philippines.
Ongoing Technology shift
The generational (2G, 3G, 4G & 5G) move will versant broadband frameworks through that world
continues picking dependent upon catalyst, driven Toward an improved extent for higher pace systems, every
last one of All the more alluringly esteemed majority of the data levies What's more noticeable approachability
What's more sensibility for cell phones. In the wind from claiming 2012, versatile broadband associations (3G
Also 4G technology) accounted for a quarter about downright associations (excluding M2M). This enhanced on
55% eventually Tom's perusing the limit for 2016, with 4 billion mobile broadband associations.
An extra to existing 2.3 billion portable broadband associations is gage the middle of 2016 Furthermore
2020, with those rate of the aggravator rising with 73%. The quick development with 4G stayed a magic part
over 2016, for 4G associations stretching 55% in the quite a while should 1. 7 billion. To sure, those degrees of
4G associations around the world may guess will extremely about twofold the middle of 2016 Also 2020 from
23% to 41%. Accordingly, by 2020, 2G will during no run through later on make those generally improvements
in regards to acquaintanceships.
Operators need contributing profoundly in LTE system rollouts, which bring been instrumental
moulding for driving those push previously, 4G Choice. Beginning during 2016, 580 LTE frameworks required
been presented in 188 countries. The making scene spoke to 3 fourth of the new framework dispatches done
2016 and presently identifies with essentially under those parcel from claiming aggravator LTE systems, up
starting with one-quarter over 2012. 4G frameworks went with really About 60% of the aggregate people over
2016, up from A large portion Previously, 2015 Furthermore 11% over 2012. In the making scene, A large
portion of the people will be secured by 4G; this will be depended upon on augment will precise almost 70% by
2020. Conversely, 4G scope levels in the made world, toward 93% of the populace, are recently foreseen that
might upgrade toward two rate concentrates to 95% toward 2020.
Revenue and investment trends
Income development in created businesses need to stay generally plane In the most recent couple years,
Likewise decreasing incomes Previously, Europe was offset Eventually Tom's perusing improvements On other
guideline made markets, for example, those US, Japan and South Korea. In 2016 vital European businesses for
example, such that Germany, Spain Furthermore Italy come back to development. Those prime driver from
claiming this turnaround may be duty readjustments, which particularly offer more excellent information
remittances toward higher cosset & have been executed done an amount for European business sectors. Close-
by Extending premium to information, and the sure impact of the former union, these worth adjustments will
drive higher pay advancement Previously, 2017. By complexity, those us showcase need to turn into dependably
in the span of The majority late few from claiming quite some time yet may be presently entering An additional
stale improvement stage, Similarly as robust contention weighs on incomes. From 5% improvement seen in
2014. (YoY), those us showcase produced by 1. 7% to 2015, Furthermore, Eventually Tom's perusing An
unimportant 0. 1% done 2016. T-Mobile USA Also Sprint continue acting Concerning illustration contenders in
the market, for that past particularly demonstrating compelling Previously, drawing customers starting with
AT&T What's more Verizon. Bringing then afterwards two quite some time from claiming low development,
which indicated a Uni for made markets, the making scene bounced back to 2016, for growing incomes 5. 3%
year-on-year. Macroeconomic headwinds facilitated, with China Furthermore India those key drivers for
development; growing enthusiasm for the majority of the data and supporter doorway accelerated advancement
rates clinched alongside both countries. Wage improvement clinched alongside making businesses is figure
should direct All around those accompanying four a considerable length of time Likewise raised contention to
enter business sectors (India What's more Malaysia) Furthermore managerial slices should compact conclusion
rates in Brazil weigh with respect to improvement.
Mobile contributing to jobs and economic growth
This esteem included impression changes crosswise over areas. High-salary nations have progressed in
computerised economies, gifted work and capital so have a tendency to practice more on esteem creation in
DOI: 10.9790/487X-2002020817 www.iosrjournals.org 16 | PageA REVIEW OF INDIAN MOBILE PHONE SECTOR
zones, for example, content and administrations. Medium pay markets have upper hands in assembling gadgets
(work costs specifically). Low-wage nations have on a normal a less talented workforce, so their biological
community design ordinarily depends more on the parts of the esteem chain that are more work serious,
especially appropriation and retail.
Notwithstanding their direct financial commitment, firms in the portable environment buy
contributions from their merchants in the production network. For instance, handset producers obtain
contributions from microchip suppliers and portable substance suppliers require administrations from the more
extensive IT segment. Besides, a portion of the benefits and income produced by the environment are spent on
different merchandise and administrations, animating monetary action in those divisions. In 2016, this extra
financial movement collected a further $430 billion in esteem include (or 0.6% of GDP). The utilisation of
portable innovation additionally drives changes in proficiency and profitability for specialists and firms. The
effect of this profitability created around $1.85 trillion in 2016 (or 2.5% of GDP). By and large, considering the
immediate, circuitous and efficiency impacts, in 2016 the portable business made an aggregate commitment of
roughly $3.3 trillion in esteem included terms, proportional to 4.4% of worldwide GDP.
Employment and public funding
In 2016 mobile operators and the ecosystem provided direct employment to more than 11 million
people globally. Financial movement in the biological system additionally produces occupations in different
parts. Organisations that give merchandise and administrations as generation contributions for the portable
biological system (for instance, microchips) will utilise more people thus of the request brought about by the
versatile part. What's more, the wages, open subsidising commitments and benefits paid by the business are
spent in different areas, which give extra employments. In 2016, around 17 million additional employments
were in a roundabout way upheld along these lines, bringing the aggregate effect (both immediate and
circuitous) of the versatile business to more than 28 million occupations. The portable biological system
likewise makes a noteworthy commitment to the financing of the general population part by means of general
tax assessment. In many nations, this incorporates esteem included duty, partnership charge, wage imposes and
government-managed savings from the commitments of firms and workers. The biological system made an
assessment commitment to people in general funds of legislatures of around $450 billion in 2016.
Contribution to public funding
Besides the public funding contributions through general taxation, mobile operators made further
contributions via two additional channels. In 2016, range barters created incomes of nearly $19 billion – half of
which was from the sale in India. In a few nations, versatile administrators are likewise subject to part particular
expenses, for example, income share charges, social commitment support commitments, SIM and broadcast
appointment voucher assessments or yearly range charges.
IV. Conclusion
It is anticipated that worldwide financial commitment of the versatile business with keep on expanding
on both relative and supreme terms. Previously, worth-included terms, It’s gauged that those biological
communities will produce more than $4.2 trillion by 2020 (4. 9% about GDP) up starting with $3.3 trillion (4.
4% of GDP) in 2016. The vast majority of this expand will be expected will benefit additions. In the created
world, the selection from claiming M2M results will drive expanded benefit development, profit Growth will be
determined by those selections for mobile web benefits.
References
[1]. Euromonitor International, (2016). Mobile Phones in India
[2]. GSMA Intelligence, (2017). The Mobile Economy 2017, Retrieved from www.gsmaintelligence.com
[3]. http://www.ethicalconsumer.org/ethicalreports/mobilesreport/environment.aspx
[4]. Institute for Competitiveness. (2010). State Competitiveness Report. Institute for Competitiveness.
[5]. Indian Brand Equity Foundation (IBEF), (2017). Telecommunication, Retrieved from www.ibef.org
[6]. Porter, M. (2008). Clusters and competition. In M. Porter, On Competition (pp. 213-303).Boston: Harvard Business Review.
[7]. Porter, M. (2010). Global Competitiveness Index India
[8]. http://timesofindia.indiatimes.com/business/india-business/Mobile-phones-to-mobilize-Indias-economic-development-
Study/articleshow/23609704.cms
IOSR Journal of Business and Management (IOSR-JBM) is UGC approved Journal with Sl.
No. 4481, Journal no. 46879.
Akash C.Mathapati. “A Review of Indian Mobile Phone Sector.” IOSR Journal of Business and
Management (IOSR-JBM) , vol. 20, no. 1, 2018, pp. 01-17.
DOI: 10.9790/487X-2002020817 www.iosrjournals.org 17 | PageYou can also read