Java Plus Coffee: A Case Study in Economic Sustainability in a Non-Profit Organization - North American Business Press
←
→
Page content transcription
If your browser does not render page correctly, please read the page content below
Java Plus Coffee: A Case Study in Economic
                        Sustainability in a Non-Profit Organization

                                          George Dierberger
                                          Augsburg College

                                            Marc McIntosh
                                           Augsburg College

                                            Nancy Johnson
                                           Augsburg College

Java Plus is a non-profit case study focusing on the coffee industry. The case deals with business strategy,
multiple distribution channels, financial analysis, break-even analysis, operational, sourcing challenges
and inventory rationalization. The profits of the company are used to help inner city youth gain
experience in business and find a vocation that would support their dreams and aspirations.

SYNOPSIS

    The coffee industry is a $100 billion dollar industry. After crude oil, coffee is the second most traded
commodity in the world (Thurston, 2013). Coffee is grown in over 50 countries in Asia, Africa, South
America, Central America and the Caribbean with 67% of the world's coffee grown in the Americas. On a
worldwide basis consumers drink annually over 500 billion cups of coffee. Arabica and Robusto are the
two main commercially grown and sold coffee beans. Arabica is the more common type of bean grown
(70 percent of coffee is Arabica), and it's considered more flavorful. Robusta is hardier and cheaper, and
is most commonly found in instant coffee jars (Goldschein, 2011).
    In response to the increased attention on working conditions for farmers, a new initiative called “Fair
Trade” coffee was instituted to provide growers with better conditions and a higher profit margin
(Goldschein, 2011). Under “Fair Trade” rules, the coffee importer has a direct relationship with the
grower, and pays additional compensation to maintain that relationship. Companies such as Starbucks,
Caribou, Dunkin' Donuts and McDonald's all carry Fair Trade coffee.
    Java Plus is a non-profit regional coffee business located in Minneapolis, Minnesota. The company’s
mission is to sell premium Arabica coffee and other beverages to support programs for inner city youth.
The company was founded in 2010 as a means of producing a consistent revenue source to help fund
social enterprise programs. Java Plus employs urban youth, providing many people with their first work
experience with the goal of working towards ending the cycle of generational poverty in Minneapolis,
Minnesota.
    Java Plus has recently been experiencing financial losses (Exhibit 3) impacting the organization’s
ability to support youth programs and events. The business needs assistance with a formal business

                                                       American Journal of Management Vol. 16(4) 2016    65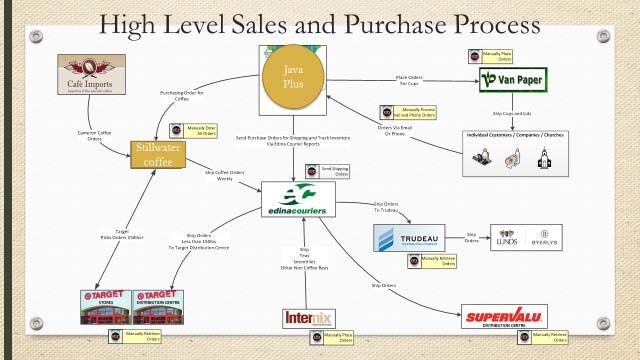
analysis along with recommendations for improvements. The struggle to generate positive income with
the coffee business is perceived to be due to a number of factors:
    1) The coffee business is extremely competitive with major brand names such as Starbucks and
        Caribou with retail store locations. In addition, they sell their Arabica coffee beans in national
        retailers like Target and Wal-Mart.
    2) Coffee is being impacted by global warming which could have a negative impact on production
        and supply, resulting in coffee price fluctuation due to poor weather.
    3) Java Plus has significant challenges selling to large retailers such as Target, SuperValue, Cub
        Foods and local grocery stores.
    4) Operationally, there are a limited number of local quality roasters available with packaging
        options for large retailers. This is a constraint for Java Plus as they look at alternative companies
        that can roast the Arabica coffee beans and provide packaging in quantities significant for the
        retail channel.
    5) The finest coffee beans are Arabica beans; the taste and consistency are a higher quality and also
        more expensive to purchase thus resulting in lower gross margin. Arabica beans are the
        benchmark required to compete against the major brands (Thurston, 2013).
    6) There are inventory issues pertaining to the significant number of stock keeping units (SKUs)
        required to compete based on flavor, and packaging size in the retail market. Java recently
        introduced the new K-cups for the Keurig coffee dispensers.

LEARNING OBJECTIVES

     1) Demonstrate an understanding of the process and operational challenges of the coffee industry.
     2) Demonstrate a methodology for understanding Java Plus’s channel strategies by determining the
        best way for Java Plus to remain competitive in the coffee business.
     3) Perform financial analysis of the three channels. This includes horizontal, vertical and margin
        calculations and analysis business channel.
     4) Perform an inventory analysis and recommend the stock keeping units (SKUs) to be offered in
        units and dollars for the retail market.
     5) Draw meaningful conclusions and make final recommendations.

COMPANY STRUCTURE

     The board of directors consists of 7 members: five members are from the business community and the
remaining two are from the non-profit world. The board is very aggressive and committed to the current
distribution channels (corporate, religious and retail market) because they believe the Java Plus brand will
benefit from the exposure in all three areas. Aboard member was instrumental in getting the product into
Target and Cub Foods and is convinced the retail channel is critical to sustainability. Each board member
is very supportive and dedicated to the mission. Another board member, who works at a Fortune 500
company, has even supported Java Plus by providing free creative marketing services for packaging and
other marketing materials. The board is very dedicated and wants to see Java Plus succeed in the market
place. In addition to the part-time youth employed, there are 5 full-time employees: a managing director,
internet coordinator, sales representative, marketing coordinator and an office manager. They currently
rent a small, 1000 square foot office in downtown Minneapolis. Java Plus outsources the manufacturing
and distribution process.

CURRENT SITUATION ANALYSIS

    For the fiscal year ended 2015, Java Plus experienced a financial loss of $239,000 on revenues of
$1,054,348. In fiscal year 2016, they experienced a financial loss of approximately $15,289 on revenue of
$1,071,806 (Exhibit 3) resulting in an inability to contribute financial support to the youth programs and

66   American Journal of Management Vol. 16(4) 2016
events. As mentioned previously, Java Plus sells products through three main channels of distribution:
major retail stores, corporate accounts and religious groups. The following synopsis provides details for
each channel.
Retail Channel
The retail market consists of Fortune 500 companies such as Target, Cub Foods, SuperValu, and
smaller regional grocery chains including Kowalski’s, Byerlys and Lunds. The retailers currently sell
major brands in their coffee aisles including Starbucks, Caribou, Dunking Donuts and Peace Coffee.
In this market, inventory is referred to as a stock keeping unit (SKU) and analyzed on the turnover
(sell through) of each unit. The majority of the Java Plus SKUs at the retail level include bags of coffee
and newly introduced K-cups. The typical retail price for the competitors is $ 7.95 for a 12 ounce bag of
coffee; Java Plus sells the same 12 ounce bag for $8.95. The new K-cups for Keurig have only been sold
to the retail channel.
The competitive brands roast their own coffee and are fully integrated with control over roasting,
packaging and distribution. Java outsources the roasting process and is therefore subject to other
constraints in the manufacturing processes: higher processing costs, quantity and size of roasting runs,
timing dependencies at the roaster, competitive product being manufactured and packaging supplies.
Recently, Target and Cub Foods have communicated their disappointment with the SKU turnover of
individual packages and K-cups which are currently less than one pack per store per week. The standard
SKU turnover rate for the coffee category is 7-10 units per store per week and at lower retail prices. The
Java Plus retail price point was 10-15% higher than the major brands due to a higher cost of goods sold
(COGS) price from the local roasting outsourced partner. In retail, mark-down money is used by the
retailer to offer a “special price” to the shopper. In the coffee category, a normal mark-down would be a
$1 dollar per bag which helps match the major brands at $7.95 for a 12 ounce bag. When the Java Plus
brand is on mark-down, the SKUs increase but still fall short of the required turnover required by the
retail partners. When products are marked down, the money is charged back to Java Plus and netted
against revenue having a negative impact on gross margin and profitability (Exhibit 3, Total Discounts).
Coffee product gross margin requirements for companies in the retail channel range from 35% to 40%
as such, price adjustments have not been an option for Java Plus. Another challenge is obsolescence of
product. Due to the disappointing inventory turnover, the product was consistently getting close to or
exceeding its expiration date which negatively impacted the taste of the product. The end result was a
higher priced product, with a poor consumer tasting experience; not a winning formula at retail. The
highly competitive coffee market makes it challenging to hold market share in the retail sector due to the
number of national brands that have established consumer loyalty.
Java Plus and its board believe in the retail market due to its consumer exposure for the brand and the
mission of the organization. The board believes that the retail marketplace represents the greatest
potential revenue and can greatly assist in creating economies of scale with the other channels that have
lower revenue streams. The retail market also is perceived to have the opportunity to reach the largest
audience. The retail channel positions the brand in front of the consumer through accounts that are
already established.
With retail stores being so highly competitive and saturated with coffee brand options, this
marketplace unfortunately represents lower gross margins when compared to other channels of
distribution. This is a combination of meeting retailer requirements, along with the higher cost of goods
sold for the smaller packages. In addition, contributing to the profitability issues in the retail marketplace
is the amount of staff time required for managing these retail accounts. The retail group consumes a large
amount of staff time and is not meeting the demanding retail unit turnover requirements for the coffee
category.
Religious Channel
There are several mega church groups in the Twin Cities area of Minneapolis and St. Paul (Twin
Cities) which purchase coffee from Java Plus for member meetings and services. They prefer to buy in
American Journal of Management Vol. 16(4) 2016 67bulk packages of 5 pound bags and 8 ounce portion packs designed for large coffee urns. They also sell
hot chocolate mix, miscellaneous items (Styrofoam cups, stir sticks, napkins and brand merchandise). The
board of directors believes the religious organizations represent a significant opportunity to expand the
reach of the Java Plus’s core mission outside of the Twin Cities market. The relationships have been
beneficial to the organization and its brand image. Some of the church groups have 5,000 or more
members in their congregations and have become large customers for Java Plus. Thus the religious
accounts are an identified market opportunity that can reach a potentially large, influential consumer
population. The overall revenues Java Plus realizes from this channel continue to increase, with very little
promotional effort, as there is no required use of markdown dollars to provide incentives to purchase.
Thus historically the religious organizations have offered higher gross margins than the retail channel
(Exhibit 3).
In summary, the religious accounts provide an environment that is easier to do business with as it is
not as competitive and saturated as the retail environment. There is more emphasis placed on relationships
and mission than in the other distribution channels. It should be noted, that there may be a small sales risk
in selling to religious organization due to the number of days that the organization would have a need for
coffee and related products.
Corporate Channel
In the Twin Cities, there are several large Fortune 500 corporations that purchase coffee from Java
Plus for their cafeterias and coffee shops including Best Buy and General Mills. Historically the corporate
channel has been a very loyal group of customers who, like the religious channel, are extremely
supportive of the mission, the brand, and its cause. The board of directors believes the corporate accounts
represent a significant opportunity to expand into other organizations and potentially offer a small scale
retail environment within the existing main campus buildings. This channel could be a growth
opportunity for Java Plus as they look to expand to 3M, Delta Airlines, Medtronic, Boston Scientific, St.
Jude Medical, local, state government and others. The corporate accounts will also positively impact
customers and expose them to the Java Plus brand. The Java Plus sales staff is dedicated to nurturing
these relationships given the competitive nature of the coffee industry. The risk is that employees of the
corporations may potentially request a different brand or brands be sold based on support of the corporate
mission or they may prefer specific big coffee brands based on taste requirements.
The corporate sales channel reflects lower cost of goods with the product being sold in five pound
bulk, eight ounce pre-portion bags for large coffee urns. They also sell hot chocolate mix, and
miscellaneous items (ie Styrofoam cups, stir sticks, napkins and brand merchandise). The larger portion
SKU’s result in more favorable gross margins (Exhibit 3). This sales channel requires more initial
relationship development and sales efforts to establish the accounts, but over time this amount is
significantly decreased due to customer loyalty.
FINANCIAL ANALYSIS
Java Plus is classified as a 503c non-profit organization for tax purposes. There has been turnover in
the accounting and finance functions and the current controller has corporate but not non-profit financial
acumen. Internally the interim financials are organized as modified profit and loss and statement of
financial position to allow for detailed financial analysis (Exhibit 3 & 4).
In the most recent year 2016, Java Plus had over 140 customers and total revenues of $1,071,806.
Once discounts from promotions, damaged, and expired product and cost of goods sold are deducted, Java
Plus’s Gross Profit of $358,437 was not enough to cover their $367,500 in fixed costs, leaving them with
a net loss of $15,289. Java Plus’s has three separate channels: corporate, religious organizations, and a
retail category. Analysis has not been perform to determine which of the channels (corporate, religious,
retail) have a higher contribution margin.
All business financial activities pertaining to revenue and cost of goods sold are tracked by division
(corporate, religious and retail), and all shared expenses are combined into selling and administrative
68 American Journal of Management Vol. 16(4) 2016(SG&A). Cost of goods sold includes product and roasting costs. SG&A includes wages salaries,
marketing, interest on debt, etc. All net profits are defined as revenues less cost of goods sold less SG&A,
and are donated to the youth organizations discussed previously thus resulting in a net income or loss of
zero. For the past two years, Java Plus has realized negative net profits and thus has not been able to
support the organization financially.
The Statement of Financial Position (Exhibit 4) reflects the current net asset position of the
organization. Java Plus admittedly has issues with is operating processes struggling to collect on
receivables, creating cash flow issues currently impacting the ability to pay the accrued donations to the
sponsored organization. Inventory continues to increase as well, at times in relation to the sequencing and
batch size requirements placed upon Java Plus at the outsourcing roasting partner. These issues have
resulted in a reduced ability to stay current on payables, however the organization is current on its short
and long term debt. As a non-profit there are no retained earnings or stock components.
COMPETITIVE ANALYSIS
The four major local competitors to Java Plus in the retail and wholesale marketplace include:
Caribou Coffee, Equal Exchange, Stillwater Coffee, and Peace Coffee. The four competitors were taken
into consideration based on their location, venues of sales, and their mission statements. Starbucks was
not considered a local competitor given their global reach and their Seattle based headquarter location.
Caribou Coffee is a Midwest based company now owned by JAB Holdings which also owns
Einsteins Bagels and Peet’s Coffee. They have a strong presence in retail with over 273 company owned
stores and 127 licensed coffee shops locations in over 22 states and over 4,600 employees. They also have
coffee shops in 10 other countries. Their sales at the end of 2012 were over $500 million; they were taken
private by JAB Holdings in 2013. They sell their coffee wholesale to the majority of the major retailers
and have expanded their partnerships with Kemps Ice Cream and Keurig coffee cups. Their coffee and
espresso beans are 100% Rainforest Alliance Certified. Caribou Coffee is also dedicated to giving back to
charity organizations supporting breast cancer, children’s literacy, and the environment.
Equal Exchange is unique in the coffee industry. The company is a cooperative and is worker-owned,
faith based and maintains a strong retail and wholesale presence. They started in 1986 and have on-going
relationships with small farmers that grow their coffee beans. They believe in sustainability by promoting
organic agricultural practices for their farmer/partners. They offer coffee for church groups and focus on
giving back to the farmers and all of the supply chain partners. Equal Exchange offers a variety of
beverages (coffee, tea, and hot cocoa) and miscellaneous snacks (trail mix, product, and chocolate, among
others). Their focus is on their farmers, interfaith, and fair trade partners. All of their beans are Fair Trade
and they are looking for additional locations outside of Boston and Seattle.
Stillwater Coffee was founded in 1980 in Minnesota. They have a presence in 48 states and recently
signed a private label contract with Costco. Its estimated sales are over $40 million annually. They have
their own private label brand of coffee and they have focused on the grocery and club channels as a
method of growth. They are primarily a wholesale coffee company. They roast their coffee in house for
retail sales but also roast, package and distribute for other companies private label brands. They have a
strong presence in local grocery stores and have an extensive online store. They purchase their beans from
one of the largest bean suppliers in North America and control all aspects of the roasting, packaging,
processing and inventory of the products. Stillwater Coffee private labels for Java Plus and also competes
against them with their own brands.
Peace Coffee is based in Minneapolis and started by the Institute for Agriculture and Trade Policy.
Their mission is to promote a community of fair trade, trading with small scale farmers at industry leading
prices and to promote living wages through-out the company. They are committed to environmental
sustainability, such as having bike courier services and using eco-friendly van for delivery. Peace Coffee
uses its business plan as a part of marketing for their coffee. Their product line includes at home coffee
blends as well as coffee shops both local and franchise shops.
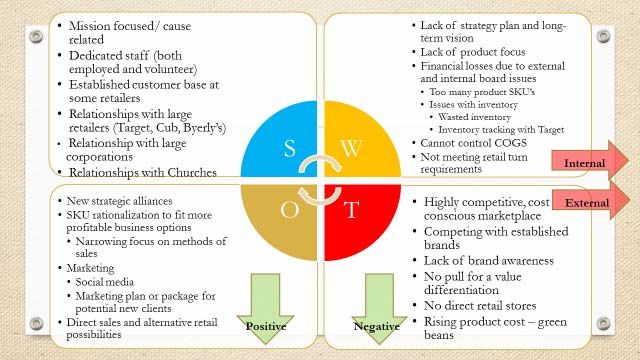
American Journal of Management Vol. 16(4) 2016 69STRENGTHS-WEAKNESSES-OPPORTUNITIES-THREATS (SWOT)
Java Plus has multiple strengths within their organization. The dedicated staff are some of their
primary strengths. The Java Plus brand is a strength, as is the retail packaging, that was co-developed with
the help of the marketing team at General Mills. The cause-related marketing theme is a strength with the
profits used to help inner city children and adults. The customer base for Java Plus has been extremely
supportive of their mission and has helped create brand loyalty with corporate, religious organizations and
retailers. This is important since the coffee business is a competitive market and the channels help provide
diversification and cash flow to Java Plus. The expansion into the Keurig™ cup business has helped
position Java Plus with certain customers that have changed to that method of making coffee.
The internal weaknesses facing Java Plus are significant. The first weakness are the challenges
operating in the retail sector: retail packaging, mark down dollars, and the number of stock keeping units
(which are the number of items Java Plus sells to its customers). A number of stock keeping units (SKU),
were brought in at the request of a single retail client without the benefit of analysis or a firm
understanding of the rate of consumption. In addition, one of the challenges is the lack of control over
manufacturing costs. Java Plus is not large enough to dictate with its manufacturing partner when items
should be manufactured. Due to the quantities and the type of packaging (retail versus bulk) they need to
produce. Because of this lack of control over manufacturing, the minimum manufacturing runs (5000
pieces at a time for example) required by Stillwater Coffee created inventory that might last over a year;
thus impacting taste and quality. The retail presence is also a weakness due to the higher cost of doing
business with large retailers, their operational and logistical requirements (EDI, smaller case quantities,
point of sale data, gross margin, the need to pay a commission to an outside sales rep and the minimum
inventory turnover requirements). The limited ability to control cost of goods sold is a significant
weakness with Java Plus purchasing finished goods from a local roaster. Many of their competitors are
more vertically integrated and have the ability to source and roast their own coffee. Java Plus does not
control the raw material, roasting, and packaging costs.
In terms of opportunities, Java Plus is well positioned to take advantage of the continued growth in
the coffee market and some of the new drinks that can be sold through their channels of distribution. The
Java Plus brand has a great opportunity to grow and expand across all three channels and expansion into
new customers. The emerging Keurig cup business is a significant opportunity for Java Plus to expand its
product line and possibly enhance its gross margins.
In reviewing the organization threats, virtually all of the competitors have stronger brand awareness
and spend a significant amount of money on marketing (Starbucks, Caribou, Dunn Brothers, Stillwater
Coffee). The major competitors are vertically integrated with control over the Arabica bean sourcing,
roasting (multiple locations) packaging and distribution. Many have their own stores as well which helps
maintain higher gross margins and brand identity. This is a threat as Java Plus does not have the same
brand awareness as their major competitors, nor do they have retail outlets which helps with production
demand, inventory management, sales and customer loyalty. The organization must always be aware of
times when rising raw material costs for the raw Arabica green bean due to demand or weather issues
cause the beans to rise in costs. Our SWOT analysis in highlighted in Exhibit 1.
70 American Journal of Management Vol. 16(4) 2016EXHIBIT 1
OPERATIONAL CHALLENGES
There are several operational challenges for Java Plus. The most pressing challenge is they do not
control their supply chain for raw materials and their distribution center. Java Plus is a growing brand but
without the capital assets of a roasting facility and distribution center. The flow chart below (EXHIBIT 2)
indicates the sales and purchase process for Java Plus:
1) Café Import - raw materials (Arabica coffee beans) are ordered.
2) Stillwater Coffee roasts and packages the product and in some cases delivers to retail
accounts if they have a direct relationship.
3) Edina couriers is sent product for church, corporate and some retail accounts.
4) Intermix and Trudeau are another distribution point for Lunds and Byerlys grocery stores.
5) Van Paper and other suppliers provide paper cups and other products for corporate and
church clients.
Java Plus has the following challenges:
1) They rely on Café Imports for their Arabica raw coffee beans; the beans are purchased
through their roaster, Stillwater Coffee.
2) They use an outside logistics company for storage and shipment. The logistics company has
some challenges accepting orders via electronic data interchange (EDI); a requirement for
most retail accounts.
3) They have to meet certain minimum production runs at their roaster which can lead to
delayed manufacturing and overstock on items.
4) Retail packaging is expensive and a number of SKU’s at the retail shelf were old packaging.
5) Obsolete inventory on a number of SKU’s due to poor retail turns.
6) Too many SKU’s that do not sell well at retail and create obsolescence.
American Journal of Management Vol. 16(4) 2016 717) Changing consumer needs for taste and delivery. The new Keurig cups are an excellent
example of change.
EXHIBIT 2
ITEM AND STOCK KEEPING UNIT (SKU) ANALYSIS
As shown in EXHIBIT 5, the SKU’s are separated by quantity, revenue, net profit, profit per unit,
cost per unit, and return on investment (ROI). The purpose of this analysis was to identify the inventory
with the highest margin in an effort to increase earnings and focus vital staff time on the best product
inventory items. An analysis of the data will help determine the highest returns on investment coffee
inventory, which items to keep and which items to potentially rationalize. The analysis, will also identify
the SKU’s stocked as part of the inventory but do not sell well; these items may have provided a specific
niche offering to a customer or a marketing and sales opportunity at one time. The analysis will help
determine which items are loss leaders that do not appear to provide large value to the sales efforts. The
SKU’s are listed below broken down by the channel of distribution. Based on the analysis, our consulting
team must make a recommendation for the final number of SKU’s. By focusing on the most profitable
items, it should improve the gross margin and improve cash flow through reduced inventory.
INSTRUCTIONS AND KEY DELIVERABLES
Using the information provided in this case students are to assume the role of consultants hired by the
board of directors to perform analysis and provide constructive recommendations for the future. The
following deliverables should be prepared for presentation.
72 American Journal of Management Vol. 16(4) 2016Deliverable Learning Objective
Report: Prepare a detailed report to the board of directors 1. Demonstrate an
with your recommendations for improvement. This report understanding of the
should be founded on the items you prepare for #2 below. process and operational
Include a detailed explanation of how you would you challenges of the coffee
improve the operations of the business. The industry
recommendations must also include a suggested sequencing 2. Demonstrate a
and specific timelines for implementation (10 to 15 pages) methodology for
understanding the channel
strategy by determining the
best way for Java Plus to go
to market
Financial statement modeling and analysis: Prepare a 3. Ability to perform financial
professional Excel based model to include but not be limited analysis of the three
to the following: channels of distribution.
1) Horizontal, vertical and margin analysis of the statement This includes horizontal,
of operations for past three years. Include analysis of the vertical and ratio
gross margin by distribution channel. calculations and analysis,
and breakeven analysis by
2) Inventory assessment including analysis and business channel.
rationalization of the number of SKUs along with 4. Perform an inventory
specific recommendations for expansion and contraction. analysis and recommend
Analysis of distribution channels along with a the stock keeping units
recommendation for which the organization should (SKUs) to be offered in
utilize going forward. Your position must be supported units and dollars for the
with data analysis. retail market
3) Breakeven analysis for the company with all three
channels of distribution and then for each scenario.
Presentation Items: 5. Draw meaningful
1. Professional Power Point summarizing the key conclusions and make
recommendations professional
2. Executive Summary – a one page, bullet point synopsis recommendations and
of the key findings and recommendations presentations.
(Instructor note): For online courses these items could be
placed in a shared file location, and delivered via an online
forum such as Skype or Google Hangout.
American Journal of Management Vol. 16(4) 2016 73EXHIBIT 3
EXHIBIT 3: Statement of Operations
FY 20X4 FY20X5 FY20X6
Revenue
Bulk Sales (Corporate)
40110 · Bulk Cocoa $ 22,400 $ 22,624 $ 23,076
40310 · Bulk Coffee 82,600 85,491 88,911
40130 · Other Products (tea, merch, cups, filters) 27,013 27,553 27,553
40320 · Portion Packs (8 oz) 171,484 175,772 181,045
40350 · Single Serve (2.5 - 3 oz ) 28,892 29,470 30,501
Total Bulk Sales (Corporate ) $ 332,389 $ 340,910 $ 351,086
Bulk Sales ( Religious) - -
40110 · Bulk Cocoa 28,600 29,458 30,636
40310 · Bulk Coffee 81,617 86,106 91,273
40130 · Other Products (tea, merch, cups, filters) 33,016 33,676 34,518
40320 · Portion Packs (8 oz) 209,592 215,880 225,595
40350 · Single Serve (2.5 - 3 oz ) 35,313 36,019 37,279
Total Bulk Sales ( Religious) $ 388,138 $ 401,139 $ 419,301
Retail Sales - -
40330 · Retail 12 oz bags 295,500 301,410 296,889
40120 · Retail K Cups - 6,400 9,737
40600 · Revenue - Other Products 118,107 119,878 121,676
40390 · Total Discounts (112,400) (118,582) (126,883)
Total Retail Sales $ 301,207 $ 309,106 $ 301,420
Total Net Revenue $ 1,021,734 $ 1,051,155 $ 1,071,806
- -
Cost of Goods Sold - -
COGS -Bulk (Corporate) - -
50110 Bulk Cocoa 2,410 2,507 2,607
50310 Bulk Coffee 20,371 21,593 22,564
50130 Other Products (tea, merch, cups, filters) 16,302 17,117 18,144
50320 Portion Packs (8 oz) 92,723 95,505 99,325
50350 Single Serve (2.5 - 3 oz ) 39,355 39,749 40,544
Total · COGS - Bulk (Corporate ) $ 171,161 $ 176,470 $ 183,184
COGS -Bulk (Religious) - -
50110 Bulk Cocoa 3,077 3,201 3,329
50310 Bulk Coffee 20,128 21,336 22,296
50130 Other Products (tea, merch, cups, filters) 19,925 20,921 22,176
50320 Portion Packs (8 oz) 113,328 116,728 121,397
50350 Single Serve (2.5 - 3 oz ) 48,101 48,582 49,553
Total · COGS - Bulk ( Religious) $ 204,559 $ 210,767 $ 218,751
COGS - Retail - -
50330 12 oz Retail Bags 168,280 181,742 194,464
50120 Retail K Cups 18,390 19,126 19,891
50340 Expired Product & other coffee 3,500 3,745 4,063
50600 Other Products&Shipping 86,000 89,010 93,015
Total COGS - Retail 276,170 293,623 311,434
Total COGS $ 651,891 $ 680,861 $ 713,370
Gross Profit $ 369,843 $ 370,294 $ 358,437
Operating Expenses
Total SG&A Expenses 367,500 373,726 373,726
Net Profits $ 2,343 $ (3,432) $ (15,289)
Donations to Youth 2,343 - -
Net Income or Loss $ - $ (3,432) $ (15,289)
74 American Journal of Management Vol. 16(4) 2016EXHIBIT 4
EXHIBIT 4: Statement of Financial Position
FY20X6
Assets
Cash $ 42,050
Restricted Cash (donations) -
Trade Receivables 65,220
Inventory 95,413
Other Current Assets 17,201
Total Current Assets 219,884
Property Plant & Equipment, net 113,200
Intangible Assets, net 48,100
Total Long Term Assets 160,562
Total Assets $ 380,446
Liabilities
Accounts Payable $ 124,030
Donations Payable 37,500
Short Term Debt 75,230
Total Current Liabilities 199,260
Long Term Debt 130,000
Other Liabilities 51,186
Total Long Term Liabiliities 181,186
Total Liabilities & Net Assets $ 380,446
American Journal of Management Vol. 16(4) 2016 75EXHIBIT 5
Item Description Cost 20X6
Retail
10-110-12-100GR 12oz Java Blend, Ground $ 3.43 $ 42,172
10-110-12-1100WB 12 oz whole bean - Decaf Espresso $ 3.75 $ 37,955
10-110-12-1200GR 12oz Lake Street Blend, Ground - Rainforest Alliance $ 3.43 $ 37,955
10-110-12-1300GR 12oz French Roast, Ground - Rainforest Alliance $ 3.43 $ 37,955
10-110-12-1300WB 12oz French Roast, Whole Bean - Rainforest Alliance $ 3.43 $ 37,955
10-110-12-200WB 12oz Sumatra, Whole Bean $ 3.43 $ 29,520
10-110-12-400GR 12oz Dark Roast Sumatra, Ground $ 3.43 $ 33,737
10-110-12-500GR 12oz Decaf Colombian, Ground $ 3.43 $ 22,773
10-110-12-600WB2 12 oz whole bean - Guatemalan Decaf $ 3.71 $ 8,434
10-110-12-900GR 12oz Highlander Grogg, Ground $ 3.43 $ 8,434
$ 296,889
K-Cups
Keruig K-Kup Reusable $ 18.79 $ 590
Keurig Machine Keurig Machine $ 150.00 $ 1,475
K-10-110-12-100GR 12oz Java Blend, Ground $ 6.50 $ 1,475
K-10-110-12-1100WB 12 oz whole bean - Decaf Espresso $ 6.50 $ 1,180
K-10-110-12-1200GR 12oz Lake Street Blend, Ground - Rainforest Alliance $ 6.50 $ 1,180
K-10-110-12-1300GR 12oz French Roast, Ground - Rainforest Alliance $ 6.50 $ 1,475
K-10-110-12-1300WB 12oz French Roast, Whole Bean - Rainforest Alliance $ 6.50 $ 2,360
subtotal K-cups $ 9,737
Other Revenue $ 121,676
76 American Journal of Management Vol. 16(4) 2016Item Description Cost 20X6
Corporate and Religious - Bulk products
10-120-18-2.5-100 18 Count (2.5 oz bags) per case; Java Blend $ 12.78 $ 1,807
10-120-18-2.5-300 18 Count (2.5 oz bags) per case; French Roast $ 12.78 $ 7,230
10-120-18-2.5-400 18 Count (2.5 oz bags) per case; Dark Roast Sumatra $ 12.78 $ 7,230
10-120-18-2.5-600 18 Count(2.5 oz bags) per Case; Decaf Dark Roast $ 12.78 $ 7,230
10-120-18-2.5-700 18 Count (2.5 oz bags) per case; Vanilla $ 12.78 $ 1,807
10-120-18-2.5-800 18 Count (2.5 oz bags) per case; Hazelnut $ 12.78 $ 5,422
10-120-18-2.5-900 18 Count (2.5 oz bags) per case; Highlander Grogg $ 12.78 $ 3,615
10-120-18-3-100 18 Count (3 oz bags) per case; Java Blend $ 15.30 $ 3,615
10-120-18-3-300 18 Count (3 oz bags) per case; French Roast $ 15.30 $ 7,230
10-120-18-3-400 18 Count (3 oz bags) per case; Dark Roast Sumatra $ 15.30 $ 5,422
10-120-18-3-600 18 Count (3 oz bags) per case; Decaf Dark Roast $ 15.30 $ 5,422
10-120-18-3-700 18 Count (3 oz bags) per case; Vanilla $ 15.30 $ 5,422
10-120-18-3-800 18 Count (3 oz bags) per case; Hazelnut $ 15.30 $ 5,422
10-120-18-3-900 18 Count (3 oz bags) per case; Highlander Grogg $ 15.30 $ 904
$ 67,781
10-120-18-8-100 Portion packs (8 oz bags) per case; Java Blend $ 39.78 $ 91,453
10-120-18-8-300 Portion packst (8 oz bags) per case; French Roast $ 39.78 $ 265,942
10-120-18-8-301 Portion packst (8 oz bags) per case; Sumatra $ 40.78 $ 49,244
$ 406,639
Cocoa
Cocoa - 10 oz Double Dutch Hot Cocoa - individual foil pack 10oz bag $ 1.09 $ 5,245
Cocoa - 10 oz Bulk Double Dutch Hot Cocoa - 40 10oz bags per case $ 43.75 $ 5,245
CR-01-1000 Powdered Creamer Packets $ 22.98 $ 2,835
DD-06-(6)2-01 Double Dutch Cocoa Mix (6 Count) 2lb bags $ 18.90 $ 20,456
DD-06-10-01 Double Dutch Hot Cocoa Mix (6) Count 10 oz bags per $ 10.94 $ 10,490
DD-06-10-01:DD-06-10-01* Double Dutch Hot Cocoa Mix 10 oz bag $ 1.27 $ 9,441
subtotal chocolate and cookies $ 53,713
Bulk Coffee
10-130-2-3000 4 (2lb bulk bags) per case, Java Dark Roast; Ground $ 29.68 $ 20,433
10-130-4-100 4 (4lb bulk bags) per case; Java Blend WB $ 15.26 $ 14,860
10-130-4-1000 4 (4lb bulk bags) per case; Espresso, WB $ 15.26 $ 18,576
10-130-4-1100 4 (4lb bulk bags) per case; Decaf Espresso, WB $ 15.26 $ 16,718
10-130-4-400 4 (4lb bulk bags) per case; Dark Roast Sumatra, WB $ 15.26 $ 16,718
10-130-4-600 4 (4lb bulk bags) per case; Decaf Dark Roast WB $ 15.26 $ 11,145
10-130-5-100 5 lb whole bean - Java Blend $ 23.85 $ 24,148
10-130-5-1000 5 lb whole bean - Espresso $ 24.75 $ 11,145
10-130-5-400GR 5 lb ground - Dark Roast Sumatra $ 28.10 $ 18,576
10-130-5-400WB 5 lb whole bean - Dark Roast Sumatra $ 28.10 $ 18,576
10-130-5-600 5 lb whole bean - Guatemalan Decaf $ 24.65 $ 9,288
Bulk coffee subtotal $ 180,183
American Journal of Management Vol. 16(4) 2016 77RECOMMENDATIONS AND CONCLUSIONS
The recommendations and salient points we recommend in this case study include distribution, SKU
rationalization, operational challenges, channel strategy, current financial assessment and a pro-forma
income statement with the recommended changes. A successful implementation of the strategies
identified will provide an opportunity for Java Plus to move into a profitable position.
Distribution
• Future expansion and growth in the Corporate and Religious sectors, along with an increased
brand recognition and consumer loyalty will help poise Java Plus for future focused on its core
mission by focusing expansion in the corporate and religious channels.
• Phasing out of the retail sector due to low gross margins, high competition and lack of turnover at
retail
• By increasing corporate sales by 15%, adding 20 new Religious accounts under the current
average sales of religious accounts, or by pursuing a licensing fee under the retail sector, Java
Plus will move into a positive net income position.
Finance and Inventory
Inventory reduction of product SKU’s:
• SKU Reduction Plan
o Improves gross margin
o Focus on most profitable items
o Remaining SKU’s have a combined gross margin of only 22.89%
o Improves cash flow through reduced inventory
• reduce the total number of product SKU’s be reduced to the top XXX based on the sales-to-profit
ratio
Marketing
• Exploring licensing options which could be valued at 10% of the annual sales.
• Social media
o Research current customer trends
o Continue focus on sharing youth success stories
o Sharing upcoming events through different social media venues (ex: Facebook, Twitter,
and Instagram)
o Further research on competition
Operations
• Maintain out-sourcing operations until the business is stabilized.
• Once the business is profitable then management should explore roasting and packaging the
product internally,
78 American Journal of Management Vol. 16(4) 2016EXHIBIT 6
EXHIBIT 6: Statement of Operations - SOLUTION KEY Vertical Horizontal
Horizontal and Vertical FY 20X4 FY 20X5 FY 20X6 Change 20X5 to 20X6
Amount % of Rev Amount % of Rev Amount % of Rev Amount %
Revenue
Bulk Sales (Corporate)
40110 · Bulk Cocoa 22,400 2.2% 22,624 2.2% 23,076 2.2% 452 2.0%
40310 · Bulk Coffee 82,600 8.1% 85,491 8.1% 88,911 8.3% 3,420 4.0%
40130 · Other Products (tea, merch, cups, filters) 27,013 2.6% 27,553 2.6% 27,553 2.6% - 0.0%
40320 · Portion Packs (8 oz) 171,484 16.8% 175,772 16.7% 181,045 16.9% 5,273 3.0%
40350 · Single Serve (2.5 - 3 oz ) 28,892 2.8% 29,470 2.8% 30,501 2.8% 1,031 3.5%
Total Bulk Sales (Corporate ) $ 332,389 32.5% $ 340,910 32.4% $ 351,086 32.8% 10,177 3.0%
Bulk Sales ( Religious)
40110 · Bulk Cocoa 28,600 2.8% 29,458 2.8% 30,636 2.9% 1,178 4.0%
40310 · Bulk Coffee 81,617 8.0% 86,106 8.2% 91,273 8.5% 5,166 6.0%
40130 · Other Products (tea, merch, cups, filters) 33,016 3.2% 33,676 3.2% 34,518 3.2% 842 2.5%
40320 · Portion Packs (8 oz) 209,592 20.5% 215,880 20.5% 225,595 21.0% 9,715 4.5%
40350 · Single Serve (2.5 - 3 oz ) 35,313 3.5% 36,019 3.4% 37,279 3.5% 1,261 3.5%
Total Bulk Sales ( Religious) $ 388,138 38.0% $ 401,139 38.2% $ 419,301 39.1% 18,162 4.5%
Retail Sales
40330 · Retail 12 oz bags 295,500 28.9% 301,410 28.7% 296,889 27.7% (4,521) -1.5%
40120 · Retail K Cups - 0.0% 6,400 0.6% 9,737 0.9% 3,337 52.1%
40600 · Revenue - Other Products 118,107 11.6% 119,878 11.4% 121,676 11.4% 1,798 1.5%
40390 · Total Discounts (112,400) -11.0% (118,582) -11.3% (126,883) -11.8% (8,301) 7.0%
Total Retail Sales $ 301,207 29.5% $ 309,106 29.4% $ 301,420 28.1% (7,687) -2.5%
Total Net Revenue $ 1,021,734 100.0% $ 1,051,155 100.0% $ 1,071,806 100.0% 20,652 2.0%
Cost of Goods Sold
COGS -Bulk (Corporate)
50110 Bulk Cocoa 2,410 0.2% 2,507 0.2% 2,607 0.2% 100 4.0%
50310 Bulk Coffee 20,371 2.0% 21,593 2.1% 22,564 2.1% 972 4.5%
50130 Other Products (tea, merch, cups, filters) 16,302 1.6% 17,117 1.6% 18,144 1.7% 1,027 6.0%
50320 Portion Packs (8 oz) 92,723 9.1% 95,505 9.1% 99,325 9.3% 3,820 4.0%
50350 Single Serve (2.5 - 3 oz ) 39,355 3.9% 39,749 3.8% 40,544 3.8% 795 2.0%
Total · COGS - Bulk (Corporate ) $ 171,161 16.8% $ 176,470 16.8% $ 183,184 17.1% 6,714 3.8%
COGS -Bulk (Religious) - -
50110 Bulk Cocoa 3,077 0.3% 3,201 0.3% 3,329 0.3% 128 4.0%
50310 Bulk Coffee 20,128 2.0% 21,336 2.0% 22,296 2.1% 960 4.5%
50130 Other Products (tea, merch, cups, filters) 19,925 2.0% 20,921 2.0% 22,176 2.1% 1,255 6.0%
50320 Portion Packs (8 oz) 113,328 11.1% 116,728 11.1% 121,397 11.3% 4,669 4.0%
50350 Single Serve (2.5 - 3 oz ) 48,101 4.7% 48,582 4.6% 49,553 4.6% 972 2.0%
Total · COGS - Bulk ( Religious) $ 204,559 20.0% $ 210,767 20.1% $ 218,751 20.4% 7,984 3.8%
COGS - Retail
50330 12 oz Retail Bags 168,280 16.5% 181,742 17.3% 194,464 18.1% 12,722 7.0%
50120 Retail K Cups 18,390 1.8% 19,126 1.8% 19,891 1.9% 765 4.0%
50340 Expired Product & other coffee 3,500 0.3% 3,745 0.4% 4,063 0.4% 318 8.5%
50600 Other Products&Shipping 86,000 8.4% 89,010 8.5% 93,015 8.7% 4,005 4.5%
Total COGS - Retail 276,170 27.0% 293,623 27.9% 311,434 29.1% 17,811 6.1%
Total COGS $ 651,891 63.8% $ 680,861 64.8% $ 713,370 66.6% 32,509 4.8%
Total SG&A Expenses 367,500 36.0% 373,726 35.6% 373,726 34.9% - 0.0%
Net Profits $ 2,343 0.2% $ (3,432) -0.3% $ (15,289) -1.4% (11,857) 345.5%
Donations to Youth 2,343 0.2% - 0.0% - 0.0% - #DIV/0!
Net Income or Loss $ - 0.0% $ (3,432) -0.3% $ (15,289) -1.4% (11,857) 345.5%
American Journal of Management Vol. 16(4) 2016 79REFERENCES
Goldschein, E. (2011, November 14th). Eleven incredible facts about the coffee industry. Retrieved from
Business Insider Magazine: http://www.businessinsider.com/facts-about-the-coffee-industry-
2011-11#looking-for-other-sources-of-energy-13
Thurston, R. W. (2013). Coffee: A Comprehensive Guide to the Bean, the Beverage and the Industry.
Plymouth, England: Rowan and Littlefield.
80 American Journal of Management Vol. 16(4) 2016You can also read