Comparative analysis of chloroplast genomes of kenaf cytoplasmic male sterile line and its maintainer line - Nature
←
→
Page content transcription
If your browser does not render page correctly, please read the page content below
www.nature.com/scientificreports
OPEN Comparative analysis of chloroplast
genomes of kenaf cytoplasmic
male sterile line and its maintainer
line
Danfeng Tang1,2,3*, Fan Wei2,3 & Ruiyang Zhou1*
Kenaf is a great source of bast fiber and possesses significantly industrial interests. Cytoplasmic
male sterility (CMS) is the basis of heterosis utilization in kenaf. Chloroplast, an important organelle
for photosynthesis, could be associated with CMS. To understand the phylogenetic position and
molecular basis of kenaf CMS from the perspective of chloroplast, the chloroplast (cp) genomes of the
CMS line P3A and its maintainer line P3B were characterized and their comparative analysis was also
performed. In this study, the chloroplast genomes of P3B and P3A were sequenced with 163,597 bp
and 163,360 bp in length, respectively. A total of 131 genes including 85 protein coding genes (PCGs),
38 transfer RNA (tRNA) genes, and 8 ribosome RNA (rRNA) genes were annotated in P3B, while 132
genes containing 83 PCGs, 41 tRNA genes, and 8 rRNA genes were found in P3A. The phylogenetic
tree revealed that kenaf was closely related to Hibiscus syriacus and Abelmoschus esculentus. Further
analysis of single nucleotide polymorphism (SNP) and insertion and deletion (InDel) showed that
compared with P3B, a total of 22 SNPs and 53 InDels were detected in gene coding region, gene
intron, and intergenic regions of P3A. Remarkably, a total of 9 SNPs including 6 synonymous SNPs
and 3 nonsynonymous SNPs were found in psbK, atpA, rpoC2, atpB, rpl20, clpP, rpoA, and ycf1. The
present study provided basic information for further study of kenaf CMS mechsnism.
Hibiscus genus plants belong to the Malvaceae family of angiosperms to which other genera such as Sterculia,
Dombeya, and Pavonia also belong. Kenaf (Hibiscus cannabinus L., 2n = 2x = 36) is a member of the Hibiscus
genus with potential industrial and commercial interests and identified to be an excellent source of cellulosic
fiber originated from bast or stalk for paper industries1,2. In addition, uses of kenaf fiber are not only limited
to textile, but also equally important for new materials industries, such as building materials, adsorbents, and
composites using new and recycled plastics, etc.3. In the recent past, kenaf seeds have been proved to be potential
uses in chemical and bio-energy i ndustries4,5.
Chloroplasts are present in photosynthetically active green t issues6,7 and display a conserved structure of a
circular double-stranded DNA m olecule8. Cytoplasmic male sterility (CMS) is an important agronomic character,
reeding9. Since the discovery of kenaf CMS, achievements have been made
which is widely utilized for F1 hybrid b
on the mechanism of CMS in kenaf. Up to now, several studies are performed on kenaf CMS m echanism10. How-
ever, the exact mechanism of kenaf CMS has not been fully elucidated. It is generally believed that cytoplasmic
male sterility is closely related to mitochondria. Nevertheless, studies also demonstrated that the chloroplasts
might be associated with plant C MS6,11,12. Therefore, in the analyses of the molecular mechanism of kenaf CMS,
we should pay attention to the chloroplast genome. However, at present, little is known about the chloroplast
genome information of kenaf CMS line and its maintainer line as well as the relationship between the chloroplast
genome and kenaf CMS.
Here, we reported the complete cp genome sequences of the kenaf CMS line P3A and its maintainer line P3B
by employing the Illumina Hiseq and PacBio platforms. The comparative analysis of the chloroplast genomes
among Malvales was performed. SNP and Indel between the two lines were also detected, analyzed, and validated.
1
College of Agriculture, Guangxi University, Nanning 530004, China. 2Guangxi Key Laboratory of Medicinal
Resources Protection and Genetic Improvement, Guangxi Botanical Garden of Medicinal Plants, Nanning 530023,
China. 3These authors contributed equally: Danfeng Tang and Fan Wei. *email: tdfmanuscript@163.com;
ruiyangzhou@aliyun.com
Scientific Reports | (2021) 11:5301 | https://doi.org/10.1038/s41598-021-84567-1 1
Vol.:(0123456789)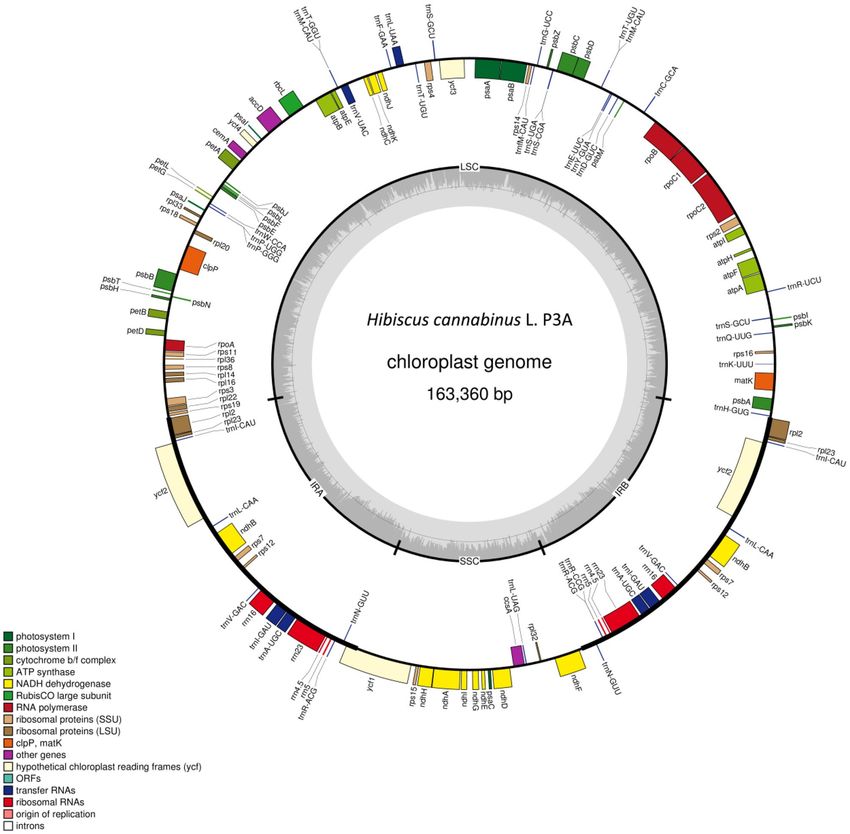
www.nature.com/scientificreports/

                                            Figure 1.  Circular gene map of Hibiscus cannabinus maintainer line (P3B). Genes drawn within the circle are
                                            transcribed clockwise, while those drawn outside are transcribed counter clockwise. Genes are colour-coded
                                            according to their functional groups.

                                            This study characterized the chloroplast genomes of P3A and P3B and unveiled their discrepancies, which pro-
                                            vided basic data for further study of kenaf CMS mechanism.

                                            Results
                                            Genome sequencing and assembly.                The DNA bands of P3A and P3B were clear and the DNA was free
                                            of protein, pigment, and other impurities (Supplementary Fig. S1). In addition, OD260/280 and OD260/230
                                            were about 1.8 and 2.0, respectively. It was indicated that the DNA quality, concentration, and total amount of
                                            DNA met the requirements of subsequent experiments (Supplementary Table S1). Then the chloroplast genomes
                                            of kenaf CMS line P3A and its maintainer line P3B were sequenced using Illumina Hiseq and PacBio platforms.
                                            About 6.3G and 3.7G raw data were generated while 6.1G and 3.5G clean data were produced in P3B and P3A,
                                            respectively. Q30 ratio reached 95.31% and 94.12% in P3B and P3A, respectively, indicating that the data was
                                            reliable (Supplementary Table S2).
                                                The chloroplast genomes of P3B and P3A were assembled into circular molecule with a total length of
                                            163,597 bp (Fig. 1) and 163,360 bp (Fig. 2), respectively. The chloroplast genome of P3B was 237 bp longer than

          Scientific Reports |   (2021) 11:5301 |               https://doi.org/10.1038/s41598-021-84567-1                                                 2

Vol:.(1234567890)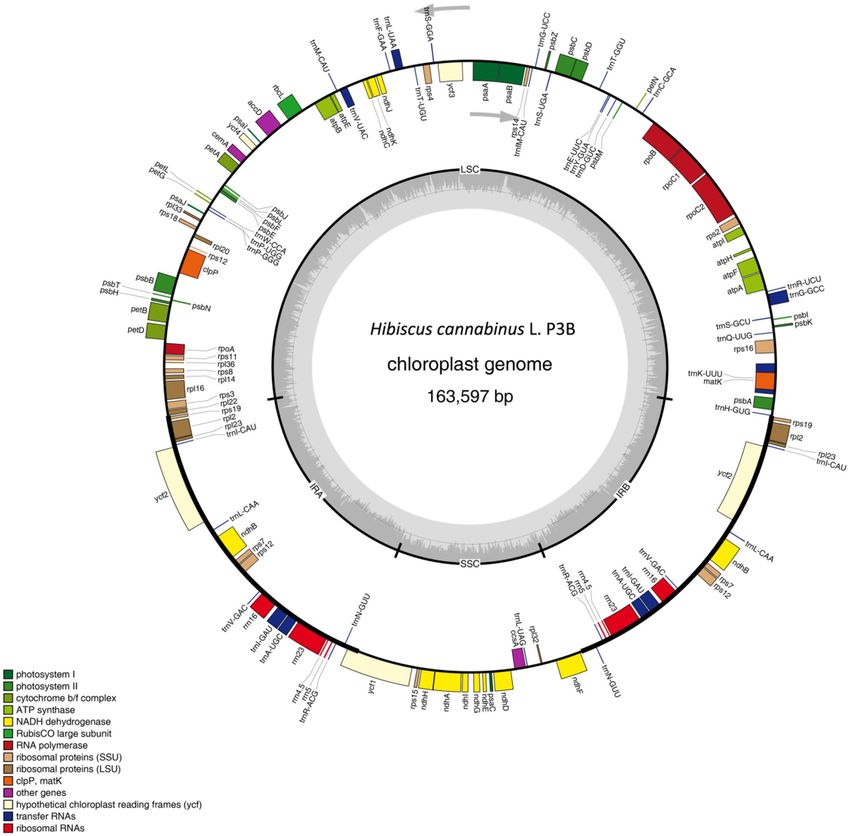
www.nature.com/scientificreports/
Figure 2. Circular Gene map of Hibiscus cannabinus CMS line (P3A).
that of P3A. The assembled genome sequences were deposited in GenBank with accession number MW446503
(P3B) and MW446504 (P3A).
General features of kenaf P3B and P3A chloroplast genomes. In this study, the gene number, gene
total length, gene average length, gene length/genome, and GC content were noted as 85, 79151 bp, 931 bp,
48.38%, and 36.55% in P3B, respectively. However, in P3A all those were recorded as 83, 87032 bp, 1049 bp,
53.28, and 36.57%, respectively (Table 1; Supplementary Table S3). The chloroplast genomes of P3B and P3A
were observed to contain 38 and 41 tRNA genes, respectively. Each chloroplast genome had 8 rRNA genes (Sup-
plementary Table S4). Two protein coding genes, rps19-D2 and petN, were absent and three additional tRNA
genes were observed in P3A.
Comparative chloroplast genome analysis. Although the coding region was found to be more highly
conserved than the non-coding region, the coding region of kenaf chloroplast genome was still different from
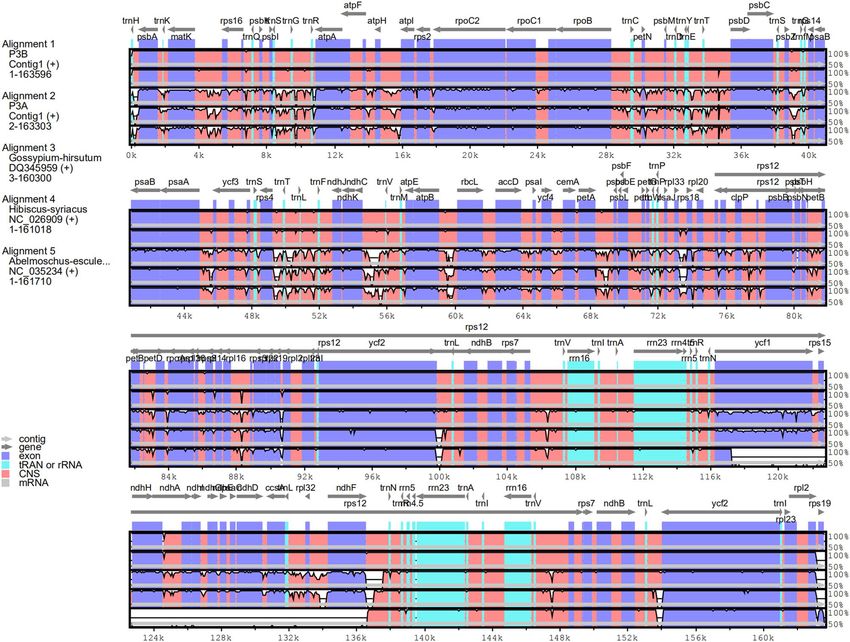
that of other three genomes (Fig. 3). The LSC-IRB-SSC-IRA boundary regions were compared within four
closely related chloroplast genomes, P3B, P3A, Abelmoschus esculentus, and Gossypium hirsutum (Fig. 4). The
rps19 gene of P3B was located in IRa and IRb regions, while it was shifted to LSC region in P3A. The ycf1 gene
was extended from the IRa to the LSC region in P3B, P3A, and Gossypium hirsutum. However, ycf1 was found
Scientific Reports | (2021) 11:5301 | https://doi.org/10.1038/s41598-021-84567-1 3
Vol.:(0123456789)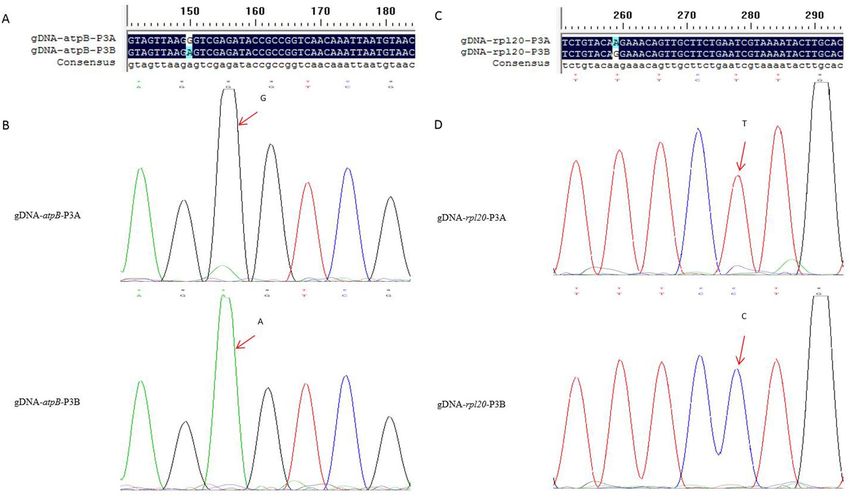
www.nature.com/scientificreports/
Category Gene group Gene name
psaA
Subunits of photosystem I psaB psaC psaI psaJ ycf3
ycf4
psbA psbB psbC psbD psbE psbF
Subunits of photosystem II psbH psbI psbJ
psbK psbL psbM
psbN psbT psbZ
Genes for photosynthesis
Subunits of ATP synthase atpA atpB atpE atpF atpH atpI
Subunits of cytochrome petA
petB petD petG petL petN*
Large subunit of Rubisco rbcL
ndhA ndhB ndhB-D2 ndhC ndhD ndhE
Subunits of NADH dehydrogenase
ndhF ndhG ndhH ndhI ndhJ ndhK
rps2 rps3 rps4 rps7 rps7-D2 rps8
Small subunit of ribosome rps11 rps12 rps12-D2
rps14 rps15 rps16
rps18 rps19 rps19-D2*
Self-replication
rpl2 rpl2-D2 rpl14 rpl16 rpl20
Large subunit of ribosome
rpl23 rpl23-D2 rpl32 rpl33 rpl22
rpl36
DNA-dependent RNA polymerase rpoA rpoB rpoC1 rpoC2
Maturase matK
Envelope membrane protein cemA
Subunit of acetyl-CoA accD
Other genes C-type cytochrome synthesis gene ccsA
Protease clpP
Conserved hypothetical chloroplast reading
ycf1 ycf2 ycf2-D2
frames
Table 1. List of protein-coding genes present in Hibiscus cannabinus. L (P3B) chloroplast genome.
“*”represented genes were absent in cp genome of P3A.
in the junction of IRb/SSC in Abelmoschus esculentus. At the IRb/SSC boundary, the ndhF was observed with
107 bp, 229 bp, and 164 bp gap, respectively in P3B, P3A, and Gossypium hirsutum, which was located in SSC
region of Abelmoschus esculentus. trnN-GUUgene was identified in IRb region with 1276 bp and 1273 bp apart
from the IRb/LSC junctions of P3B and P3A, respectively, while was shifted to IRa region in Abelmoschus escu-
lentus. trnH-GUG gene was at the junction of IRb/LSC in P3B and 79 bp apart from the IRb/LSC junction in
P3A.
Phylogenetic analysis. To analyze the phylogenetic position of kenaf within Malvales, 19 species of Mal-
vales derived from four families, Malvaceae, Sterculiacaea, Bombacacaea, and Tiliaceae were aligned (Fig. 5). All
17 nodes were resolved well and reliable based on bootstrap value: 16 had bootstrap support of 100% and only
1 harbored the support of 99%. The phylogenetic tree showed that all the 19 species were classified into two
clades. One clade included Sterculiacaea, Bombacacaea, and Tiliaceae families. Kenaf, Abelmoschus esculentus,
and Hibiscus syriacus were clustered into the other clade, indicating that kenaf was more closely related to Hibis-
cus syriacus and Abelmoschus esculentus than cotton.
SNPs analysis between P3A and P3B. To detect the cpDNA differences between the CMS line P3A
and its maintainer line P3B, setting P3B as a reference sequence, the two cp genomes were aligned for SNPs
analysis. Although the chloroplast genomes of P3A and P3B showed high homology, structural variation still
existed (Supplementary Fig. S2). Further analysis showed that a total of 22 SNPs were detected and located in
gene coding region, gene intron region, and intergenic region (Fig. 6). As shown in Table 2, a total of 9 SNPs in
gene coding region were located in psbK, atpA, rpoC2, atpB, rpl20, clpP, rpoA, and ycf1, including 6 synonymous
SNPs and 3 nonsynonymous SNPs (Fig. 7A). Among these 3 nonsynonymous SNPs, the mutation of atpB, rpl20,
and ycf1 lead to amino acid changes. Moreover, 13 synonymous SNPs were found in intron and gene intergenic
regions of P3A (Table 3). Of these, 2 SNPs were located in intron and 11 were in intergenic region.
Indel analysis between P3A and P3B. As for Indels, there were 53 Indel events, including 24 insertions
and 29 deletions (Fig. 8) with different insertion and deletion size in P3A (Fig. 7B). All the 53 Indels were absent
in the gene coding region and were distributed in the intergenic region of P3A (Table 4).
Verification of the high‑throughput sequencing results. To verify the accuracy of high-through-
put sequencing results, two genes, atpB and rpl20 were randomly selected for cloning and Sanger sequencing.
Results showed that the sequences of atpB and rpl20 existed differences between P3A and P3B at the DNA level.
The differential bases were at the position of 151th bp of atpB and 260th bp of rpl20 (Fig. 9A,C). Further analy-
Scientific Reports | (2021) 11:5301 | https://doi.org/10.1038/s41598-021-84567-1 4
Vol:.(1234567890)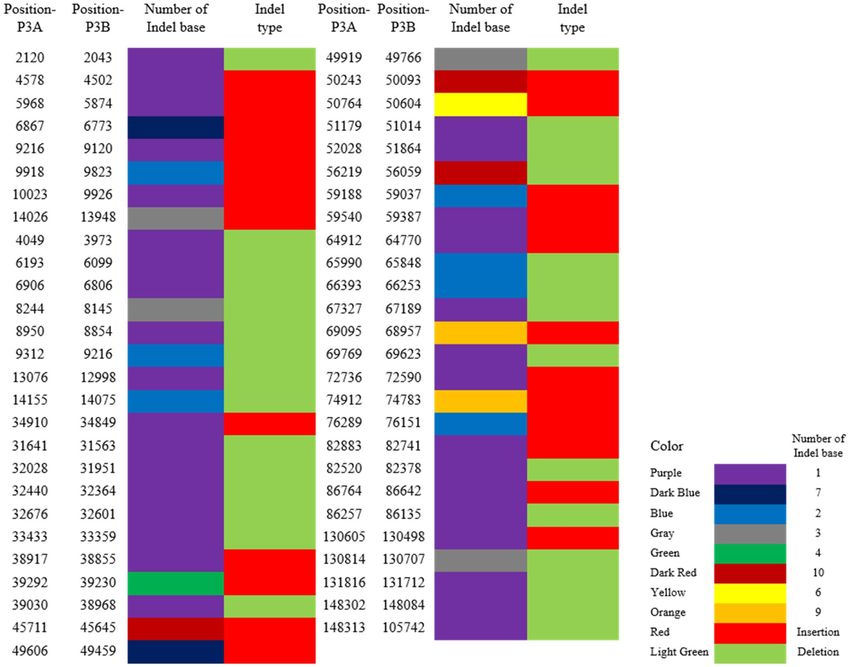
www.nature.com/scientificreports/
Figure 3. Comparison of the cp genome sequence of P3B, P3A, Hibiscus syriacus Linn, Abelmoschus esculentus,
and Gossypium hirsutum.
sis of the sequencing peak map exhibited that G-A and T-C mutation types were detected in atpB and rpl20,
respectively (Fig. 9B,D). It was the same with the results listed in Table 2, inferring that the high-throughput
sequencing results were reliable.
Discussion
The chloroplast is a very important plant organelle that has its genome and plays a crucial role in generating
energy through p hotosynthesis9. Chloroplast genome has been used as ideal research models, particularly for
phylogeny , DNA barcoding14,15, species conservation, and genome evolution16 because of the highly conserva-
13
tive structure. In the present study, we presented the complete nucleotide sequence of kenaf chloroplast genomes
using the Illumina Hiseq and PacBio sequencing platforms. The chloroplast genomes of P3A and P3B were fully
characterized. As shown in Figs. 1 and 2, the kenaf chloroplast genome was a typical circle DNA, similar to those
from Malvaceae13,17,18. Moreover, the length of the chloroplast genome of kenaf P3B and P3A was 163,597 bp
(Fig. 1) and 163,360 bp (Fig. 2), respectively. They were larger than those of Malvaceae plants13,17,18. In addition,
a total of 131 and 132 genes, including 85 and 83 protein coding genes, 38 and 41 tRNA genes, and 8 rRNA and
8 rRNA were detected in P3B and P3A, respectively (Table 1). The gene number of kenaf was more than Hibiscus
syriacus that also belonged to the Hibiscus genus and contained 81 protein-coding genes, 29 tRNA genes, and
4 rRNA genes17. The genome size differences within the species mentioned above might be due to the species
differences.
Although the overall structure, genome size, gene number, and gene order of the chloroplast genome were
conserved, the junctions between SSC and IR regions were usually different in the chloroplast genomes of higher
plant. The border regions of LSC/IRa, IRa/SSC, SSC/IRb, and IRb/LSC were highly variable with many nucleotide
variations in the chloroplast genomes of closely related s pecies19. In this study, we compared the IR boundary
regions of the chloroplast genome from three species. The organization of the kenaf chloroplast genome with a
pair of IR regions separated by the SSC and LSC regions was the same with most sequenced angiosperm chlo-
roplast genomes, emphasizing the highly conserved nature of plant chloroplast genomes20. However, the border
of the kenaf chloroplast genome was a little different from that of other chloroplast genomes (Fig. 4), which
probably contributed to the chloroplast genome size differences within Malvaceae species.
Scientific Reports | (2021) 11:5301 | https://doi.org/10.1038/s41598-021-84567-1 5
Vol.:(0123456789)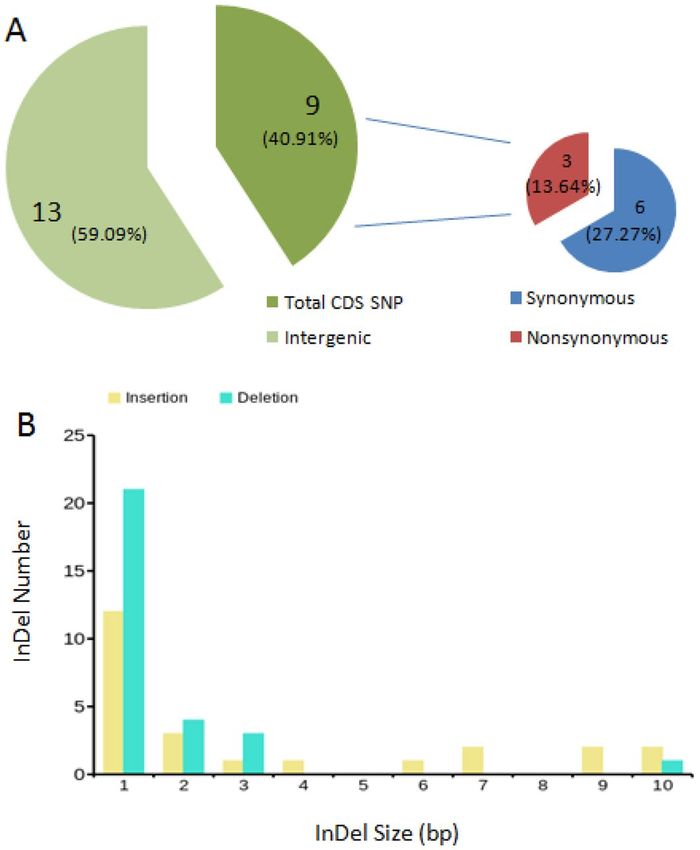
www.nature.com/scientificreports/
Figure 4. Comparison of the borders of the LSC, SSC, and IR regions of P3B, P3A, Abelmoschus esculentus, and
Gossypium hirsutum cp genomes.
It is generally believed that mitochondrial genome rearrangement and generation of new open reading frames
(ORFs) changed the transcription and translation products of mitochondrial DNA, resulting in CMS21,22. Unlike
mitochondria, little attention has been paid to the relationship between plant chloroplast and CMS, especially in
eterosis23 and may be involved in plant
kenaf. Chloroplast, a special subcellular organelle, is closely linked to h
6,11,12
CMS . Li and Liu reported that there were some relations between cpDNA and CMS in maize, rape, and
wheat24. In the rice CMS line, Hou et al. found differential fragments between the CMS line and its maintainer
using AFLP molecular marker technology25. Tang et al. revealed different SNPs and Indels models in the rice CMS
line6. Recently, the chloroplast genome size and component between CMS-C cytoplasm and normal cytoplasm
were highly consistent, but Indels or SNPs were also detected between the male sterile lines and maintainer lines
of maize26. In our investigation, 22 SNPs and 53 Indels were found between the cp genomes of P3B and P3A,
which were located in gene coding region, gene intron, and intergenic region (Tables 2, 3, 4). It was consistent
with the previous studies mentioned a bove6,26. In particular, there were a total of 9 SNPs in the gene coding
region, which were located in psbK, atpA, rpoC2, rpl20, ycf1, atpB, clpP, and rpoA, respectively. It was found
that most of these genes were related to the photosynthetic system or photosynthesis. Furthermore, within the
nonsynonymous SNPs, phenylalanine mutated to leucine in ycf1, serine changed to glycine in atpB, and argi-
nine altered to lysine in rpl20 (Table 2). Therefore, the cpDNA or chloroplast protein discrepancy might affect
photosynthesis and energy metabolism and it was inferred that there might be some relationship between the
chloroplast and kenaf CMS. CMS is the pollen abortion caused by nuclear–cytoplasm i nteraction27. Cytoplasmic
genetic system included chloroplast and mitochondria. Nucleus, chloroplast, and mitochondria were not only
independent, but also interrelated, infiltrated and influenced each other28. In the long-term evolution process,
plants formed a coordinated relationship among the nucleus, chloroplast, and mitochondria, thus ensuring the
normal growth and development of plants. However, once the coordination was broken during the pollen devel-
opment, the normal information exchange between the nuclear and cytoplasm changed, then probably resulting
in pollen a bortion29. In other words, the coordination among the nucleus, chloroplast, and mitochondria of kenaf
pollen cells might be broken due to the deviant cpDNA thus leading to the CMS of kenaf.
Conclusions
We sequenced and characterized the chloroplast genomes of kenaf CMS line P3A and its maintainer line P3B.
The bio-informatics comparison analysis of chloroplast genomes among Malvales was performed. SNP and
Indel between the two lines were also detected, analyzed, and validated. Our findings revealed the differences in
cpDNA between P3B and P3A, which provided basic information for the further study of kenaf CMS mechsnism.
Scientific Reports | (2021) 11:5301 | https://doi.org/10.1038/s41598-021-84567-1 6
Vol:.(1234567890)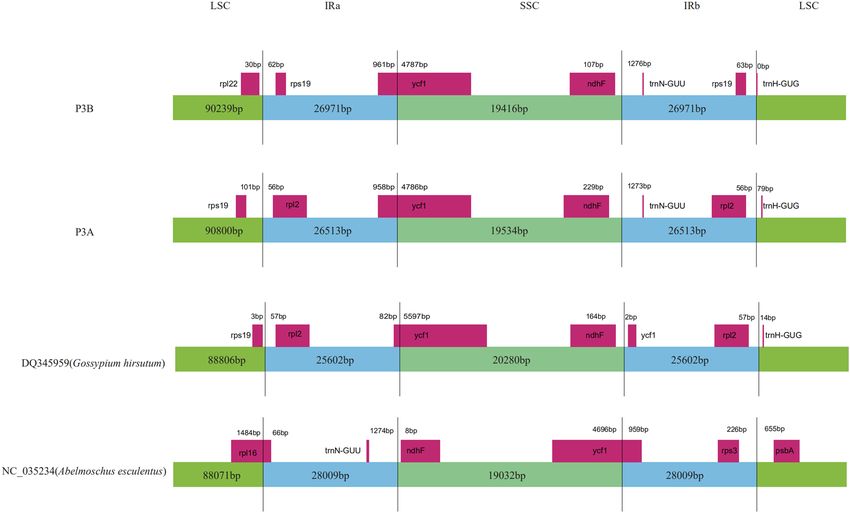
www.nature.com/scientificreports/
Figure 5. Molecular phylogenetic tree of 19 species of Malvales.
Materials and methods
Sample collection. Kenaf CMS line P3A and its maintainer line P3B were used in the present study. Seeds
of both the cultivars were sown and cultivated in half-strength Hoagland solution as described in our previous
study30. Leaves from 25-day-old seedlings were collected and frozen with liquid nitrogen immediately.
Chloroplast DNA (cpDNA) sequencing and genome assembly. Approximately 5 g of fresh leaves
were harvested for DNA isolation using an improved extraction method31. After DNA isolation, 1 μg of purified
DNA was fragmented and used to construct short-insert libraries according to the manufacturer’s instructions
(Illumina), then sequenced on the Illumina Hiseq 4000 and PacBio p latforms32.
Prior to assembly, raw reads were filtered. This filtering step was performed to remove the reads with adaptors,
the reads showing a quality score below 20 (Q < 20), the reads containing a percentage of uncalled based (“N”
characters) equal or greater than 10%, and the duplicated sequences. The chloroplast genome was reconstructed
using a combination of de novo and reference-guided assemblies, and the following three steps were used to
assemble chloroplast g enomes33. First, the filtered reads were assembled into contigs using software SOAPde-
novo2.0434. Second, contigs were aligned to the reference genome of Hibiscus syriacus (Accession: NC_026909.1)
using BLAST, and aligned contigs (≥ 80% similarity and query coverage) were ordered according to the reference
genome. Third, clean reads were mapped to the assembled draft chloroplast genome to correct the wrong bases,
and the majority of gaps were filled through the local assembly.
Genome annotation. The online DOGMA tool35 with default parameters was used to predict protein-
coding genes, transfer RNA (tRNA) genes, and ribosome RNA (rRNA) genes. A whole chloroplast genome
blast search (E-value ≤ 1e−5, minimal alignment length percentage ≥ 40%)36 was performed against 5 databases,
including Kyoto Encyclopedia of Genes and Genomes (KEGG)37–39, Clusters of Orthologous Groups (COG)40,41,
Non-Redundant Protein Database (NR), Swiss-Prot42, and Gene Ontology (GO)43 databases. The circular chlo-
roplast genome maps of P3A and P3B were drawn using OrganellarGenomeDRAWv1.244.
Scientific Reports | (2021) 11:5301 | https://doi.org/10.1038/s41598-021-84567-1 7
Vol.:(0123456789)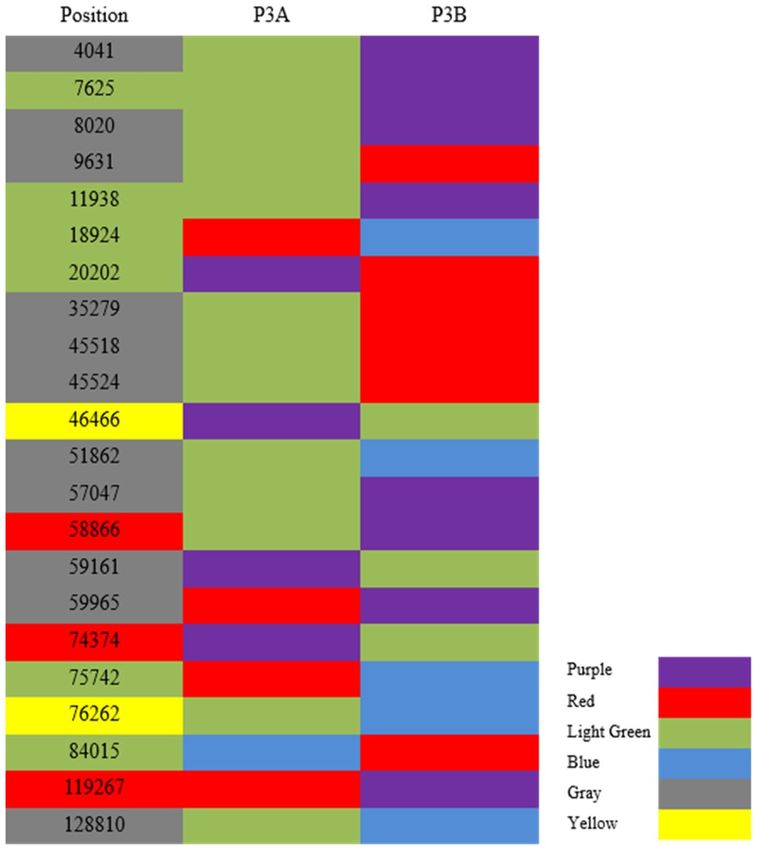
www.nature.com/scientificreports/
Figure 6. SNPs in gene coding region, gene intron and intergenic region between P3A and P3B. Note:
DNA bases of P3A and P3B, guanosine (purple), thymine (red), adenine (light green), cytosine (blue). Position
(red), nonsynonymous SNP in the CDS; Position (light green), synonymous SNP in the CDS; Position (yellow),
SNP in the intron; Position (gray), SNP in the intergenic. Excel software was used for data processing and graph
analysis.
Position Ref_base ↔ P3A_base Codon mutate aa mutate Mutate type Gene id Position start Position end
7,625 A↔G TTA ↔ TTG L↔L Synonymous psbK 7,548 7,733
11,938 A↔G ACA ↔ ACG T↔T Synonymous atpA 10,861 12,384
18,924 T↔C TGT ↔ TGC C↔C Synonymous rpoC2 17,859 22,040
20,202 G↔T CTG ↔ CTT L↔L Synonymous rpoC2 17,859 22,040
58,866 A↔G AGT ↔ GGT S↔G Nonsynonymous atpB 57,542 59,016
74,374 G↔A AGG ↔ AAG R↔K Nonsynonymous rpl20 74,280 74,633
75,742 T↔C GCT ↔ GCC A↔A Synonymous clpP 75,703 75,930
84,015 C↔T GGC ↔ GGT G↔G Synonymous rpoA 83,997 84,980
119,267 T↔G TTT ↔ TTG F↔L Nonsynonymous ycf1 116,250 121,997
Table 2. SNPs in gene coding region of P3A.
Comparative chloroplast genome analysis. The complete chloroplast genomes of Hibiscus cannabinus
(P3B and P3A) were compared with those of three other species, Hibiscus syriacus Linn, Abelmoschus esculentus,
and Gossypium hirsutum using the mVISTA program in a Shuffle-LAGAN mode45. The contraction/expansion
regions of the inverted repeat (IR) were compared among P3B, P3A, Abelmoschus esculentus, and Gossypium
hirsutum. P3B was set as a reference for SNP and indel analysis between P3B and P3A.
Phylogenetic analysis. The 19 completed chloroplast genome sequences representing Malvales plants
were downloaded from the NCBI (Supplementary Table S5). Phylogenetic analysis was conducted based on
maximum likelihood (ML) analysis using the general time-reversible invariant-sites (GTR + I) nucleotide sub-
stitution model with the default parameters in PhyML v3.0 (http://www.atgc-montpellier.fr/phyml/). The boot-
strap probability of each branch was calculated by 1000 replications.
Scientific Reports | (2021) 11:5301 | https://doi.org/10.1038/s41598-021-84567-1 8
Vol:.(1234567890)www.nature.com/scientificreports/
Figure 7. Statistical analysis of SNPs and Indels in P3A. (A) SNPs statistical analysis of P3A. (B) Indels
statistical analysis. Excel and PPT software were used for data processing and graph analysis.
Position Reference base P3A base Gene start Gene end Gene location
46,466 G A 45,753 47,879 Intron
76,262 A C 75,703 77,909 Intron
4,041 A G 2,208 3,722 Intergenic
8,020 A G 8,182 8,292 Intergenic
9,631 A T 10,861 12,384 Intergenic
35,279 A T 35,399 36,460 Intergenic
45,518 A T 45,753 47,879 Intergenic
45,524 A T 45,753 47,879 Intergenic
51,862 A C 52,785 53,261 Intergenic
57,047 A G 57,117 57,518 Intergenic
59,161 G A 57,542 59,016 Intergenic
59,965 T G 60,171 61,625 Intergenic
128,810 A C 128,533 128,778 Intergenic
Table 3. SNPs in gene intron and intergenic region of P3A.
SNP detection. The different sites between the sample sequence (P3A) and the reference sequence (P3B)
were detected using M UMmer46 software. The potential SNP sites were checked through preliminary filtering.
After that, the 100 bp sequences on both sides of the SNP sites of the reference sequence were extracted, and
then BLAT47 (version: 35, http://genome.ucsc.edu) software was used and verified by comparing the extracted
sequences with the assembly results. If the alignment length is less than 101 bp, it is considered as untrusted
SNP, which will be removed. If the alignment is repeated many times, it is considered as repeated SNP, which will
also be removed. Subsequently, BLAST36, RepeatMasker48, and TRF49 software were used to detect the repeated
sequence area of the reference sequence, filter the SNP located in the repeated area, and finally obtain reliable SNP.
Scientific Reports | (2021) 11:5301 | https://doi.org/10.1038/s41598-021-84567-1 9
Vol.:(0123456789)www.nature.com/scientificreports/
Figure 8. Indels in gene intron and intergenic regions between P3A and P3B. Excel software was used for data
processing and graph analysis.
Indel detection. Using LASTZ50,51 software, we compared the sample and reference sequences and the best
alignment results were selected through the processing of axt_correction, axtsort and axtbest programs, and the
preliminary Indel results were obtained. Then, 150 bp upstream and downstream of the Indel site of the refer-
ence sequence were compared with the sequencing reads of the sample by B WA52 (http://bio-bwa.sourceforg
e.net/) software and S AMtools53,54 (http://samtools.sourceforge.net/). Finally, the reliable Indel was obtained by
filtration.
DNA isolation and PCR validation. The leaves used for chloroplast sequencing were used for DNA
extraction and PCR validation. DNA isolation was performed according to the CTAB protocol55 with minor
modifications. PCR amplification was conducted according to the following procedures: initial denaturation at
95 °C for 3 min; 30 cycles of denaturation at 95 °C for 30 s, annealing at 50–60 °C for 1–2 min, extension at 72 °C
for 1 min; and final extension at 72 °C for 5 min. The primer information was listed in Supplementary Table S6.
For PCR reactions, each 25 μL reaction mixture contained 12.5 μL of 2 × Phanta Max Master Mix (Vazyme,
China), 1.5 μL of primer (10 ppmol, forward primer and reverse primer each 0.75 μL), 1.5 μL of genomic DNA,
and 9.5 μL of d
dH2O. Then, PCR products were recycled, cloned, and sequenced.
Scientific Reports | (2021) 11:5301 | https://doi.org/10.1038/s41598-021-84567-1 10
Vol:.(1234567890)www.nature.com/scientificreports/
Indel type Sample Indel start Sample Indel end Ref start Ref end Indel sequence
Deletion 2,120 2,120 2,043 2,044 A
Insertion 4,578 4,579 4,502 4,502 A
Insertion 5,968 5,969 5,874 5,874 A
Insertion 6,867 6,874 6,773 6,773 TTAGAAT
Insertion 9,216 9,217 9,120 9,120 T
Insertion 9,918 9,920 9,823 9,823 TT
Insertion 10,023 10,024 9,926 9,926 T
Insertion 14,026 14,029 13,948 13,948 TTT
Deletion 4,049 4,049 3,973 3,974 A
Deletion 6,193 6,193 6,099 6,100 T
Deletion 6,906 6,906 6,806 6,807 A
Deletion 8,244 8,244 8,145 8,148 AAA
Deletion 8,950 8,950 8,854 8,855 A
Deletion 9,312 9,312 9,216 9,218 AA
Deletion 13,076 13,076 12,998 12,999 T
Deletion 14,155 14,155 14,075 14,077 TT
Insertion 34,910 34,911 34,849 34,849 T
Deletion 31,641 31,641 31,563 31,564 T
Deletion 32,028 32,028 31,951 31,952 A
Deletion 32,440 32,440 32,364 32,365 T
Deletion 32,676 32,676 32,601 32,602 A
Deletion 33,433 33,433 33,359 33,360 T
Insertion 38,917 38,918 38,855 38,855 A
Insertion 39,292 39,296 39,230 39,230 AAAT
Deletion 39,030 39,030 38,968 38,969 A
Insertion 45,711 45,721 45,645 45,645 AATAGAATTT
Insertion 49,606 49,613 49,459 49,459 ATAATAT
Deletion 49,919 49,919 49,766 49,769 AAA
Insertion 50,243 50,253 50,093 50,093 TATTTATTAT
Insertion 50,764 50,770 50,604 50,604 AAATAA
Deletion 51,179 51,179 51,014 51,015 A
Deletion 52,028 52,028 51,864 51,865 T
Deletion 56,219 56,219 56,059 56,069 TATATATATT
Insertion 59,188 59,190 59,037 59,037 TT
Insertion 59,540 59,541 59,387 59,387 T
Insertion 64,912 64,913 64,770 64,770 T
Deletion 65,990 65,990 65,848 65,850 TT
Deletion 66,393 66,393 66,253 66,255 AA
Deletion 67,327 67,327 67,189 67,190 T
Insertion 69,095 69,104 68,957 68,957 TAAATAGAG
Deletion 69,769 69,769 69,623 69,624 T
Insertion 72,736 72,737 72,590 72,590 T
Insertion 74,912 74,921 74,783 74,783 TTTTCTAGG
Insertion 76,289 76,291 76,151 76,151 TT
Insertion 82,883 82,884 82,741 82,741 T
Deletion 82,520 82,520 82,378 82,379 A
Insertion 86,764 86,765 86,642 86,642 T
Deletion 86,257 86,257 86,135 86,136 T
Insertion 130,605 130,606 130,498 130,498 A
Deletion 130,814 130,814 130,707 130,710 TTA
Deletion 131,816 131,816 131,712 131,713 A
Deletion 148,302 148,302 148,084 148,085 A
Deletion 148,313 148,313 105,742 105,743 T
Table 4. Indel statistics between P3B and P3A.
Scientific Reports | (2021) 11:5301 | https://doi.org/10.1038/s41598-021-84567-1 11
Vol.:(0123456789)www.nature.com/scientificreports/
Figure 9. Cloning and sequencing results of atpB and rpl20. DNAMAN (V6.0.3.99 version) and PPT software
were used for graph analysis.
Received: 29 June 2020; Accepted: 11 February 2021
References
1. Danalatos, N. G. & Archontoulis, S. V. Growth and biomass productivity of kenaf (Hibiscus cannabinus, L.) under different agri-
cultural inputs and management practices in central Greece. Ind. Crops 32, 231–240 (2010).
2. Tang, D. F. et al. Polyethylene glycol induced drought stress strongly influences seed germination, root morphology and cytoplasm
of different kenaf genotypes. Ind. Crop Prod. 137, 180–186 (2019).
3. Ramesh, M. Kenaf (Hibiscus cannabinus L.) fibre based bio-materials: A review on processing and properties. Prog. Mater. Sci.
78–79, 1–92 (2016).
4. Agbaje, G. O. Profitability of kenaf seed production as affected by different agronomic practices. J. Food Agric. Environ. 8, 229–233
(2010).
5. Cosentino, S. L., Venera, C., Cristina, P., Mariadaniela, M. & D’Agosta, G. M. Agronomic, energetic and environmental aspects of
biomass energy crops suitable for Italian environments. Ital. J. Agron. Riv. Agron. 2, 81–95 (2008).
6. Tang, D. F. et al. Analysis of chloroplast differences in leaves of rice isonuclear alloplasmic lines. Protoplasma 255, 863–871 (2018).
7. Jiang, G. F., Hinsinger, D. D. & Strijk, J. S. Comparison of intraspecific, interspecific and intergeneric chloroplast diversity in Cycads.
Sci. Rep. 6, 31473 (2016).
8. Terakami, S. et al. Complete sequence of the chloroplast genome from pear (Pyrus pyrifolid): Genome structure and comparative
analysis. Tree Genet. B Genomes 8, 841–854 (2012).
9. Tang, D. F., Wei, F., Kashif, M. H., Munsif, F. & Zhou, R. Y. Identification and analysis of RNA editing sites in chloroplast transcripts
of kenaf (Hibiscus cannabinus L.). 3 Biotech 9, 361 (2019).
10. Chen, P., Li, R. & Zhou, R. Y. Comparative phosphoproteomic analysis reveals differentially phosphorylated proteins regulate
anther and pollen development in kenaf cytoplasmic male sterility line. Amino Acids 50, 841–862 (2018).
11. Zhang, Y. W. et al. Photosynthesis of cytoplasmic male sterility lines with homocytonic and heteronuclear and their maintainers
of rapeseed. Chin. J. Oil Crop Sci. 34, 249–255 (2012).
12. Yuan, K. et al. Observation and comparison of chloroplast structure in hybrid and different cytoplasmic male-sterile wheat lines.
Sci. Agric. Sin. 45, 1887–1894 (2012).
13. Xu, Q. et al. Analysis of complete nucleotide sequences of 12 gossypium chloroplast genomes: Origin and evolution of allotetra-
ploids. PLoS ONE 7, e37128 (2012).
14. Dong, W. P., Liu, J., Yu, J., Wang, L. & Zhou, S. L. Highly variable chloroplast markers for evaluating plant phylogeny at low taxo-
nomic levels and for DNA barcoding. PLoS ONE 7, e35071 (2012).
15. Dong, W. P. et al. A chloroplast genomic strategy for designing taxon specific DNA mini-barcodes: A case study on ginsengs. BMC
Genet. 15, 138 (2014).
16. Dong, W. P., Xu, C., Cheng, T. & Zhou, S. L. Complete chloroplast genome of sedum sarmentosum and chloroplast genome evolu-
tion in saxifragales. PLoS ONE 8, e77965 (2013).
17. Kwon, H. Y., Kim, J. H., Kim, S. H., Park, J. M. & Lee, H. The complete chloroplast genome sequence of Hibiscus syriacus. Mito-
chondrial DNA A 27, 3668–3669 (2016).
18. Lee, S. B. et al. The complete chloroplast genome sequence of Gossypium hirsutum: Organization and phylogenetic relationships
to other angiosperms. BMC Genom. 7, 61 (2006).
Scientific Reports | (2021) 11:5301 | https://doi.org/10.1038/s41598-021-84567-1 12
Vol:.(1234567890)www.nature.com/scientificreports/
19. Li, Z. et al. The complete chloroplast genome sequence of tung tree (Vernicia fordii): Organization and phylogenetic relationships
with other angiosperms. Sci. Rep. 7, 1869 (2017).
20. Wicke, S., Schneeweiss, G. M., dePamphilis, C. W., Muller, K. F. & Quandt, D. The evolution of the plastid chromosome in land
plants: Gene content, gene order, gene function. Plant Mol. Biol. 76, 273–297 (2011).
21 Tang, D. F. et al. Identification of a novel cytoplasmic male sterile line M2BS induced by partial-length HcPDIL5-2a transformation
in rice (Oryza sativa L.). J. Plant Biol. 60, 146–153 (2017).
22. Okazaki, M., Kazama, T., Murata, H., Motomura, K. & Toriyama, K. Whole mitochondrial genome sequencing and transcriptional
analysis to uncover an RT102-type cytoplasmic male sterility-associated candidate gene derived from Oryza rufipogon. Plant Cell
Physiol. 54, 1560–1568 (2013).
23. He, G. H. et al. A common sequence difference between cytoplasmic male sterile lines and their maintainer lines existing in rice
(Oryza sativa L.) chloroplast tRNA-Leu gene region. Euphytica 131, 269–274 (2003).
24. Li, J. G. & Liu, Y. N. Chloroplast DNA and cytoplasmic male-sterility. Theor. Appl. Genet. 64, 231–238 (1983).
25. Hou, L., Yang, G. W., He, G. H., Tang, B. & Pei, Y. AFLP markers and sequence analysis in rice cytoplasmic male sterility line,
Zhenshan97A, and its maintainer line. Acta Bot. Sin. 42, 591–594 (2000).
26. Qiu, T. et al. Comparison of chloroplast genome sequence among Maize CMS-C male sterile lines and the maintainer lines. J.
Sichuan Agric. Univ. 37, 1–7 (2019).
27. Hanson, M. R. & Bentolila, S. Interactions of mitochondrial and nuclear genes that affect male gametophyte development. Plant
Cell 16(Suppl), S154–S169 (2004).
28. Li, J. G. Three genetic systems and their mutual penetration. Hereditas 6, 41–44 (1990).
29. Yuan, K. et al. Comparison of chloroplast DNA and RuBP carboxylase (rubisco) activity with K, V, T-type cytoplasmic male-sterile
wheat lines. Acta Botanica Boreali-OccidentaliaSinica 39, 472–479 (2019).
30 Kashif, M. H. et al. Comparative cytological and gene expression analysis reveals potential metabolic pathways and target genes
responsive to salt stress in Kenaf. J. Plant Growth Regul. 39, 1245–1260 (2020).
31. Mcpherson, H. et al. Capturing chloroplast variation for molecular ecology studies: A simple next generation sequencing approach
applied to a rainforest tree. BMC Ecol. 13 (2013).
32. Borgstrom, E., Lundin, S. & Lundeberg, J. Large scale library generation for high throughput sequencing authors and affiliations.
PLoS ONE 6, e19119 (2011).
33. Cronn, R. et al. Multiplex sequencing of plant chloroplast genomes using Solexa sequencing-by-synthesis technology. Nucleic
Acids Res. 36, e122 (2008).
34. Luo, R. B. et al. SOAPdenovo2: An empirically improved memory-efficient short-read de novo assembler. Gigascience. 1 (2012).
35. Wyman, S. K., Jansen, R. K. & Boore, J. L. Automatic annotation of organellar genomes with DOGMA. Bioinformatics 20, 3252–
3255 (2004).
36. Altschul, S. F., Gish, W., Miller, W., Myers, E. W. & Lipman, D. J. Basic local alignment search tool. J. Mol. Biol. 215, 403–410 (1990).
37. Kanehisa, M. A database for post-genome analysis. Trends Genet. 13, 375–376 (1997).
38. Kanehisa, M. et al. From genomics to chemical genomics: New developments in KEGG. Nucleic Acids Res. 34(Database issue),
D354–357 (2006).
39. Kanehisa, M., Goto, S., Kawashima, S., Okuno, Y. & Hattori, M. TheKEGG resource for deciphering the genome. Nucleic Acids
Res. 32, D277–D280. https://doi.org/10.1093/nar/gkh063 (2004).
40. Tatusov, R. L. et al. The COG database: an updated version includes eukaryotes. BMC Bioinform. 4 (2003).
41. Tatusov, R. L., Koonin, E. V. & Lipman, D. J. A genomic perspective on protein families. Science 278, 631–637 (1997).
42. Magrane, M. & Consortium, U. UniProt Knowledgebase: A Hub of Integrated Protein Data. Vol. 2011 Database (Oxford), (2011).
43. Ashburner, M., Ball, C. A., Blake, J. A., Botstein, D. & Cherry, J. M. Gene ontology: Tool for the unification of biology. Nat. Genet.
25, 25–29 (2000).
44. Lohse, M., Drechsel, O. & Bock, R. OrganellarGenomeDRAW (OGDRAW): A tool for the easy generation of high-quality custom
graphical maps of plastid and mitochondrial genomes. Curr. Genet. 52, 267–274 (2007).
45. Frazer, K. A., Pachter, L., Poliakov, A., Rubin, E. M. & Dubchak, I. VISTA: Computational tools for comparative genomics. Nucleic
Acids Res. 32, W273-279 (2004).
46. Kurtz, S. et al. Versatile and open software for comparing large genomes. Genome Biol 5, R12 (2004).
47. Kent, W. J. BLAT—The BLAST-like alignment tool. Genome Res. 12, 656–664 (2002).
48. Saha, S., Bridges, S., Magbanua, Z. V. & Peterson, D. G. Empirical comparison of ab initio repeat finding programs. Nucleic Acids
Res. 36, 2284–2294 (2008).
49. Benson, G. Tandem repeats finder: A program to analyze DNA sequences. Nucleic Acids Res. 27, 573–580 (1999).
50. Chiaromonte, F., Yap, V. B. & Miller, W. Scoring pairwise genomic sequence alignments. Pac. Symp. Biocomput. 7, 115–126 (2002).
51. Harris, R. S. Improved Pairwise Alignmnet of Genomic DNA. (2007).
52. Li, H. & Durbin, R. Fast and accurate short read alignment with Burrows–Wheeler transform. Bioinformatics 25, 1754–1760 (2009).
53. Li, H. A statistical framework for SNP calling, mutation discovery, association mapping and population genetical parameter
estimationn from sequencing data. Bioinformatics 27, 2987–2993 (2011).
54. Li, H., Handsaker, B., Wysoker, A., Fennell, T. & Durbin, R. 1000 Genome project data processing subgroup. Bioinformatics 25,
2078–2079 (2009).
55. Doyle, J. J. A rapid total DNA preparation procedure for fresh plant tissue. Focus 12, 13–15 (1990).
Acknowledgements
All the authors are thankful for the Natural Science Foundation of Guangxi (2018JJB130096, 2018GXNS-
FBA294016), Guangxi Innovation-Driven Development Project (GuiKe AA18242040), Modern Agro-industry
Technology Research System (CARS-16-E14, CARS-21), and Scientific Research Funding Project of Guangxi
Botanical Garden of Medicinal Plants (GuiYaoJi202011).
Author contributions
F.W. is responsible for writing-original draft, D.T. is responsible for writing-review and editing, R.Z. is respon-
sible for supervision.
Competing interests
The authors declare no competing interests.
Additional information
Supplementary Information The online version contains supplementary material available at https://doi.
org/10.1038/s41598-021-84567-1.
Scientific Reports | (2021) 11:5301 | https://doi.org/10.1038/s41598-021-84567-1 13
Vol.:(0123456789)www.nature.com/scientificreports/
Correspondence and requests for materials should be addressed to D.T. or R.Z.
Reprints and permissions information is available at www.nature.com/reprints.
Publisher’s note Springer Nature remains neutral with regard to jurisdictional claims in published maps and
institutional affiliations.
Open Access This article is licensed under a Creative Commons Attribution 4.0 International
License, which permits use, sharing, adaptation, distribution and reproduction in any medium or
format, as long as you give appropriate credit to the original author(s) and the source, provide a link to the
Creative Commons licence, and indicate if changes were made. The images or other third party material in this
article are included in the article’s Creative Commons licence, unless indicated otherwise in a credit line to the
material. If material is not included in the article’s Creative Commons licence and your intended use is not
permitted by statutory regulation or exceeds the permitted use, you will need to obtain permission directly from
the copyright holder. To view a copy of this licence, visit http://creativecommons.org/licenses/by/4.0/.
© The Author(s) 2021
Scientific Reports | (2021) 11:5301 | https://doi.org/10.1038/s41598-021-84567-1 14
Vol:.(1234567890)You can also read