Molecular Attributes Underlying Central Nervous System and Systemic Relapse in Diffuse Large B-cell Lymphoma
←
→
Page content transcription
If your browser does not render page correctly, please read the page content below
Published Ahead of Print on August 13, 2020, as doi:10.3324/haematol.2020.255950.
                                    Copyright 2020 Ferrata Storti Foundation.

Molecular Attributes Underlying Central Nervous System
and Systemic Relapse in Diffuse Large B-cell Lymphoma

by Keren Isaev, Daisuke Ennishi, Laura Hilton, Brian Skinnider, Karen L. Mungall,
Andrew J. Mungall, Mehran Bakhtiari, Rosemarie Tremblay-LeMay, Anjali Silva,
Susana Ben-Neriah, Merrill Boyle, Diego Villa, Marco A. Marra, Christian Steidl,
Randy D. Gascoyne, Ryan Morin, Kerry J. Savage, David W. Scott, and Robert Kridel

Haematologica 2020 [Epub ahead of print]

Citation: Keren Isaev, Daisuke Ennishi, Laura Hilton, Brian Skinnider, Karen L. Mungall, Andrew J.
Mungall, Mehran Bakhtiari, Rosemarie Tremblay-LeMay, Anjali Silva, Susana Ben-Neriah, Merrill
Boyle, Diego Villa, Marco A. Marra, Christian Steidl, Randy D. Gascoyne, Ryan Morin, Kerry J.
Savage, David W. Scott, and Robert Kridel. Molecular Attributes Underlying Central Nervous System
and Systemic Relapse in Diffuse Large B-cell Lymphoma.
Haematologica. 2020; 105:xxx
doi:10.3324/haematol.2020.255950

Publisher's Disclaimer.
E-publishing ahead of print is increasingly important for the rapid dissemination of science.
Haematologica is, therefore, E-publishing PDF files of an early version of manuscripts that
have completed a regular peer review and have been accepted for publication. E-publishing
of this PDF file has been approved by the authors. After having E-published Ahead of Print,
manuscripts will then undergo technical and English editing, typesetting, proof correction and
be presented for the authors' final approval; the final version of the manuscript will then
appear in print on a regular issue of the journal. All legal disclaimers that apply to the
journal also pertain to this production process.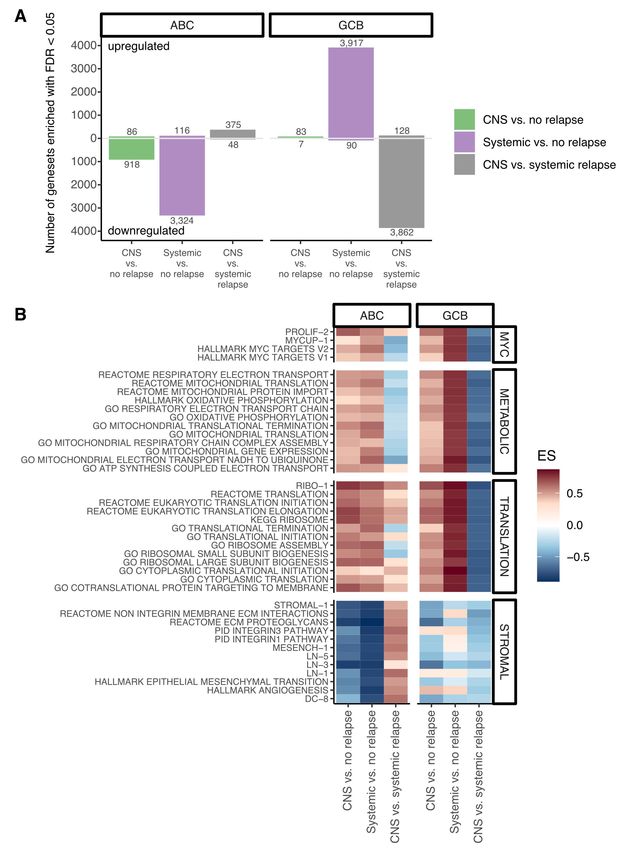
1 Molecular attributes underlying central nervous system and systemic relapse in diffuse
2 large B-cell lymphoma
3
4 Short title: CNS and systemic relapse in DLBCL
5
6 Keren Isaev,1 Daisuke Ennishi,2 Laura Hilton,3 Brian Skinnider,2 Karen L. Mungall,4 Andrew J.
7 Mungall,4 Mehran Bakthiari,1 Rosemarie Tremblay-LeMay,5 Anjali Silva,1 Susana Ben-Neriah,2
8 Merrill Boyle,2 Diego Villa,2 Marco A. Marra,4 Christian Steidl,2 Randy D. Gascoyne,2 Ryan D.
9 Morin,3 Kerry J. Savage,2 David W. Scott2*, Robert Kridel1*
10
11 1
Princess Margaret Cancer Centre - University Health Network, Toronto, ON, Canada; 2Centre
12 for Lymphoid Cancer, BC Cancer, Vancouver, BC, Canada; 3Simon Fraser University, Burnaby,
13 BC, Canada; 4Canada’s Michael Smith Genome Sciences Centre, BC Cancer, Vancouver, BC,
14 Canada; 5Laboratory Medicine Program - University Health Network, Toronto, ON, Canada.
15
16
17 Corresponding author:
18 Dr. Robert Kridel
19 Princess Margaret Cancer Centre – University Health Network
20 700 University Avenue, DMOH OPG Rm 6-714, Toronto, ON M5G 2M9, Canada
21 E-mail: robert.kridel@uhn.ca; Phone: 416-946-2243; Fax: 416-946-4520
22
23 * These authors contributed equally to this work.
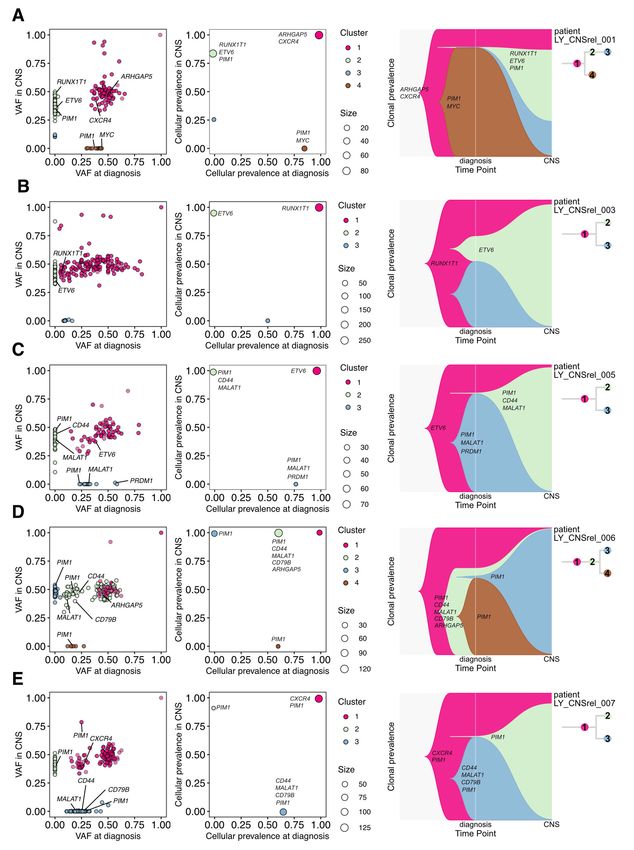
24
25
26
27 Text word count: 1,503
28 Number of figures and tables: 3
29 Number of references: 15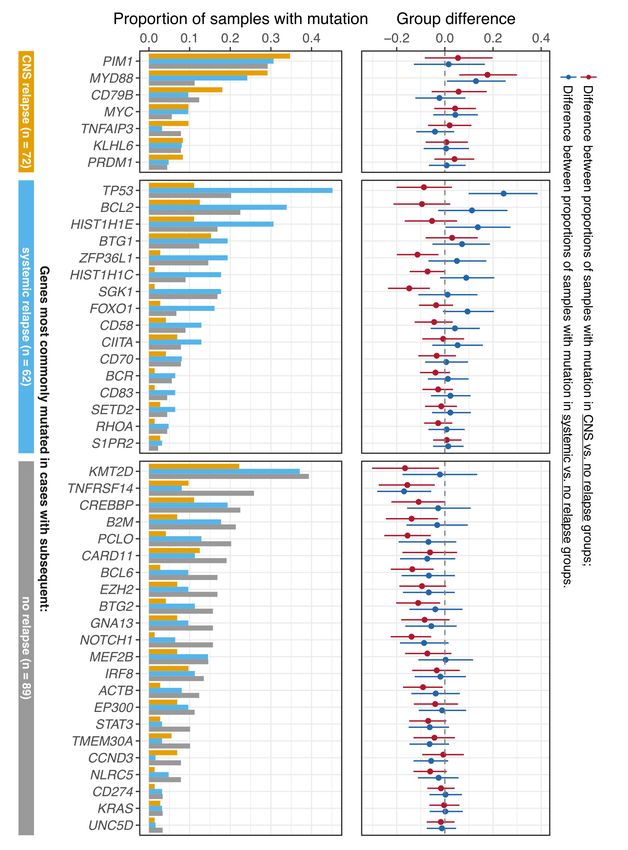
Isaev et al.

30      Refractory or relapsed diffuse large B-cell lymphoma (DLBCL) is challenging to treat in general

31   and progression in the central nervous system (CNS) is associated with particularly dismal

32   outcomes. Indeed, the median survival of patients diagnosed with CNS relapse is typically 2-4

33   months.1 The incidence of CNS relapse is 2-5% in unselected patient cohorts treated with

34   modern immunochemotherapy,2,3 presenting a challenge for risk prediction. Individual risk

35   factors for CNS relapse are well established, and include clinical parameters such as age, stage,

36   elevated lactate dehydrogenase and performance status.1,4 Moreover, the involvement of

37   certain extranodal sites such as uterus/testis or kidney/adrenal gland confers higher risk of CNS
                5
38   relapse.       These individual clinical risk factors have been integrated into a risk score (CNS

39   International Prognostic Index, CNS-IPI).3 Molecular attributes such as double-hit translocation

40   status, BCL2/MYC dual protein expression as well as the activated B-cell-like (ABC) subtype (or

41   non-GCB), have also been associated with a higher risk of CNS relapse.6,7 However, the major

42   shortcoming of available risk prediction models is their limited discriminative power. While the

43   CNS-IPI classifies 12% of patients into the high-risk group, only 10% of patients within this high-

44   risk group experience CNS relapse.3

45      Herein, to comprehensively assess molecular determinants of CNS relapse, we chose three

46   distinct approaches. Firstly, we performed exome sequencing in paired tissue biopsies

47   (peripheral and CNS parenchymal tumors) and reconstructed clonal phylogenies that underlie

48   CNS invasion. Secondly, we assembled a dataset to assess the association of specific gene

49   mutations with CNS relapse. Lastly, we performed gene expression and pathway analysis on an

50   enriched cohort of diagnostic tissue samples from 222 patients with diverging clinical outcomes.

51   An overview of all samples used in this study is shown in Supplemental Figure 1.

                                                                                                 page 2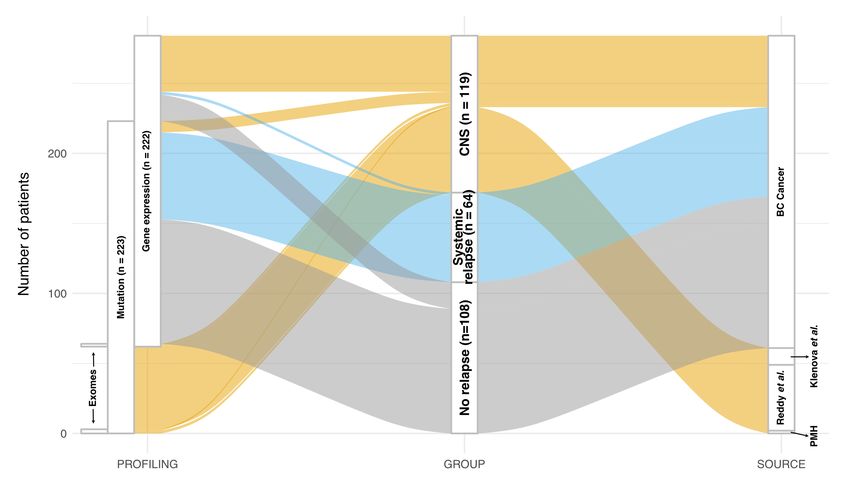
Isaev et al.

52      To describe changes in clonal structure associated with CNS relapse, we used the PyClone

53   computational tool to infer clonal structures in five paired CNS samples (Supplemental Table 1).

54   Recurrent gene mutations included PIM1 (n = 4), CD44 (n = 3), ETV6 (n = 3), MALAT1 (n = 3),

55   ARHGAP5 (n = 2), CD79B (n = 2), CXCR4 (n = 2) and RUNX1T1 (n = 2). We observed striking clonal

56   divergence in all five cases, with biopsies from the time of CNS invasion characterized by

57   discrete sets of mutations (Figure 1). In general, the expanding subclones were not sampled at

58   the time point of diagnosis, with the main exception being case LY_CNSrel_006. The number of

59   mutations found in CNS-relapsing clones tended to be higher than the number of shared

60   mutations, and higher than the number of mutations exclusively found at diagnosis

61   (Supplemental Figure 2). The most frequently mutated gene was PIM1, with 22 exonic, intronic

62   and untranslated region mutations identified in samples from four patients, in keeping with

63   PIM1 being recognized as a known target of aberrant somatic hypermutation in DLBCL.8 These

64   mutations were mostly subclonal (95%), identified in either expanding (14/22 mutations, 64%)

65   or extinguished clones (7/22 mutations, 32%). The ETS family member transcription factor ETV6

66   was found to be mutated in expanding clones in two cases, and in an ancestral clone in another

67   case, with all mutations mapping to the exon 1 donor splice site. Our findings document the

68   existence of intratumoral heterogeneity that is associated with the emergence of subclones that

69   are observed in the CNS. They also suggest that the disease leading to relapse has features that

70   are distinct from the disease found a primary diagnosis.

71      Next, we asked whether a larger cohort of diagnostic samples could delineate gene

72   mutations associated with either CNS or systemic relapse. We compiled mutation data from 223

73   diagnostic DLBCL samples, derived from several datasets of both population-based and clinical

                                                                                              page 3
Isaev et al.
74 trial series. Information on 45 genes was available, for 72 cases with CNS relapse, 62 cases with
75 systemic relapse and 89 cases without relapse (Supplemental Table 2). The strongest signal for
76 enrichment within cases with subsequent CNS relapse was found for MYD88, although this gene
77 was almost as frequently mutated in cases with subsequent systemic relapse (Figure 2). On the
78 other hand, several gene mutations appeared most robustly associated with systemic relapse,
79 and were comparatively uncommon in cases with subsequent CNS relapse. This pattern was
80 most striking for TP53, with mutations found in 45% of patients experiencing systemic relapse,
81 in 20% of patients with no relapse, and in only 11% of patients with subsequent CNS relapse.
82 Furthermore, we found that certain gene mutations were relatively depleted in CNS relapse
83 cases, compared to cases with either systemic or no relapse. The most striking example was
84 KMT2D, mutated in 22% of patients with CNS relapse, compared to 37 and 39% of patients with
85 no relapse and systemic relapse, respectively.
86 Lastly, we asked whether specific pathways were enriched in diagnostic samples from
87 patients who subsequently experienced either CNS or systemic relapse. We included a total of
88 222 patients with samples available for gene expression profiling: 50 patients with CNS relapse
89 (n = 39) or CNS involvement documented at diagnosis (n = 11), 64 patients with systemic relapse
90 and 108 patients without relapse (Supplemental Table 3). We performed gene set enrichment
91 analysis to identify biological processes deregulated in the three risk groups (Supplemental
92 Table 4). Interestingly, we observed a significant downregulation of pathways in ABC-DLBCL
93 when comparing systemic vs. no relapse, and an upregulation of pathways in GCB-DLBCL (Figure
94 3A). Downregulation of pathways was also observed in CNS vs. no relapse in ABC-DLBCL but not
95 GCB-DLBCL. We observed that systemic relapse in GCB-DLBCL appeared to be driven by MYC,
page 4Isaev et al.
96 metabolic and protein translation signatures, to a higher degree than CNS relapse (Figure 3B).
97 We assessed whether the double-hit signature9 allowed the delineation of varying risks of CNS
98 and/or systemic relapse in our cohort. Overall, 39 out of 90 classifiable GCB cases (43%) were
99 positive for DHITsig. The percentage of DHITsig-positive cases was similar between systemic
100 (64%) and CNS relapse (58%), and lower in cases without relapse (29%, χ2 test P = 0.008,
101 Supplemental Figure 3). These results link expression of the DHIT signature with CNS relapse,
102 mirroring the increased risk of CNS relapse conferred by dual expression of MYC and BCL2.6
103 ABC-DLBCL cases with subsequent relapse were characterized by depletion of stromal
104 signatures, an effect that was most pronounced in those ABC-DLBCL cases with systemic
105 relapse. In summary, while cases with subsequent CNS relapse displayed similar pathway
106 enrichment patterns to cases with subsequent systemic relapse, there are likely additional CNS-
107 specific processes not captured through transcriptome profiling.
108 Herein, we present a comprehensive description of clonal evolution, gene mutations and
109 gene expression changes associated with CNS and systemic relapse in DLBCL. Our analysis of
110 clonal evolution patterns underlying CNS relapse revealed clear clonal divergence. In general,
111 mutations specifically associated with the relapsing clone were not found at measurable levels
112 in preceding diagnostic specimens. Our cohort for exome sequencing of paired samples was
113 limited due to inherent challenges associated with collecting biospecimens of this nature, as a
114 limited number of patients undergo sampling of brain parenchyma at the time of relapse.
115 Further, a divergent mode of clonal evolution is not unique to CNS relapse, but rather a general
116 property of cancers that harbor underlying intra-tumoral heterogeneity. Divergent evolution has
117 also been demonstrated in DLBCL,10,11 although – to the best of our knowledge – no prior study
page 5Isaev et al.
118 has applied state-of-the-art phylogenetic reconstruction tools to trace clonal trajectories in the
119 specific context of CNS relapse. The phylogenetic portraits that we could draw exert a
120 cautionary tale, illustrating that efforts to improve patient outcomes will need to take into
121 consideration the molecular landscape at the time of lymphoma relapse. Moreover, well-known
122 challenges to predict CNS relapse may be explained by both inter-patient and intra-tumor
123 heterogeneity that is universally recognized in DLBCL.
124 Alterations of ABC subtype-associated genes are frequently seen in primary CNS
125 lymphoma,12 which is often of an ABC phenotype,13 and are also characteristic of the recently
126 identified C5/MCD subtype of DLBCL that is associated with extranodal involvement and poor
127 outcome.14,15 In the gene mutation analysis, the strongest enrichment was seen for MYD88,
128 although this gene was almost as often mutated in cases with subsequent systemic relapse.
129 Conversely, we found that several gene mutations that were more commonly seen in patients
130 experiencing systemic, as opposed to CNS relapse (e.g. TP53). Other mutations such as KTM2D,
131 characteristic of the C3/EZB subtype of DLBCL, appeared to be comparatively infrequent in CNS
132 relapse cases, perhaps suggesting that the KMT2D-mutant phenotype is not conducive to
133 establishing tumors in the CNS. Lastly, we found that biological pathways were differentially
134 enriched between clinical risk groups in the ABC vs. GCB subtype of DLBCL. Signals underlying
135 CNS relapse were overall weaker compared with signals underlying systemic relapse, potentially
136 reflective of clonal divergence and resulting phenotypic shifts that may accompany CNS relapse.
137 It seems unlikely that a gene expression-based biomarker can be developed to positively
138 identify patients at highest risk of CNS relapse, beyond the information that is already contained
139 within the transcriptional footprints that define known DLBCL subtypes. In contrast, large-scale,
page 6Isaev et al.
140 integrative analyses and in-depth characterization of clonal trajectories hold the promise to
141 increase our ability to understand dissemination of DLBCL into the CNS.
142 Acknowledgments
143 This work was supported by an Innovation Grant (award # 703505) from the Canadian Cancer
144 Society Research Institute (D.W.S.), by a Genome Canada Large-Scale Applied Research Project
145 (Genome Canada #13124, Genome BC #271LYM, Canadian Institutes of Health Research #GP1-
146 155873 and the BC Cancer Foundation) (C.S., D.W.S, M.A.M.), the Ontario Research Fund (R.K.),
147 and by the Princess Margaret Cancer Foundation (R.K.). We thank the expert staff of the
148 Michael Smith’s Genome Sciences Centre at BC Cancer in Vancouver and The Centre for Applied
149 Genomics at SickKids in Toronto for generating exome sequencing data and gene expression. We
150 thank Dr. Osvaldo Espin-Garcia for expert statistical advice.
151 Competing Interests
152 The authors declare no competing conflicts of interest relating to the work presented herein.
page 7Isaev et al.
153 References
154 1. Kridel R, Dietrich P-Y. Prevention of CNS relapse in diffuse large B-cell lymphoma. Lancet
155 Oncol. 2011;12(13):1258-1266.
156 2. Boehme V, Schmitz N, Zeynalova S, Loeffler M, Pfreundschuh M. CNS events in elderly
157 patients with aggressive lymphoma treated with modern chemotherapy (CHOP-14) with or
158 without rituximab: an analysis of patients treated in the RICOVER-60 trial of the German
159 High-Grade Non-Hodgkin Lymphoma Study Group (DSHNHL). Blood. 2009;113(17):3896-
160 3902.
161 3. Schmitz N, Zeynalova S, Nickelsen M, et al. CNS International Prognostic Index: A Risk
162 Model for CNS Relapse in Patients With Diffuse Large B-Cell Lymphoma Treated With R-
163 CHOP. J Clin Oncol. 2016;34(26):3150-3156.
164 4. Boehme V, Zeynalova S, Kloess M, et al. Incidence and risk factors of central nervous system
165 recurrence in aggressive lymphoma--a survey of 1693 patients treated in protocols of the
166 German High-Grade Non-Hodgkin’s Lymphoma Study Group (DSHNHL). Ann Oncol.
167 2007;18(1):149-157.
168 5. El-Galaly TC, Villa D, Michaelsen TY, et al. The number of extranodal sites assessed by
169 PET/CT scan is a powerful predictor of CNS relapse for patients with diffuse large B-cell
170 lymphoma: An international multicenter study of 1532 patients treated with
171 chemoimmunotherapy. Eur J Cancer. 2017;75:195-203.
172 6. Savage KJ, Slack GW, Mottok A, et al. Impact of dual expression of MYC and BCL2 by
173 immunohistochemistry on the risk of CNS relapse in DLBCL. Blood. 2016;127(18):2182-
174 2188.
175 7. Klanova M, Sehn LH, Bence-Bruckler I, et al. Integration of cell of origin into the clinical CNS
176 International Prognostic Index improves CNS relapse prediction in DLBCL. Blood.
177 2019;133(9):919-926.
178 8. Pasqualucci L, Neumeister P, Goossens T, et al. Hypermutation of multiple proto-oncogenes
179 in B-cell diffuse large-cell lymphomas. Nature. 2001;412(6844):341-346.
180 9. Ennishi D, Jiang A, Boyle M, et al. Double-Hit Gene Expression Signature Defines a Distinct
181 Subgroup of Germinal Center B-Cell-Like Diffuse Large B-Cell Lymphoma. J Clin Oncol.
page 8Isaev et al.
182 2019;37(3):190-201.
183 10. Juskevicius D, Lorber T, Gsponer J, et al. Distinct genetic evolution patterns of relapsing
184 diffuse large B-cell lymphoma revealed by genome-wide copy number aberration and
185 targeted sequencing analysis. Leukemia. 2016;30(12):2385-2395.
186 11. Greenawalt DM, Liang WS, Saif S, et al. Comparative analysis of primary versus
187 relapse/refractory DLBCL identifies shifts in mutation spectrum. Oncotarget.
188 2017;8(59):99237-99244.
189 12. Lesokhin AM, Ansell SM, Armand P, et al. Nivolumab in patients with relapsed or refractory
190 hematologic malignancy: Preliminary results of a phase ib study. J Clin Oncol.
191 2016;34(23):2698-2704.
192 13. Booman M, Douwes J, Glas AM, et al. Primary testicular diffuse large B-cell lymphomas
193 have activated B-cell-like subtype characteristics. J Pathol. 2006;210(2):163-171.
194 14. Chapuy B, Stewart C, Dunford AJ, et al. Molecular subtypes of diffuse large B cell lymphoma
195 are associated with distinct pathogenic mechanisms and outcomes. Nat Med.
196 2018;24(5):679-690.
197 15. Schmitz R, Wright GW, Huang DW, et al. Genetics and Pathogenesis of Diffuse Large B-Cell
198 Lymphoma. N Engl J Med. 2018;378(15):1396-1407.
199
page 9Isaev et al.
200 Figure legends
201 Figure 1: Clonal evolution patterns associated with central nervous system (CNS) relapse.
202 PyClone analysis to retrace clonal phylogenies in five cases with documented CNS
203 dissemination. The leftmost column shows variant allele frequencies (VAF) at diagnosis vs. VAF
204 in CNS sample. The middle column depicts clusters of mutation cellular prevalence. The
205 rightmost column shows time sweep plots that graphically illustrated clonal tides over the
206 course of relapse. Representative DLBCL genes are labelled.
207 Figure 2: Gene mutations associated with CNS and systemic relapse. The barplot shows the
208 proportion of samples harboring given gene mutations. Shown are 45 genes. The total sample
209 size is 223 samples (n = 72 with CNS relapse, n = 62 with systemic relapse and n = 89 without
210 relapse). The line plot shows differences between proportions of mutated samples, when
211 comparing either CNS vs. no relapse, or CNS vs. systemic relapse. The lines indicate the ranges
212 of the credible intervals for group differences, and the small circles represent the point
213 estimates of the group differences.
214 Figure 3: Pathways associated with CNS and systemic relapse. A. Number of gene sets enriched
215 by contrast and by COO, based on differential gene expression analysis. Only gene sets with
216 adjusted P value of < 0.05 are shown. B. Heatmap showing the enrichment scores (ES) of the
217 most down- and upregulated pathways by contrast and by COO. Pathways are grouped by
218 biological theme.
page 10Isaev et al. CNS relapse in DLBCL: Supplemental material
Supplemental Methods
Exome sequencing, detection of single nucleotide variants and clonal analysis
Ten formalin-fixed and paraffin-embedded (FFPE) tissue DNA samples from five patients were
submitted to the BC Genome Sciences Centre for library construction, Agilent SureSelect V6
exome capture and Illumina sequencing (Supplemental Table 1). Single nucleotide variants were
called by Mutect21 (version 2.1) using tumor only mode. Hg19 coordinates in VCF files were left-
normalized using bcftools (samtools v1.9).2 Single nucleotide variants (SNVs) and indels were
annotated by Annovar using the following datasets: ensGene, gnomad211, cosmic68 and
avsnp142 (Version date 16 Apr 2018).3 Variants marked as population variants (dbSNP) were used
further to infer copy number status around these regions using CNVkit.4 Additional filters were
applied to obtain somatic variants. This included a minimum depth of 100 for all but one sample
with low coverage (LY_CNSrel_003_T1, minimum depth of 30 was required for this sample),
variant allele frequency greater than 0.1 as well as not being annotated in dbSNP or having a
population allele frequency > 0.001. Variants mapping to sex chromosomes were excluded.
CNVkit was used in tumor only mode with a flat reference to infer copy number changes in these
ten samples using BAM files. Discrete copy number segments were first inferred using the haar
algorithm.5 VCF files with variants marked as potential germline SNPs were used in the “call”
function to infer allele-specific copy number.
Copy number segments were merged with annotated somatic variants using Bedtools
(v2.27.1)6 to generate the input data for PyClone (v0.13.1)7 that includes read counts, allele-
specific copy number status and tumor content. Paired analysis of clonal evolution was performed
using Pyclone’s multisample mode. If a variant was identified as a somatic mutation in only one
of the two samples, bam-readcount (https://github.com/genome/bam-readcount) was used to
retrieve read counts for that position. Variants with no read coverage in one of the two paired
samples were discarded for this analysis. Variants in the IGH locus were also removed and the
final list included only those mutations in copy neutral regions (total copy number status = 2).
PyClone was run on each pair using default parameters, in addition to tumor content, as
determined by examination of corresponding H&E sections. Mutations were then clustered based
on inferred cellular prevalence. To increase the confidence of clustering, we removed mutations
that formed a cluster on their own, as well as mutations with a standard deviation of cellular
prevalence > 0.15. PyClone was re-run using this new set of mutations. Citup8 was used to infer
clone phylogenies based on mutation cellular frequencies obtained from PyClone. The maximum
number of nodes was set to the one obtained by the final number of clusters from PyClone. The
R package timescape (https://github.com/maiasmith/timescape) was used to visualize clonal
dynamics and clonal phylogenies.
Identification of gene mutations associated with CNS or systemic relapse
In order to identify associations between specific gene mutations and the three above-
mentioned clinical risk groups, we compiled a partially overlapping dataset with mutation data of
45 genes in 223 diagnostic samples (n = 72 with CNS relapse, n = 62 with systemic relapse and n
= 89 without relapse). This dataset was derived by combining our own mutation data9 with two
publicly available datasets (Reddy et al.10 and Klanova et al.11). Enrichment across clinical groups
was evaluated with a Bayesian implementation of the proportion test, using the BayesianFirstAid
R package (v0.1).12 To that effect, the bayes.prop.test function was run with default parameters.
page 1Isaev et al. CNS relapse in DLBCL: Supplemental material
Bayesian data analysis was used as it has several advantages over traditional null hypothesis
significance testing, given that it allows to describe the uncertainty of parameter estimates and
that it does not rely on arbitrary P value cut-offs.13
Case selection for gene expression profiling
Given the relatively infrequent occurrence of CNS relapse, we put emphasis on accruing a
cohort of diagnostic samples that was enriched for outcome events. Samples from 222 patients
were retrospectively identified from the population-based BC Cancer lymphoma biorepository.
Events were considered when they occurred within 1 year following diagnosis, given that CNS
relapse is typically reported to occur early.14–16 Moreover, in this discovery study, we assumed
that gene expression profiles were more likely to reveal predictive features of relapse if the time
between diagnosis and relapse was short. Hence, patients were selected to fall into 3 different
clinical groups: 1) Cases with documented CNS relapse (n=50) within 1 year of diagnosis of de
novo DLBCL who were treated with R-CHOP (or R-CEOP) (n=39), or those who had concurrent CNS
involvement at diagnosis (n=11); 2) Cases with refractory disease or systemic relapse (n=64)
within the first year following diagnosis and prior treatment with R-CHOP, but who did not have
evidence of CNS involvement at any point in time; and 3) Cases with neither CNS nor systemic
relapse for at least 5 years following diagnosis and who had received R-CHOP (n=108). We
balanced the 3 clinical groups with regards to cell-of-origin (COO), given that the ABC subtype has
been reported as a risk factor for CNS and systemic relapse,11,17 and is defined by a distinct
transcriptional footprint.18 Regarding CNS prophylaxis, prior to September 2002, intrathecal
chemotherapy was recommended for all patients with involvement of specific extranodal sites
(bone marrow if involvement by large cell lymphoma, epidural, testes or sinus). After September
2002, this guideline was restricted to only patients with sinus involvement. Beginning in 2013,
high dose methotrexate (3.5g/m2) was recommended for patients with testicular and kidney
involvement and select other high-risk patients.
All pathological specimens were centrally reviewed by expert hematopathologists at BC
Cancer. All cases were required to yield sufficient RNA from a diagnostic formalin-fixed paraffin-
embedded (FFPE) tissue block. COO was determined using the Lymph2Cx assay, as previously
described.19,20 Up to five 10µm tissue sections were cut from FFPE tissue blocks and extracted
using the Qiagen AllPrep DNA/RNA FFPE Kit. Gene expression profiling using Affymetrix Human
Gene 2.0 ST arrays was performed by The Centre for Applied Genomics, The Hospital for Sick
Children, Toronto, Canada.
Gene expression analysis
One sample (CNR7010T1) was an outlier based on average probe intensity and principal
component analysis, but was retained in the study as its omission did not alter results in a
significant way. We used the oligo R package (v1.46.0) to perform background correction and
quantile normalization using the Robust Multi-array Average (RMA) method.21 Multiple probes
for a given gene were averaged to provide a single measurement per gene and per sample. The
dataset was then filtered (genes retained if at least 5% of samples had an intensity of greater than
1.5, and if the coefficient of variation was between 0.15 and 5). Differential gene expression
analysis was performed for each COO subtype (ABC and GCB) using the limma R package
(v3.42.0).22 In order to identify and remove latent variation, we applied Surrogate Variable
page 2Isaev et al. CNS relapse in DLBCL: Supplemental material
Analysis using the sva R package (v3.34.0), with the number of surrogate variables identified as 1
and 0 for ABC and GCB-DLBCL, respectively (parameters: method = leek, vfilter = 1,000).23
Double-hit signature
Calls for the recently published double hit gene expression signature were available for 74 of
the 96 germinal centre B-cell-like (GCB) cases, based on the DLBCL90 NanoString assay presented
in Ennishi et al.9 For all 96 GCB cases, we also computed double hit signature calls using the
Affymetrix dataset and the PRPS package (available from https://github.com/ajiangsfu/PRPS).
When comparing to the NanoString-based assay, the accuracy for our calls was 86% and 93%,
when including or excluding indeterminate cases, respectively.
Pathway enrichment analysis
For pathway enrichment analysis, we followed the recommendations outlined by Reimand et
24
al. For each of the three contrasts (CNS relapse vs. no relapse, systemic relapse vs. no relapse,
CNS relapse vs. systemic relapse), we generated a gene list that was ranked by a descending
moderated t-statistic and used as input for Gene Set Enrichment Analysis (GSEA, v4.0.3).25 GSEA
was run with default parameters (number of permutations 1000, set size 15-500, enrichment
statistic weighted), using the following gene sets: hallmark (h.all.v7.1), curated canonical
pathways (c2.cp.v7.1), GO biological processes (c5.bp.v7.1), oncogenic signatures (c6.all.v7.1) and
immunologic signatures (c7.all.v7.1). In addition, we supplemented these gene sets with a
publicly available list of signatures that are relevant in the lymphoid context.26
Data Sharing Statement
Mutation data can be found in Supplemental Table 2. Qualified researchers may obtain access
to the original data used in this study. Microarray data have been deposited into the European
Genome-phenome Archive (study accession EGAD00010001909). For exome sequencing data,
please contact the senior authors of this study.
References
1. Cibulskis K, Lawrence MS, Carter SL, et al. Sensitive detection of somatic point mutations in
impure and heterogeneous cancer samples. Nat. Biotechnol. 2013;31(3):213–219.
2. Li H, Handsaker B, Wysoker A, et al. The Sequence Alignment/Map format and SAMtools.
Bioinformatics. 2009;25(16):2078–2079.
3. Wang K, Li M, Hakonarson H. ANNOVAR: Functional annotation of genetic variants from high-
throughput sequencing data. Nucleic Acids Res. 2010;38(16):1–7.
4. Talevich E, Shain AH, Botton T, Bastian BC. CNVkit: Genome-Wide Copy Number Detection
and Visualization from Targeted DNA Sequencing. PLoS Comput. Biol. 2016;12(4):e1004873.
5. Ben-Yaacov E, Eldar YC. A fast and flexible method for the segmentation of aCGH data.
Bioinformatics. 2008;24(16):139–145.
6. Quinlan AR, Hall IM. BEDTools: a flexible suite of utilities for comparing genomic features.
Bioinformatics. 2010;26(6):841–2.
7. Roth A, Khattra J, Yap D, et al. PyClone: statistical inference of clonal population structure in
cancer. Nat. Methods. 2014;11(4):396–8.
8. Malikic S, McPherson AW, Donmez N, Sahinalp CS. Clonality inference in multiple tumor
samples using phylogeny. Bioinformatics. 2015;31(9):1349–56.
9. Ennishi D, Jiang A, Boyle M, et al. Double-Hit Gene Expression Signature Defines a Distinct
page 3Isaev et al. CNS relapse in DLBCL: Supplemental material
Subgroup of Germinal Center B-Cell-Like Diffuse Large B-Cell Lymphoma. J. Clin. Oncol.
2019;37(3):190–201.
10. Reddy A, Zhang J, Davis NS, et al. Genetic and Functional Drivers of Diffuse Large B Cell
Lymphoma. Cell. 2017;171(2):481-494.e15.
11. Klanova M, Sehn LH, Bence-Bruckler I, et al. Integration of cell of origin into the clinical CNS
International Prognostic Index improves CNS relapse prediction in DLBCL. Blood.
2019;133(9):919–926.
12. Baath R. Bayesian First Aid: A Package that Implements Bayesian Alternatives to the Classical
test Functions in R. UseR 2014 - Int. R User Conf. 2014;1(2):30–42.
13. Kruschke JK. Bayesian assessment of null values via parameter estimation and model
comparison. Perspect. Psychol. Sci. 2011;6(3):299–312.
14. Boehme V, Zeynalova S, Kloess M, et al. Incidence and risk factors of central nervous system
recurrence in aggressive lymphoma--a survey of 1693 patients treated in protocols of the
German High-Grade Non-Hodgkin’s Lymphoma Study Group (DSHNHL). Ann. Oncol.
2007;18(1):149–57.
15. Boehme V, Schmitz N, Zeynalova S, Loeffler M, Pfreundschuh M. CNS events in elderly
patients with aggressive lymphoma treated with modern chemotherapy (CHOP-14) with or
without rituximab: an analysis of patients treated in the RICOVER-60 trial of the German
High-Grade Non-Hodgkin Lymphoma Study Group (DSHNHL). Blood. 2009;113(17):3896–
902.
16. Bernstein SH, Unger JM, LeBlanc M, et al. Natural history of cns relapse in patients with
aggressive non-hodgkin’s lymphoma: A 20-year follow-up analysis of swog 8516-the
southwest oncology group. J. Clin. Oncol. 2009;27(1):114–119.
17. Savage KJ, Slack GW, Mottok A, et al. Impact of dual expression of MYC and BCL2 by
immunohistochemistry on the risk of CNS relapse in DLBCL. Blood. 2016;127(18):2182–8.
18. Alizadeh AA, Eisen MB, Davis RE, et al. Distinct types of diffuse large B-cell lymphoma
identified by gene expression profiling. Nature. 2000;403(6769):503–11.
19. Scott DW, Wright GW, Williams PM, et al. Determining cell-of-origin subtypes of diffuse large
B-cell lymphoma using gene expression in formalin-fixed paraffin-embedded tissue. Blood.
2014;123(8):1214–7.
20. Kridel R, Mottok A, Farinha P, et al. Cell of origin of transformed follicular lymphoma. Blood.
2015;126(18):2118–2127.
21. Carvalho BS, Irizarry RA. A framework for oligonucleotide microarray preprocessing.
Bioinformatics. 2010;26(19):2363–7.
22. Ritchie ME, Phipson B, Wu D, et al. limma powers differential expression analyses for RNA-
sequencing and microarray studies. Nucleic Acids Res. 2015;43(7):e47.
23. Leek JT, Johnson WE, Parker HS, Jaffe AE, Storey JD. The SVA package for removing batch
effects and other unwanted variation in high-throughput experiments. Bioinformatics.
2012;28(6):882–883.
24. Reimand J, Isserlin R, Voisin V, et al. Pathway enrichment analysis and visualization of omics
data using g:Profiler, GSEA, Cytoscape and EnrichmentMap. Nat. Protoc. 2019;14(2):482–
517.
25. Subramanian A, Tamayo P, Mootha VK, et al. Gene set enrichment analysis: a knowledge-
based approach for interpreting genome-wide expression profiles. Proc. Natl. Acad. Sci. U. S.
page 4Isaev et al. CNS relapse in DLBCL: Supplemental material
A. 2005;102(43):15545–50.
26. Schmitz R, Wright GW, Huang DW, et al. Genetics and Pathogenesis of Diffuse Large B-Cell
Lymphoma. N. Engl. J. Med. 2018;378(15):1396–1407.
page 5Isaev et al. CNS relapse in DLBCL: Supplemental material
Supplemental Figure 1: Flow diagram illustrating all patients described in this study and their
relationship with profiling techniques used, clinical risk groups and the source of samples and/or
data.
page 6Isaev et al. CNS relapse in DLBCL: Supplemental material
Supplemental Figure 2: Number of mutations found to be shared, exclusively seen in T1 (i.e.
extra-CNS biopsy) or T2 (CNS biopsy).
Supplement l ue
1000
Patient
750
Number of mutations
LY_CNSrel_001
LY_CNSrel_003
500
LY_CNSrel_005
LY_CNSrel_006
250
LY_CNSrel_007
0
shared T1 T2
Number of mutations found to be shared, ex lusi el seen in T1 i e extra CNS bio s or T2 CNS bio s
page 7Isaev et al. CNS relapse in DLBCL: Supplemental material
Supplemental Figure 3: Proportion of cases positive (in salmon color) for the double-hit
signature, by clinical risk group.
page 8Isaev et al. Supplementary material
Supplemental Table 1: Cases used for exome sequencing.
Sample Source Site timepoint 1 Site timepoint 2 Treatment between Time to CNS
biopsies relapse (years)
LY_CNSrel_001 UHN Breast Brain R-CHOP 2.78
LY_CNSrel_003 UHN Lymph node Brain CHOP or CHOP-like 5.37
LY_CNSrel_005 BC Cancer Stomach Brain R-CHOP 0.38
LY_CNSrel_006 BC Cancer Testis Brain CHOP or CHOP-like 0.72
LY_CNSrel_007 BC Cancer Testis Brain CNS involvement at 0.08
diagnosis
page 9Isaev et al. Supplementary material
Supplemental Table 2: Mutation data from 223 diagnostic DLBCL samples, by clinical group and source.
(see separate Excel file)
page 10Isaev et al. Supplementary material
Supplemental Table 3: Patient included in gene expression study, characteristics by clinical group.
Clinical Group P value
CNS relapse Systemic relapse No relapse CNS vs. systemic CNS vs. Systemic vs.
(n=50) (n=64) (n=108) relapse no relapse no relapse
Age ≤ 60 19 (38%) 21 (33%) 40 (37%)
Age > 60 31 (62%) 43 (67%) 68 (63%) 0.693 1.000 0.623
ECOG ≤ 1 12 (24%) 25 (39%) 65 (61%)
ECOG > 1 38 (76%) 39 (61%) 42 (39%) 0.108Isaev et al. Supplementary material
Supplemental Table 4: Results from gene set enrichment analysis.
(see separate Excel file)
page 12You can also read