Association of changes of retinal vessels diameter with ocular blood flow in eyes with diabetic retinopathy
←
→
Page content transcription
If your browser does not render page correctly, please read the page content below
www.nature.com/scientificreports
OPEN Association of changes of retinal
vessels diameter with ocular
blood flow in eyes with diabetic
retinopathy
Yoshitaka Ueno1, Takeshi Iwase1,2*, Kensuke Goto1, Ryo Tomita1, Eimei Ra1,
Kentaro Yamamoto1 & Hiroko Terasaki1
We investigated morphological changes of retinal arteries to determine their association with the
blood flow and systemic variables in type 2 diabetes patients. The patients included 47 non-diabetic
retinopathy eyes, 36 mild or moderate nonproliferative diabetic retinopathy (M-NPDR) eyes, 22
severe NPDR (S-NPDR) eyes, 32 PDR eyes, and 24 normal eyes as controls. The mean wall to lumen
ratio (WLR) measured by adaptive optics camera was significantly higher in the PDR groups than in
all of the other groups (all P < 0.001). However, the external diameter of the retinal vessels was not
significantly different among the groups. The mean blur rate (MBR)-vessel determined by laser speckle
flowgraphy was significantly lower in the PDR group than in the other groups (P < 0.001). The WLR
was correlated with MBR-vessel (r = − 0.337, P < 0.001), duration of disease (r = 0.191, P = 0.042), stage
of DM (r = 0.643, P < 0.001), systolic blood pressure (r = 0.166, P < 0.037), and presence of systemic
hypertension (r = 0.443, P < 0.001). Multiple regression analysis demonstrated that MBR-vessel
(β = − 0.389, P < 0.001), presence of systemic hypertension (β = 0.334, P = 0.001), and LDL (β = 0.199,
P = 0.045) were independent factors significantly associated with the WLR. The increased retinal vessel
wall thickness led to a narrowing of lumen diameter and a decrease in the blood flow in the PDR group.
The prevalence of diabetes mellitus has been increasing, and diabetic retinopathy (DR) has become one of the
leading causes of blindness in developed countries. DR can be classified into five stages; a first stage of no apparent
retinopathy, a second stage of mild non-proliferative diabetic retinopathy (M-NPDR), a third stage of moderate
NPDR, a fourth stage of severe NPDR (s-NPDR), and a fifth stage of proliferative diabetic retinopathy (PDR)1.
DR is a metabolic disorder that is associated with hyperglycemia which causes an increase in the synthesis
and accumulation of basement membrane components. These changes result in a thickening of the basement
membranes of blood vessels2. Several studies of fundus photographs showed microvascular changes in the blood
iabetes3–7. The diameter of the retinal vessels is important because it may predict the
vessels of patients with d
progression of the DR, and the results of two studies reported that there were beneficial effects of photocoagula-
tion for macula edema and proliferative r etinopathy3, 4. The severity of the retinopathy and renal dysfunction
were found to be associated with the degree of retinal arteriolar narrowing in patients with type1 diabetes5. This
narrowing is important because it is related to the incidence of strokes and cardiovascular disease in the general
population and in individuals with diabetes6, 7. The authors of these studies concluded that there was a significant
association between the retinal vessel diameter and systemic complications. However, these studies could not
assess the changes in the thickness of the retinal vessel wall because of the low resolution of conventional fundus
cameras used to record the images of the retinal blood vessels.
The wall to lumen ratio (WLR) is the ratio of the vascular wall thickness to the luminal diameter, and this
ratio can be used as an in vivo parameter of arterial remodeling. This parameter is important in the field of
vascular medicine because it suggests the degree of vascular stenosis and is predictive of end-organ d amage8–10.
The WLR can increase due to wall thickening, or by a narrowing of the lumen, or a combination of both. Thus,
arterial remodeling is best characterized by an increase in the WLR.
1
Department of Ophthalmology, Nagoya University Graduate School of Medicine, 65 Tsurumai‑cho, Showa‑ku,
Nagoya 466‑8560, Japan. 2Department of Ophthalmology, Akita University Graduate School of Medicine, Akita,
Japan. *email: tiwase@med.nagoya‑u.ac.jp
Scientific Reports | (2021) 11:4653 | https://doi.org/10.1038/s41598-021-84067-2 1
Vol.:(0123456789)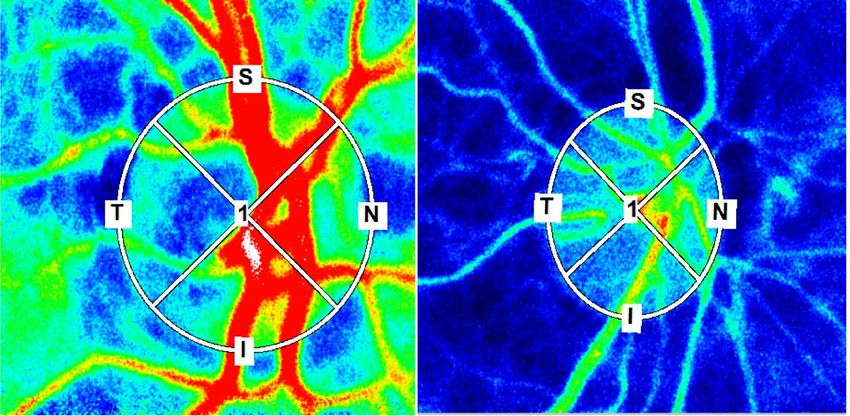
www.nature.com/scientificreports/
Adaptive optics (AO) technology can allow a noninvasive recording of high resolution images of the photore-
ceptors and retinal vessel walls by correcting the optical wavefront a berrations11. Recently, studies have evaluated
the retinal vessels including wall thickness and the WLR in detail using the images obtained by an AO c amera12–17.
Measurements of the ocular blood flow in diabetic retinopathy are necessary to understand the role played
by alterations of the retinal hemodynamics in the progression of retinopathy and to assist in the management of
the progression. Many studies have investigated the hemodynamics of patients with diabetes mellitus by various
technologies including laser doppler velocimetry (LDV) and video fluorescein a ngiography18–22. However, few
studies have evaluated the ocular blood flow at each stage of diabetic retinopathy. Due to the time-consuming
measurements, earlier ocular blood flow measuring devices were not suitable for large scale clinical trials. Laser
speckle flowgraphy (LSFG) (Softcare Co., Ltd., Fukutsu, Japan) is a method of measuring the relative blood flow
in the choroid and optic nerve head (ONH) quantitatively. It requires only 4 s to obtain one i mage23–25. The LSFG
values have been shown to be highly correlated with the actual blood flow values as determined by hydrogen gas
clearance and the microsphere m ethod26, 27. This means that the values of the variables determined with LSFG of
different individuals can be compared reliably. Therefore, LSFG is believed to be suitable for evaluating retinal
blood flow in a large number of patients non-invasively and rapidly.
Nevertheless, to the best of our knowledge, there has not been a study that assessed both the morphological
changes of the retinal vessels and microcirculation at each stage of DR.
Thus, the purpose of this study was to evaluate the arterial wall thickness, external diameter, and lumen
diameter of the retinal vessels at different stages of DR. To accomplish this, we measured the morphological
parameters in the high-resolution images obtained by an AO-camera and the ocular blood flow parameters by
LSFG from patients at different stages of DR.
Patients and methods
Ethics statement. This was a retrospective, cross-sectional, single-center study, and the procedures were
approved by Institutional Review Board and the Ethics Committee of the Nagoya University Hospital (Nagoya,
Japan). The study was performed at the Nagoya University Hospital, and the procedures conformed to the ten-
ets of the Declaration of Helsinki. All subjects signed a written informed consent form. Permission was also
obtained to use the data collected for future research.
Subjects. We reviewed the medical records of all Japanese patients who were diagnosed with type 2 diabe-
tes between April 2016 and March 2018. The normal control eyes were the fellow eyes of age-matched patients
who visited to our hospital to treat the other eye for rhegmatogenous retinal detachment (RRD) or epiretinal
membrane (ERM) without diabetes. None of these patients had any retinal diseases including RRD and ERM.
The stage of the DR was determined by indirect ophthalmoscopy and fluorescein angiograms of the dilated eyes
by two retinal specialists (YU, TI). The eyes with diabetes were divided into 4 stages; no apparent diabetic retin-
opathy (NDR), mild and moderate nonproliferative diabetic retinopathy (M-NPDR), severe NPDR (S-NPDR),
and proliferative diabetic retinopathy (PDR)28. In eyes with PDR, photocoagulation was performed with a total
of 1200–3500 spots and 200-µm spot sizes with pulse duration of 0.2 s to obtain a complete pan retinal photo-
coagulation (PRP). When both eyes met the inclusion criteria, the data of one eye were randomly selected for
the statistical analyses.
Exclusion criteria. The exclusion criterion included the presence of any macular abnormalities such as
asymptomatic pigment epithelial detachment or choroidal neovascularization, use of topical anti-glaucoma
medications, history of other ophthalmic disorders, use of systemic hormonal medications, or prior steroid or
anti-vascular endothelial growth factor (VEGF) therapy for the diabetic macular edema at least 1 year before the
measurements, and axial length (AL) > 26.5 mm29.
Measurements of clinical parameters. The ALs were measured by partial optical coherence interfer-
ometry (IOLMaster; Carl Zeiss Meditec, La Jolla, CA), and the intraocular pressure (IOP) was measured with a
handheld tonometer (Icare; Tiolat Oy, Helsinki, Finland). The systolic blood pressure (SBP) and diastolic blood
pressure (DBP) of the left brachial artery at the height of the heart in a sitting position were measured for with
an automatic sphygmomanometer (CH-483C; Citizen, Tokyo, Japan). The mean arterial blood pressure (MAP)
and mean ocular perfusion pressure (MOPP) were calculated as follows: MAP = DBP + 1/3(SBP − DBP) and
MOPP = 2/3MAP − IOP, respectively30.
The laboratory profile of each patient consisted of the hemoglobin A1c (HbA1c) level, total cholesterol (mg/
dL), triglycerides (mg/dL), low-density lipoprotein-cholesterol (LDL-C mg/dL), and high-density lipoprotein-
cholesterol (HDL-C mg/dL) obtained from blood samples. The HbA1c level was expressed based on the scale
of the National Glycohemoglobin Standardization Program. Hypertension was defined as a SBP ≥ 140 mmHg
or a DBP ≥ 90 mmHg or the use of any antihypertensive m edication31. Dyslipidemia was defined to be present
when the serum of the individual had low-density lipoprotein (LDL) cholesterol levels ≥ 140 mg/dL and/or high-
density lipoprotein (HDL) cholesterol levels < 40 mg/dL and/or triglyceride values ≥ 150 mg/dL in subjects with
a history of cholesterol-lowering therapy32.
Laser speckle flowgraphy measurements. LSFG-NAVI (Softcare, Fukuoka, Japan) was used to deter-
mine the relative blood flow on the ONH and the retinal microcirculation. The principles of LSFG have been
described in detail33–35. To evaluate the circulation on the ONH, a circular marker was set surrounding the ONH
(Fig. 1A). The “vessel extraction’’ function of the software then identified the vessel and tissue areas on the ONH
so that the MBR could be assessed separately as the vessel areas (MBR-vessel) and the tissue areas (MBR-tissue)
Scientific Reports | (2021) 11:4653 | https://doi.org/10.1038/s41598-021-84067-2 2
Vol:.(1234567890)
www.nature.com/scientificreports/
Figure 1. A circular marker was set surrounding the optic nerve head (ONH) to measure the mean blur rate
(MBR) (A). The “vessel extraction’’ function of the software then identified the vessel and tissue areas on the
ONH so that the MBR could be assessed separately as the vessel areas (MBR-vessel) and the tissue areas (MBR-
tissue) (B). The rectangular areas (1 to 19) were set semi-automatically to the vessels around the optic nerve
head concentrically and the total retinal flow index (TRFI) was calculated (C).
(Fig. 1B). To evaluate the retinal circulation, the relative flow volume (RFV) index and the total retinal flow
index (TRFI) were calculated. The calculation of the RFV has been described in d etail36. The TRFI represents the
total of retinal arterial and venous blood flow volume which was calculated from the total RFV index for all of
the major retinal vessels around the ONH semiautomatically. To measure the TRFI, rectangular bands were set
around all of the major vessels of the ONH using the built-in image analysis software (Fig. 1C). If there was an
error in the placement, we corrected the location of the rectangular band manually.
LSFG was performed twice for each time point in all of the eyes. The average MBR values were calculated for
each circle or rectangle using the LSFG Analyzer software (v.3.1.59).
Adaptive optics (AO) imaging. The rtx1 AO is an adaptive optics device (Imagine Eyes, Orsay, France)37,
and its principles have been described in detail38, 39. We recorded images of the arterioles in Zone B which was
located 0.5–1 disc diameter from the optic disc margin. The vascular measurements of this area were made by
the software AO which can detect the retinal arteries. We obtained the external diameter (ED), lumen diameter
(LD), wall thickness (WT), and wall to lumen ratio (WLR) for the retinal arteries, which were measured by two
retinal specialists (YU, TI).
Statistical analyses. The value of each parameter is presented by the means ± standard deviations. Com-
parisons between groups were made using one-way ANOVA (for continuous variables) and the x2 test (for
categorical variables). One-way ANOVA was followed by a post hoc comparison with Tukey HSD or Games-
Howell procedure. Spearman’s rank correlation coefficient tests were used to determine the significance of the
correlation coefficients between the variables. Multiple stepwise regression analysis was used to determine the
association between blood flow parameters and the other variables. All statistical analyses were performed using
IBM SPSS Statistics for Windows, v.24 (IBM Corp., Armonk, NY). The significance level was set at a probability
(P) value < 0.05.
Results
Demographics of subjects. This study included 47 NDR eyes, 36M-NPDR eyes, 22 S-NPDR eyes, 32
PDR eyes, and 24 control eyes. The baseline clinical demographic data on all subjects are presented in Table 1.
The mean duration after PRP was 4.2 ± 2.9 years in the PDR group. No significant differences were observed
Scientific Reports | (2021) 11:4653 | https://doi.org/10.1038/s41598-021-84067-2 3
Vol.:(0123456789)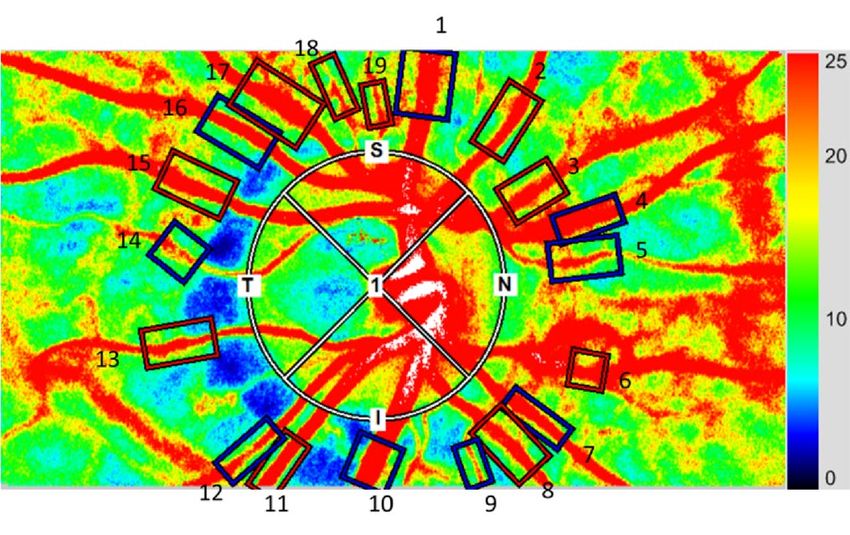
www.nature.com/scientificreports/

                                             Characteristics                            Control           NDR               M-NPDR            S-NPDR           PDR             p-value
                                             N                                          24                47                36                22               32              –
                                             Age (years)                                67.2 ± 10.1       62.7 ± 12.9       63.4 ± 12.7       55.1 ± 12.6      59.7 ± 11.8     0.012
                                             Sex (male:female)                          11 : 13           27 : 20           21 : 15           13 : 9           16 : 16        0.797
                                             Axial length (mm)                          23.9 ± 1.1        24.0 ± 1.9        24.2 ± 1.1        24.2 ± 1.1       24.0 ± 1.0     0.832
                                             HbA1c (%)                                  –                 7.0 ± 0.9         7.8 ± 1.3         8.2 ± 2.0        7.3 ± 1.0      0.003
                                             Duration of diabetes (years)               –                 10.1 ± 6.9        17.6 ± 11.1       13.1 ± 7.8       17.3 ± 10.1    0.003
                                             Systolic blood pressure (mmHg)             134.6 ± 16.5      126.6 ± 17.5      135.5 ± 25.2      131.8 ± 16.3     141.8 ± 29.7   0.079
                                             Diastolic blood pressure (mmHg)            77.0 ± 9.4        76.1 ± 11.9       77.9 ± 12.9       78.8 ± 10.1      78.0 ± 15.9    0.902
                                             Intra ocular pressure (mmHg)               13.0 ± 2.5        14.5 ± 2.5        14.8 ± 3.3        14.1 ± 3.4       15.2 ± 4.3     0.126
                                             Ocular perfusion pressure (mmHg)           51.3 ± 7.2        47.5 ± 8.8        49.9 ± 10.0       50.2 ± 8.7       50.8 ± 11.2    0.436
                                             Total cholesterol (mg/dl)                  202.0 ± 35.6      178.4 ± 37.7      171.5 ± 32.9      186.2 ± 63.6     194.1 ± 37.7   0.102
                                             Low-density lipoprotein (mg/dl)            –                 102.2 ± 27.9      93.4 ± 26.1       95.0 ± 23.8      110.6 ± 32.4   0.210
                                             High-density lipoprotein (mg/dl)           –                 58.8 ± 21.7       51.6 ± 15.9       45.7 ± 13.0      50.1 ± 14.3    0.087
                                             Triglyceride (mg/dl)                       134.8 ± 92.4      128.6 ± 69.7      156.5 ± 114.7     149.7 ± 97.4     157.6 ± 82.2   0.655
                                             Hypertension (n/%)                         4/16.7            15/31.9           18/50.0           12/54.5          23/71.9        0.001
                                             Dyslipidemia (n/%)                         6/25.0            22/46.8           19/52.8           9/40.9           19/59.3        0.047

                                            Table 1.  Clinical characteristics of subjects.

                                             Variables                      Control          NDR                    M-NPDR               S-NPDR             PDR               p value
                                             External diameter (μm)         120.12 ± 14.67   122.57 ± 18.60         122.93 ± 13.20       119.06 ± 11.16     122.69 ± 11.07         0.714
                                             Lumen diameter (μm)             94.62 ± 11.95        93.21 ± 15.37       91.60 ± 11.37       89.35 ± 9.64       82.31 ± 11.74         0.001
                                             Wall thickness (μm)             25.58 ± 3.80         29.36 ± 4.88        31.33 ± 6.24        29.70 ± 2.82       40.35 ± 5.74      < 0.001
                                             Wall to lumen ratio              0.27 ± 0.03          0.31 ± 0.04         0.34 ± 0.07         0.33 ± 0.03        0.50 ± 0.11      < 0.001

                                            Table 2.  Retinal artery variables measured by AO camera.

                                            in the sex distribution, AL, SBP, DBP, IOP, OPP, total cholesterol, LDL, HDL, and triglyceride among the five
                                            groups. However, there were significant differences in the age (P = 0.012), HbA1c (P = 0.003), duration of diabe-
                                            tes (P = 0.003), hypertension ratio (P = 0.001), and dyslipidemia ratio (P = 0.047) among the groups.

                                            Differences in retinal arterial parameters among groups. The repeatability of the measurements
                                            between the graders was excellent with an ICC of 0.99 for the external diameter, 0.99 for the lumen diameter,
                                            and 0.99 for the wall thickness. There was no significant difference in the external diameter of the retinal ves-
                                            sels among the five groups, but the lumen diameter in the PDR group was significantly smaller than that in the
                                            control, the NDR, and the M-NPDR groups (P = 0.004, P = 0.002, P = 0.024, respectively; Table 2, Figs. 2, 3). The
                                            vessel wall was significantly thinner in the control group than that in the NDR, the M-NPDR, the S-NPDR, and
                                            the PDR group (P = 0.040, P < 0.001, P = 0.001, P < 0.001, respectively). In addition, the wall was significantly
                                            thicker in the PDR group than in the control, the NDR, the M-NPDR, and the S-NPDR groups (all P < 0.001).
                                            The mean WLR was significantly lower in the control group than in the NDR, the M-NPDR, the S-NPDR, and
                                            the PDR group (all P < 0.001), and it was significantly greater in the PDR group than in the NDR, the M-NPDR,
                                            and the S-NPDR groups (all P < 0.001).

                                            Comparison of ocular blood flow among groups. The MBR-vessel was significantly lower in the PDR
                                            group than that in the control, the NDR, the M-NPDR, and the S-NPDR groups (all P < 0.001; Table 3, Figs. 4, 5).
                                            There was no significant difference in the MBR-tissue among the groups. The TRFI was significantly lower in the
                                            PDR group than that in the control, the NDR, the M-NPDR, and the S-NPDR groups (all P < 0.001).

                                            Correlation of vascular variables to other parameters. The lumen diameter was significantly corre-
                                            lated with the MBR-vessel (r = 0.185, P = 0.024), the TRFI (r = 0.195, P = 0.025), and the stage of DR (r = − 0.288,
                                            P < 0.001; Table 4, Fig. 6). The wall thickness was significantly correlated with the MBR-vessel (r = − 0.331,
                                            P < 0.001), -tissue (r = − 0.172, P = 0.036), the TRFI (r = − 0.362, P < 0.001), the duration of disease (r = 0.223,
                                            P = 0.017), the stage of DR (r = 0.587; P < 0.001), SBP (r = 0.195, P = 0.014), and the presence of systemic hyper-
                                            tension (r = 0.400, P < 0.001). The WLR was significantly correlated with the MBR-vessel (r = − 0.337, P < 0.001),
                                            the TRFI (r = − 0.359, P < 0.001), the duration of disease (r = 0.191, P = 0.042), the stage of the DR (r = 0.643,
                                            P < 0.001), the SBP(r = 0.166, P < 0.037), and the presence of systemic hypertension(r = 0.443, P < 0.001).
                                                Stepwise multiple regression analysis showed that the WLR was an independent factor that was significantly
                                            associated with the MBR-vessel (β = − 0.389, P < 0.001), the presence of hypertension (β = 0.334, P = 0.001), and
                                            LDL (β = 0.199, P = 0.045) (Table 5). In addition, after excluding the PDR group from the all data, multiple

          Scientific Reports |   (2021) 11:4653 |                        https://doi.org/10.1038/s41598-021-84067-2                                                                        4

Vol:.(1234567890)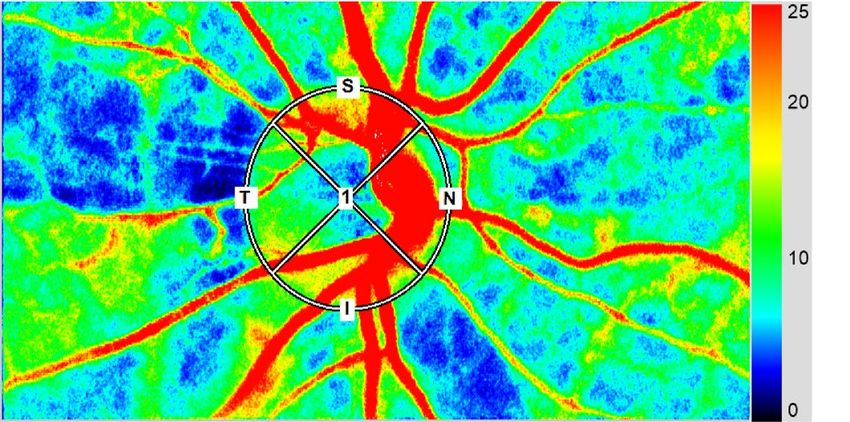
www.nature.com/scientificreports/
Figure 2. Representative images obtained with an Adaptive Optics device (images in each stages of diabetic
retinopathy (DR). The images show the external diameter, the lumen diameter (LD), wall thickness, and wall to
lumen ratio (WLR). Eyes in the control group (A); no diabetic retinopathy (NDR) group (B); mild or moderate
non-proliferative diabetic retinopathy (M-NPDR) group (C); severe NPDR (S-NPDR) group (D); and PDR
group (E) are shown. Eyes in the DR groups have higher WLR, especially in the PDR group.
regression analysis also showed the WLR was an independent factor that was significantly associated with the
presence of hypertension (β = 0.273, P = 0.001) and the MBR-vessel (β = − 0.207, P = 0.014).
Discussion
Our results showed that the high-resolution images obtained by the AO-camera allowed us to measure the differ-
ent morphological parameters of the retinal arteries. In addition, LSFG allowed us to measure the relative blood
flow. These measurements were made in patients at different stages of DR, and the results allowed us to determine
whether significant correlations were present between the morphological and blood flow characteristics of the
retinal arterial vessels and the stage of the DR.
Our results showed that the wall thickness and the WLR were significantly different among the five groups,
and it was greater even in the NDR group than in the control group. The results of a large clinical trial showed
that patients with type 2 diabetes without retinopathy had smaller mean arteriolar and venular lumen diameters
as determined by fundus camera than non-diabetic i ndividuals40. However, the external diameter of the vessels
could not be measured accurately because of the low resolution conventional fundus cameras. Arichika et al.
examined the retina of patients with DR by AO scanning laser ophthalmoscopy (SLO) and reported that the
retinal arterial walls were significantly thicker in diabetic patients without clinically apparent DR than in the
control12. However, the lumen and the external diameter was not significantly different. In addition, Zaleska-
Zmijewska et al. reported that the vessel wall thickness and the WLR in the NDR group was thicker than that of
the control group using the images obtained by an AO-camera, but the lumen and the external diameter were
not significantly d ifferent16. Our results confirm these findings.
It has been suggested that the sclerosis of the vascular wall in diabetic patients was due in part to stiffening of
the collagen caused by advanced glycosylated products with collagen cross-linking and elastin d egeneration41, 42.
Also, the lumen of the retinal arteries have been reported to become narrower due to the growth of smooth
muscle cells and vascular fibrosis43. This would then contribute to an increase in the WLR in eyes of diabetic
patients44, 45. Interestingly, there was no significant difference in the external diameter among the five groups.
These results imply that these morphological changes in eyes of diabetic patients result from a thickening of
the vessel wall and a narrowing of the lumen diameter while not increasing the external diameter even in eyes
treated by laser photocoagulation.
Scientific Reports | (2021) 11:4653 | https://doi.org/10.1038/s41598-021-84067-2 5
Vol.:(0123456789)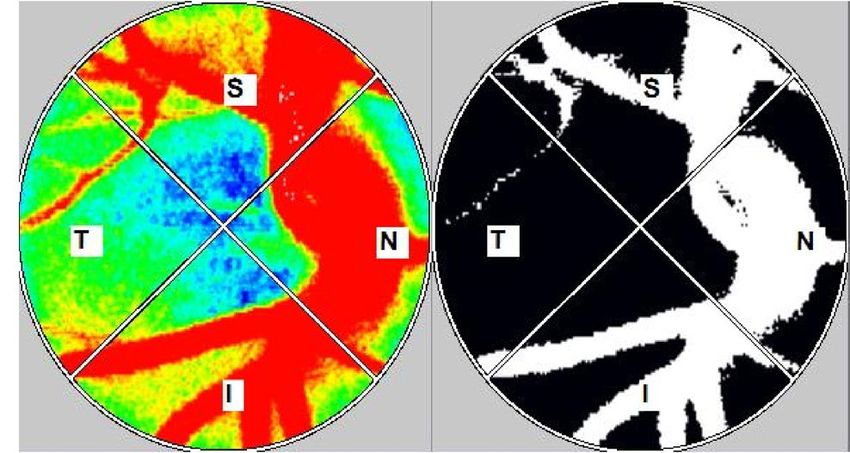
www.nature.com/scientificreports/
Figure 3. Differences in the changes in the diameter of the retinal vessels determined by AO images among the
groups. The percentage change is expressed for the four groups with diabetes, and the values are compared to
that of the control group. There were no significant differences in the external diameter among the groups (A).
The lumen diameter in the PDR group is significantly smaller than in the control, the NDR, and the M-NPDR
groups (B). The mean wall thickness (C) and the mean wall to lumen ratio (D) in the control group are
significantly lower than in the other groups. The mean wall thickness (C) and the mean wall to lumen ratio (D)
in the PDR groups are significantly larger than in the other groups.
Parameters Control NDR M-NPDR S-NPDR PDR p value
MBR-vessel (AU) 43.83 ± 8.22 42.30 ± 7.17 40.64 ± 7.74 41.44 ± 6.30 30.50 ± 11.09 < 0.001
MBR-tissue (AU) 11.31 ± 2.69 11.11 ± 2.08 11.47 ± 2.25 10.75 ± 2.19 9.42 ± 3.39 0.099
TRFI (AU) 2764 ± 572.2 2682 ± 736.1 2817 ± 657.6 2644 ± 617.0 1704 ± 873.5 < 0.001
Table 3. Parameters determined by LSFG. AU: arbitrary units, TRFI: total retinal flow index.
A thickening of the wall, a narrowing of the lumen, or a combination of both can cause an increase in the
WLR. In addition, the images of arterioles were taken 0.5 to 1 disc diameter from the optic disc margin. The meas-
ured values were not very different, i.e., small standard deviations, but varied depending on the vessel. Accord-
ingly, the WLR should be a more accurate variable to compare the morphological differences among the groups.
On the other hand, there were no differences in the blood flow (MBR) and blood flow velocity (TRFI) deter-
mined by LSFG among the NDR, M-NPDR, and S-NPDR groups and the control group. In a prospective study
of patients with type 1 disease showed that the blood flow determined by laser doppler velocimetry (LDV) was
initially decreased in the retinal arterioles and was then increased with long follow-up periods46. Another study
reported that the retinal blood flow was lower in patients with type 2 diabetes and early D R19. Recently, Palochak
et al. reported that the blood flow in eyes with DM without DR determined by AO-SLO was significantly higher
than controls which contrasted with the significantly decrease in blood flow in eyes with N PDR47.
There are several explanations for the finding that the blood flow results are not consistent in eyes with
untreated diabetic retinopathy19, 46, 47. First, it has been reported that the retinal blood flow is increased while
vessel density is decreased as determined by OCTA in eyes with N DR48. These findings suggest that the increased
blood flow is a temporary compensatory mechanism for the reduced blood vessel density to meet the metabolic
demand of the photoreceptors. Second, it is known that the photoreceptors are the most oxygen consuming tissue
in the retina and the number of photoreceptor is reduced in NPDR16. The characteristics would suggest that the
Scientific Reports | (2021) 11:4653 | https://doi.org/10.1038/s41598-021-84067-2 6
Vol:.(1234567890)www.nature.com/scientificreports/
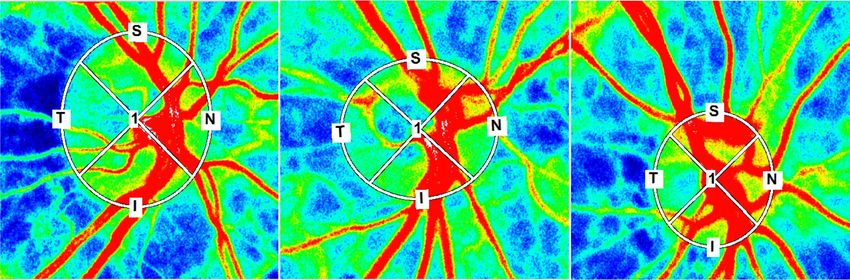
Figure 4. Representative composite color maps on the optic nerve head determined by LSFG at each stages of
DR. Red color indicates a high mean blur rate (MBR), and blue color indicates a low MBR. Eyes in the control
group (A); NDR group (B); M-NPDR group (C); S-NPDR group (D); and PDR group (E) are shown.
more advanced retinopathy led to a greater reduction of blood flow. Because the sample size was relatively small
in this study and a significant difference was not detected, it might be that the blood flow is reduced depending
on the grade of retinopathy in the case where a larger number of subjects were examined. Third, the features
of the measurement device would cause the difference in the results and LSFG cannot detect the difference in
blood flow parameters among the control and untreated diabetic retinopathy group. Shiba et al. reported that
the MBR of the ONH in diabetic patients without retinopathy did not differ from that of nondiabetic p atients49.
Fourth, the level of VEGF expression might influence the results of the blood flow measurements. The injection
of anti-VEGF agents has been reported to reduce the ocular blood flow in patients with diabetic r etinopathy50
indicating that retinal blood flow is affected by VEGF. The concentration of VEGF would be not consistent even
in the same grade of retinopathy, which might be related to our results. This question can only be answered by
longitudinal, large scale, multimodal imaging studies.
Our results showed significant thicker walls resulting in narrower lumen diameters and higher WLR in
the PDR group compared to the other four groups. These results indicate that the presence of another mecha-
nism because all of the eyes in the PDR group underwent photocoagulation treatments. Several studies have
reported that photocoagulation leads to a narrowing of the retinal arteries and veins using conventional fun-
dus photography5, 40, 51–53. In addition, the MBR-vessel and the TRFI were significantly reduced in the PDR
group compared to the other groups. These results are in good agreement with the morphological changes, and
photocoagulation destroys the ischemic tissue including the photoreceptors, reduces the oxygen demand, and
improves the oxygenation of the inner retina. These changes would lead to an autoregulatory vasoconstriction
and reduced retinal blood fl ow54. An animal study showed an increase in the oxygen delivered from the choroidal
circulation to the inner retina after photocoagulation55. Actually, earlier studies reported a decrease in ocular
blood flow after P RP52, 56–59. Furthermore, the negative correlation between the ocular blood flow and the WLR
in our study suggests that the vasoconstriction of retinal artery after photocoagulation is related to the increase
of vessel wall thickness and narrowed lumen diameter secondary to the decrease of ocular blood flow although
external diameter did not change so much.
Multiple regression analysis showed that the WLR were significantly correlated with the MBR of the vessels
even when the PDR group was excluded. There have been reports about the relationship between blood flow and
Scientific Reports | (2021) 11:4653 | https://doi.org/10.1038/s41598-021-84067-2 7
Vol.:(0123456789)www.nature.com/scientificreports/
Figure 5. Differences in blood flow parameters determined by LSFG among the groups. The percentage
differences are shown for four groups with diabetes and compared to the control group. The MBR of the vessels
on the ONH in the PDR group is significantly lower than that in the other groups (A). There is no significant
difference in the MBR-tissue among the groups (B). The total retinal flow index (TRFI) in the PDR group is
significantly lower than the other groups (C).
Duration of
Variables MBR-vessel MBR-tissue TRFI Age disease DR stage HbA1c T-chol LDL HDL TG SBP DBP OPP HT DL
External diameter (μm) 0.012 − 0.012 0.036 0.121 0.437 0.074 0.020* − 0.136 − 0.007 − 0.205 − 0.107 0.038 − 0.058 − 0.020 0.043 0.100
Lumen diameter (μm) 0.185* 0.085 0.195* 0.110* − 0.012 − 0.288*** 0.117 − 0.128 − 0.020 − 0.140 − 0.156 − 0.033 − 0.092 − 0.038 − 0.149 0.009
Wall thickness (μm) − 0.331*** − 0.172* − 0.362*** 0.042 0.223* 0.587*** 0.024 − 0.100 0.062 − 0.181 − 0.002 0.195* 0.081 0.074 0.400*** 0.116
Wall to lumen ratio − 0.337*** − 0.150 − 0.359*** − 0.023 0.191* 0.643*** − 0.066 − 0.032 0.022 − 0.096 0.097 0.166* 0.105 0.069 0.443*** 0.085
Table 4. Spearman’s rank correlation coefficient of vascular variables with other parameters. ED: external
diameter; LD: lumen diameter; WT: wall thickness; WLR: wall to lumen ratio; T-chol: total cholesterol; LDL:
low density lipoprotein; HDL: high density lipoprotein; TG: triglyceride; SBP: systolic blood pressure; DBP:
diastolic blood pressure; OPP: ocular perfusion pressure; HT: hypertension; DL: dyslipidemia. *p < 0.05,
**p < 0.01, ***p < 0.001.
vessel morphological changes. Physiologically, this might be explained by wall shear stress (WSS) playing a role
in maintaining the relation between arterial diameter and blood v elocity60–64. And metabolically, this might be
due to factors such as endothelin-1. Khuu et al. reported elevated level of endothelin-1 in aqueous humor and
reduced blood flow in patients with mild-to-moderate NPDR65. These factors might be the physiological and
metabolic parameters explaining the correlation between retinal blood flow index and lumen diameter.
Our results showed that a history of hypertension was correlated with the WLR. In hypertension, higher
blood pressure via vasoactive peptides including endothelin 1 and angiotensin II results in peripheral arterioles
vasoconstriction, smooth muscle cells apoptosis, and vascular fibrosis, resulting in remodeling66–68, e.g., inward
eutrophic remodeling and outward hypertrophic r emodeling69. These changes result in an increasing of the
WLR. Therefore, the WLR is a sensitive marker of retinal microvascular changes indicating retinal endothelial
dysfunction in systemic diseases70. Previous studies using AO-SLO13 and AO camera39 also showed that the blood
pressure was strongly correlated with the WLR which is in keeping with our results.
This study has several limitations. First, the sample size was not large. This was partly due to the difficulty in
obtaining clear images in patients with poor eye fixation or cataract in using AO camera. Second, the HbA1c was
Scientific Reports | (2021) 11:4653 | https://doi.org/10.1038/s41598-021-84067-2 8
Vol:.(1234567890)www.nature.com/scientificreports/
Figure 6. Correlation of morphological variables with blood flow parameters. The lumen diameter is
significantly correlated with the MBR-vessel (A) and TRFI (B). The WLR is correlated with the MBR-vessel (C)
and TRFI (D).
Dependent Independent β p-value
MBR-vessel − 0.389 < 0.001
Hypertension 0.334 0.001
Low-density lipoprotein 0.199 0.045
Systolic blood pressure 0.141 0.156
Age − 0.121 0.217
Diastolic blood pressure 0.115 0.238
Wall to lumen ratio
Dyslipidemia − 0.072 0.487
HbA1c 0.045 0.648
Triglyceride 0.041 0.688
Duration of disease 0.033 0.747
Total-cholesterol 0.015 0.902
High-density lipoprotein 0.005 0.958
Table 5. Results of multiple regression analysis for independence factors contributing to wall to lumen ratio.
not associated with the morphological variables. Arichika et al. reported that the HbA1c was positively correlated
with the retinal artery wall thickness in diabetic patients without retinopathy using AO-SLO, suggesting the AO
imaging can evaluate the microvascular damage in early phase. Because we selected patients with good blood
sugar control even in the PDR group may explain the absence of a significant association. Third, renal dysfunction
was not considered. Chronic kidney disease is associated with endothelial dysfunction71, and an earlier study
reported that the diameter of retinal arteries and veins decreased progressively with each stage of chronic kidney
disease72. Fourth, the PDR group had already undergone photocoagulation. It is unclear about the morphologi-
cal and blood flow changes in eyes without photocoagulation. In addition, the effect of photocoagulation on the
retinal arteries is unclear. Fifth, we did not ask to patients to abstain from red meat and caffeinated beverages on
Scientific Reports | (2021) 11:4653 | https://doi.org/10.1038/s41598-021-84067-2 9
Vol.:(0123456789)www.nature.com/scientificreports/
the day of the examination. The consumption of red meat might have a vasodilatory e ffect73 and that of caffein
may constrict ocular blood vessels74–76. Further longitudinal studies with multimodal imaging including renal
dysfunction in a larger number of patients are needed.
In conclusion, the retinal vessel wall is thicker which leads to a narrowing of the lumen diameter and a
decrease in the blood flow.
Received: 26 October 2020; Accepted: 9 February 2021
References
1. Wilkinson, C. P. et al. Proposed international clinical diabetic retinopathy and diabetic macular edema disease severity scales.
Ophthalmology 110, 1677–1682 (2003).
2. Stitt, A. W., Anderson, H. R., Gardiner, T. A. & Archer, D. B. Diabetic retinopathy: Quantitative variation in capillary basement
membrane thickening in arterial or venous environments. Br. J. Ophthalmol. 78, 133–137 (1994).
3. Klein, R. et al. The relation of retinal vessel caliber to the incidence and progression of diabetic retinopathy: XIX: The Wisconsin
Epidemiologic Study of Diabetic Retinopathy. Arch. Ophthalmol. 122, 76–83 (2004).
4. Remky, A., Arend, O., Beausencourt, E., Elsner, A. E. & Bertram, B. Retinal vessels before and after photocoagulation in diabetic
retinopathy. Determining the diameter using digitized color fundus slides. Klin Monbl Augenheilkd. 209, 79–83 (1996).
5. Klein, R. et al. Retinal vascular abnormalities in persons with type 1 diabetes: The Wisconsin Epidemiologic Study of Diabetic
Retinopathy: XVIII. Ophthalmology 110, 2118–2125 (2003).
6. Wong, T. Y. et al. Retinal microvascular abnormalities and incident stroke: The Atherosclerosis Risk in Communities Study. Lancet
358, 1134–1140 (2001).
7. Wong, T. Y. et al. Retinal arteriolar narrowing and risk of coronary heart disease in men and women. The Atherosclerosis Risk in
Communities Study. JAMA 287, 1153–1159 (2002).
8. Heagerty, A. M. Predicting hypertension complications from small artery structure. J. Hypertens. 25, 939–940 (2007).
9. Buus, N. H. et al. Small artery structure during antihypertensive therapy is an independent predictor of cardiovascular events in
essential hypertension. J. Hypertens. 31, 791–797 (2013).
10. Mulvany, M. J. Small artery remodeling in hypertension. Curr. Hypertens. Rep. 4, 49–55 (2002).
11. Lombardo, M., Serrao, S., Devaney, N., Parravano, M. & Lombardo, G. Adaptive optics technology for high-resolution retinal
imaging. Sensors 13, 334–366 (2012).
12. Arichika, S. et al. Correlation of retinal arterial wall thickness with atherosclerosis predictors in type 2 diabetes without clinical
retinopathy. Br. J. Ophthalmol. 101, 69–74 (2017).
13. Arichika, S., Uji, A., Ooto, S., Muraoka, Y. & Yoshimura, N. Effects of age and blood pressure on the retinal arterial wall, analyzed
using adaptive optics scanning laser ophthalmoscopy. Sci Rep. 5, 12283 (2015).
14. Burns, S. A. et al. In vivo adaptive optics microvascular imaging in diabetic patients without clinically severe diabetic retinopathy.
Biomed. Opt. Express. 5, 961–974 (2014).
15. Meixner, E. & Michelson, G. Measurement of retinal wall-to-lumen ratio by adaptive optics retinal camera: A clinical research.
Graefes Arch. Clin. Exp. Ophthalmol. 253, 1985–1995 (2015).
16. Zaleska-Żmijewska, A., Wawrzyniak, Z. M., Dąbrowska, A. & Szaflik, J. P. Adaptive optics (rtx1) high-resolution imaging of
photoreceptors and retinal arteries in patients with diabetic retinopathy. J. Diabetes Res. 2019, 9548324 (2019).
17. Iwase, T. et al. Differences of retinal blood flow between arteries and veins determined by laser speckle flowgraphy in healthy
subjects. Medicine 94, e1256 (2015).
18. Grunwald, J. E., Riva, C. E., Sinclair, S. H., Brucker, A. J. & Petrig, B. L. Laser Doppler velocimetry study of retinal circulation in
diabetes mellitus. Arch. Ophthalmol. 104, 991–996 (1986).
19. Nagaoka, T. et al. Impaired retinal circulation in patients with type 2 diabetes mellitus: Retinal laser Doppler velocimetry study.
Investig. Ophthalmol. Vis. Sci. 51, 6729–6734 (2010).
20. Patel, V., Rassam, S., Newsom, R., Wiek, J. & Kohner, E. Retinal blood flow in diabetic retinopathy. BMJ 305, 678–683 (1992).
21. Clermont, A. C., Aiello, L. P., Mori, F., Aiello, L. M. & Bursell, S. E. Vascular endothelial growth factor and severity of nonprolif-
erative diabetic retinopathy mediate retinal hemodynamics in vivo: A potential role for vascular endothelial growth factor in the
progression of nonproliferative diabetic retinopathy. Am. J. Ophthalmol. 124, 433–446 (1997).
22. Bursell, S. E. et al. Retinal blood flow changes in patients with insulin-dependent diabetes mellitus and no diabetic retinopathy.
Investig. Ophthalmol. Vis. Sci. 37, 886–897 (1996).
23. Sugiyama, T., Araie, M., Riva, C. E., Schmetterer, L. & Orgul, S. Use of laser speckle flowgraphy in ocular blood flow research. Acta
Ophthalmol. 88, 723–729 (2010).
24. Tamaki, Y., Araie, M., Kawamoto, E., Eguchi, S. & Fujii, H. Noncontact, two-dimensional measurement of retinal microcirculation
using laser speckle phenomenon. Investig. Ophthalmol. Vis. Sci. 35, 3825–3834 (1994).
25. Nagahara, M., Tamaki, Y., Tomidokoro, A. & Araie, M. In vivo measurement of blood velocity in human major retinal vessels using
the laser speckle method. Investig. Ophthalmol. Vis. Sci. 52, 87–92 (2011).
26. Takahashi, H. et al. Comparison of CCD-equipped laser speckle flowgraphy with hydrogen gas clearance method in the measure-
ment of optic nerve head microcirculation in rabbits. Exp. Eye Res. 108, 10–15 (2013).
27. Wang, L., Cull, G. A., Piper, C., Burgoyne, C. F. & Fortune, B. Anterior and posterior optic nerve head blood flow in nonhuman
primate experimental glaucoma model measured by laser speckle imaging technique and microsphere method. Investig. Ophthal-
mol. Vis. Sci. 53, 8303–8309 (2012).
28. Chew, E. Y. et al. The long-term effects of laser photocoagulation treatment in patients with diabetic retinopathy: The early treat-
ment diabetic retinopathy follow-up study. Ophthalmology 110, 1683–1689 (2003).
29. Shimada, N. et al. Reduction of retinal blood flow in high myopia. Graefes Arch. Clin. Exp. Ophthalmol. 242, 284–288 (2004).
30. Okuno, T., Sugiyama, T., Kojima, S., Nakajima, M. & Ikeda, T. Diurnal variation in microcirculation of ocular fundus and visual
field change in normal-tension glaucoma. Eye 18, 697–702 (2004).
31. Chobanian, A. V. et al. Seventh report of the Joint National Committee on Prevention, Detection, Evaluation, and Treatment of
High Blood Pressure. Hypertension 42, 1206–1252 (2003).
32. Teramoto, T. et al. Executive summary of Japan Atherosclerosis Society (JAS) guideline for diagnosis and prevention of athero-
sclerotic cardiovascular diseases for Japanese. J. Atheroscler. Thromb. 14, 45–50 (2007).
33. Fujii, H. Visualisation of retinal blood flow by laser speckle flow-graphy. Med. Biol. Eng. Comput. 32, 302–304 (1994).
34. Sugiyama, T., Utsumi, T., Azuma, I. & Fujii, H. Measurement of optic nerve head circulation: Comparison of laser speckle and
hydrogen clearance methods. Jpn. J. Ophthalmol. 40, 339–343 (1996).
35. Tamaki, Y. et al. Real-time measurement of human optic nerve head and choroid circulation, using the laser speckle phenomenon.
Jpn. J. Ophthalmol. 41, 49–54 (1997).
36. Shiga, Y. et al. Relative flow volume, a novel blood flow index in the human retina derived from laser speckle flowgraphy. Investig.
Ophthalmol. Vis. Sci. 55, 3899–3904 (2014).
Scientific Reports | (2021) 11:4653 | https://doi.org/10.1038/s41598-021-84067-2 10
Vol:.(1234567890)www.nature.com/scientificreports/
37. Li, K. Y. & Roorda, A. Automated identification of cone photoreceptors in adaptive optics retinal images. J. Opt. Soc. Am. A Opt.
Image Sci. Vis. 24, 1358–1363 (2007).
38. Roorda, A. et al. Adaptive optics scanning laser ophthalmoscopy. Opt. Express. 10, 405–412 (2002).
39. Koch, E. et al. Morphometric analysis of small arteries in the human retina using adaptive optics imaging: Relationship with blood
pressure and focal vascular changes. J. Hypertens. 32, 890–898 (2014).
40. Klein, R., Klein, B. E., Moss, S. E., Wong, T. Y. & Sharrett, A. R. Retinal vascular caliber in persons with type 2 diabetes: The Wis-
consin Epidemiological Study of Diabetic Retinopathy: XX. Ophthalmology 113, 1488–1498 (2006).
41. McMillan, D. E. The microcirculation in diabetes. Microcirc Endothelium Lymphatics. 1, 3–24 (1984).
42. Wolffenbuttel, B. H. et al. Breakers of advanced glycation end products restore large artery properties in experimental diabetes.
Proc. Natl. Acad. Sci. USA. 95, 4630–4634 (1998).
43. Di Marco, E. et al. NOX4-derived reactive oxygen species limit fibrosis and inhibit proliferation of vascular smooth muscle cells
in diabetic atherosclerosis. Free Radic. Biol. Med. 97, 556–567 (2016).
44. Curtis, T. M., Gardiner, T. A. & Stitt, A. W. Microvascular lesions of diabetic retinopathy: Clues towards understanding pathogen-
esis?. Eye 23, 1496–1508 (2009).
45. Clermont, A. C. & Bursell, S. E. Retinal blood flow in diabetes. Microcirculation. 14, 49–61 (2007).
46. Konno, S. et al. Retinal blood flow changes in type I diabetes. A long-term follow-up study. Investig. Ophthalmol. Vis. Sci. 37,
1140–1148 (1996).
47. Palochak, C. M. A. et al. Retinal blood velocity and flow in early diabetes and diabetic retinopathy using adaptive optics scanning
laser ophthalmoscopy. J. Clin. Med. 8, 1165 (2019).
48. Onishi, A. C. et al. Importance of considering the middle capillary plexus on OCT angiography in diabetic retinopathy. Investig.
Ophthalmol. Vis. Sci. 59, 2167–2176 (2018).
49. Shiba, C., Shiba, T., Takahashi, M., Matsumoto, T. & Hori, Y. Relationship between glycosylated hemoglobin A1c and ocular circula-
tion by laser speckle flowgraphy in patients with/without diabetes mellitus. Graefes Arch. Clin. Exp. Ophthalmol. 254, 1801–1809
(2016).
50. Sugimoto, M., Nunome, T., Sakamoto, R., Kobayashi, M. & Kondo, M. Effect of intravitreal ranibizumab on the ocular circulation
of the untreated fellow eye. Graefes Arch. Clin. Exp. Ophthalmol. 255, 1543–1550 (2017).
51. Grauslund, J. et al. Retinal vessel calibre and micro- and macrovascular complications in type 1 diabetes. Diabetologia 52, 2213–
2217 (2009).
52. Grunwald, J. E., Riva, C. E., Brucker, A. J., Sinclair, S. H. & Petrig, B. L. Effect of panretinal photocoagulation on retinal blood flow
in proliferative diabetic retinopathy. Ophthalmology 93, 590–595 (1986).
53. Wilson, C. A. et al. Optic disk neovascularization and retinal vessel diameter in diabetic retinopathy. Am. J. Ophthalmol. 106,
131–134 (1988).
54. Stefansson, E. Ocular oxygenation and the treatment of diabetic retinopathy. Surv. Ophthalmol. 51, 364–380 (2006).
55. Budzynski, E., Smith, J. H., Bryar, P., Birol, G. & Linsenmeier, R. A. Effects of photocoagulation on intraretinal PO2 in cat. Investig.
Ophthalmol. Vis. Sci. 49, 380–389 (2008).
56. Iwase, T., Kobayashi, M., Yamamoto, K., Ra, E. & Terasaki, H. Effects of photocoagulation on ocular blood flow in patients with
severe non-proliferative diabetic retinopathy. PLoS ONE 12, e0174427 (2017).
57. Yamada, Y. et al. Evaluation of retinal blood flow before and after panretinal photocoagulation using pattern scan laser for diabetic
retinopathy. Curr. Eye Res. 42, 1707–1712 (2017).
58. Grunwald, J. E., Brucker, A. J., Petrig, B. L. & Riva, C. E. Retinal blood flow regulation and the clinical response to panretinal
photocoagulation in proliferative diabetic retinopathy. Ophthalmology 96, 1518–1522 (1989).
59. Fujio, N., Feke, G. T., Goger, D. G. & McMeel, J. W. Regional retinal blood flow reduction following half fundus photocoagulation
treatment. Br. J. Ophthalmol. 78, 335–338 (1994).
60. Tuka, V., Slavikova, M., Svobodova, J. & Malik, J. Diabetes and distal access location are associated with higher wall shear rate in
feeding artery of PTFE grafts. Nephrol. Dial Transplant. 21, 2821–2824 (2006).
61. Kamiya, A. & Togawa, T. Adaptive regulation of wall shear stress to flow change in the canine carotid artery. Am. J. Physiol. 239,
H14-21 (1980).
62. Zarins, C. K., Zatina, M. A., Giddens, D. P., Ku, D. N. & Glagov, S. Shear stress regulation of artery lumen diameter in experimental
atherogenesis. J. Vasc. Surg. 5, 413–420 (1987).
63. Langille, B. L. & O’Donnell, F. Reductions in arterial diameter produced by chronic decreases in blood flow are endothelium-
dependent. Science 231, 405–407 (1986).
64. Langille, B. L., Bendeck, M. P. & Keeley, F. W. Adaptations of carotid arteries of young and mature rabbits to reduced carotid blood
flow. Am. J. Physiol. 256, H931-939 (1989).
65. Khuu, L. A. et al. Aqueous humor endothelin-1 and total retinal blood flow in patients with non-proliferative diabetic retinopathy.
Eye 31, 1443–1450 (2017).
66. Schiffrin, E. L. Remodeling of resistance arteries in essential hypertension and effects of antihypertensive treatment. Am. J. Hyper-
tens. 17, 1192–1200 (2004).
67. Heagerty, A. M., Aalkjaer, C., Bund, S. J., Korsgaard, N. & Mulvany, M. J. Small artery structure in hypertension. Dual processes
of remodeling and growth. Hypertension 21, 391–397 (1993).
68. Intengan, H. D. & Schiffrin, E. L. Vascular remodeling in hypertension: Roles of apoptosis, inflammation, and fibrosis. Hyperten-
sion 38, 581–587 (2001).
69. Pannacciulli, N. et al. Effect of family history of type 2 diabetes on the intima-media thickness of the common carotid artery in
normal-weight, overweight, and obese glucose-tolerant young adults. Diabetes Care 26, 1230–1234 (2003).
70. Cuspidi, C. & Sala, C. Retinal wall-to-lumen ratio: A new marker of endothelial function?. J. Hypertens. 29, 33–35 (2011).
71. Landray, M. J. et al. Inflammation, endothelial dysfunction, and platelet activation in patients with chronic kidney disease: The
chronic renal impairment in Birmingham (CRIB) study. Am. J. Kidney Dis. 43, 244–253 (2004).
72. Ooi, Q. L. et al. The microvasculature in chronic kidney disease. Clin. J. Am. Soc. Nephrol. 6, 1872–1878 (2011).
73. Hostetter, T. H. Human renal response to meat meal. Am. J. Physiol. 250, F613-618 (1986).
74. Okuno, T., Sugiyama, T., Tominaga, M., Kojima, S. & Ikeda, T. Effects of caffeine on microcirculation of the human ocular fundus.
Jpn. J. Ophthalmol. 46, 170–176 (2002).
75. Terai, N., Spoerl, E., Pillunat, L. E. & Stodtmeister, R. The effect of caffeine on retinal vessel diameter in young healthy subjects.
Acta Ophthalmol. 90, e524-528 (2012).
76. Lotfi, K. & Grunwald, J. E. The effect of caffeine on the human macular circulation. Investig. Ophthalmol. Vis. Sci. 32, 3028–3032
(1991).
Acknowledgements
This research received no specific grant from any funding agency in the public, commercial or not-for-profit
sectors.
Scientific Reports | (2021) 11:4653 | https://doi.org/10.1038/s41598-021-84067-2 11
Vol.:(0123456789)www.nature.com/scientificreports/
Author contributions
The design and conduct of the study (T.I.); collection of data (Y.U.); management, analysis, and interpretation
of data (Y.U., T.I., K.G., R.T., K.Y., E. R.); and preparation, review, and approval of the manuscript (Y.U., T.I.,
K.G., R.T., K.Y., E.R., H.T.).
Competing interests
The authors declare no competing interests.
Additional information
Correspondence and requests for materials should be addressed to T.I.
Reprints and permissions information is available at www.nature.com/reprints.
Publisher’s note Springer Nature remains neutral with regard to jurisdictional claims in published maps and
institutional affiliations.
Open Access This article is licensed under a Creative Commons Attribution 4.0 International
License, which permits use, sharing, adaptation, distribution and reproduction in any medium or
format, as long as you give appropriate credit to the original author(s) and the source, provide a link to the
Creative Commons licence, and indicate if changes were made. The images or other third party material in this
article are included in the article’s Creative Commons licence, unless indicated otherwise in a credit line to the
material. If material is not included in the article’s Creative Commons licence and your intended use is not
permitted by statutory regulation or exceeds the permitted use, you will need to obtain permission directly from
the copyright holder. To view a copy of this licence, visit http://creativecommons.org/licenses/by/4.0/.
© The Author(s) 2021
Scientific Reports | (2021) 11:4653 | https://doi.org/10.1038/s41598-021-84067-2 12
Vol:.(1234567890)You can also read