Defining, quantifying, and characterizing adult frequent users of a suburban Canadian emergency department

Page created by Antonio Graham
 
CONTINUE READING
Defining, quantifying, and characterizing adult frequent users of a suburban Canadian emergency department
ORIGINAL RESEARCH N RECHERCHE ORIGINALE

                      ED Administration

                      Defining, quantifying, and characterizing adult
                      frequent users of a suburban Canadian emergency
                      department
                      Jessica Moe, MA, MD*; Allan L. Bailey, MD, CCFP3; Ryan Oland, MD, CCFP (EM)4;
                      Linda Levesque, BScPhm, MSc, PhD1; Heather Murray, MD, MScI

                      ABSTRACT                                                                                   Adoption of these definitions would allow comparison
                                                                                                                 across centres in future research and facilitate targeted
                      Introduction: Frequent emergency department (ED) users are
                                                                                                                 interventions for frequent and extreme frequent ED users.
                      inconsistently defined and poorly studied in Canada. The
                      purpose of this study was to develop uniform definitions,
                      quantify ED burden, and characterize adult frequent users of                               RÉSUMÉ
                      a suburban community ED.
                      Methods: We retrospectively reviewed the administrative                                    Introduction: Les utilisateurs fréquents des services
                      database of the WestView ED in Alberta for patients $ 18                                   d’urgence (SU) forment un groupe mal défini et ont fait
                      years of age presenting during the fiscal year of 2010. Adult                              l’objet de peu d’analyse au Canada. L’étude décrite ici visait à
                      frequent users and extreme frequent users were defined as                                  élaborer une définition uniforme des utilisateurs fréquents
                      patients with yearly visit numbers greater than the 95th and                               des services d’urgence suburbains, chez les adultes; à les
                      99th percentiles, respectively. Demographic information                                    caractériser et à quantifier leur fardeau dans les SU.
                      including age, sex, ED length of stay, diagnoses, Canadian                                 Méthode: Nous avons procédé à un examen rétrospectif de
                      Triage and Acuity Scale (CTAS) level, and disposition were                                 la base de données administrative du SU WestView, en
                      collected and stratified by ED frequency of use categories.                                Alberta, à la recherche de patients âgés de 18 ans et plus,
                      Results: The study included 22,333 ED visits by 14,223                                     ayant consulté un médecin au service des urgences au cours
                      patients. Frequent users represented 3.1% of patients and                                  de l’exercice financier de 2010. Les grands utilisateurs et les
                      13.8% of visits. Extreme frequent users represented 0.8% of                                très grands utilisateurs de SU ont été définis comme des
                      patients, 5.4% of visits, and 568,879 cumulative ED minutes                                patients comptant un nombre annuel de consultations
                      (395 days). Nonfrequent users had one to four, frequent                                    supérieur au 95e rang et au 99e rang centile, respectivement.
                      users had five or more, and extreme frequent users had eight                               Il y a d’abord eu collecte de données démographiques sur
                      or more visits over a 12-month period. Frequent users and                                  l’âge, le sexe, la durée du séjour au SU, le diagnostic, le
                      extreme frequent users had a significantly longer ED length                                niveau d’urgence selon l’Échelle canadienne de triage et de
                      of stay overall and in most age categories. Alcohol-related                                gravité, et les suites à donner, puis classement des patients
                      behavioural disorders, anxiety, nausea/vomiting, and                                       selon les catégories de fréquence d’utilisation des services
                      chronic obstructive pulmonary disease were prominent                                       d’urgence.
                      diagnoses, suggesting that psychiatric, somatic, and chronic                               Résultats: Au total, 14,223 patients comptaient 22,333
                      illnesses may underlie recurrent visits. Admission rates were                              consultations au SU. Les grands utilisateurs représentaient
                      significantly higher for frequent compared to nonfrequent                                  3.1 % des patients mais totalisaient 13.8 % des consultations;
                      users.                                                                                     quant aux très grands utilisateurs, ils représentaient 0.8 %
                      Conclusions: We propose reproducible definitions for adult                                 des patients mais totalisaient 5.4 % des consultations et
                      frequent and extreme frequent ED users and provide                                         568,879 minutes au SU (395 jours). Les utilisateurs ponctuels
                      information on the characteristics and burden of care of                                   comptaient d’une à quatre consultations sur une période de
                      these groups at a community Canadian suburban ED.                                          12 mois; les grands utilisateurs, cinq ou plus; et les très

                      From *RCPSC Emergency Medicine Residency Program, University of Alberta; 3WestView Physician Collaborative and WestView Primary Care Network;
                      Department of Family Medicine, University of Alberta; 4WestView Health Centre; WestView Physician Collaborative and WestView Primary Care
                      Network; Department of Emergency Medicine, University of Alberta, Edmonton, AB; 1Department of Community Health and Epidemiology, Queen’s
                      University; IDepartment of Emergency Medicine and Department of Community Health and Epidemiology, Queen’s University, Kingston, ON.

                      Correspondence to: Dr. Jessica Moe, RCPSC Emergency Medicine Residency Program, University of Alberta, 750 University Terrace, 8303 - 112
                      Street, Edmonton, AB T6G 2T4; jessica.moe@gmail.com.

                      This article has been peer reviewed.

                      ß Canadian Association of Emergency Physicians                          CJEM 2013;15(4):214-226                                          DOI 10.2310/8000.2013.130936

                      214      2013;15(4)                                                          CJEM N JCMU

Downloaded from https://www.cambridge.org/core. IP address: 46.4.80.155, on 16 Oct 2021 at 23:24:37, subject to the Cambridge Core terms of use, available at https://www.cambridge.org/core/terms.
https://doi.org/10.2310/8000.2013.130936
Defining, quantifying, and characterizing adult frequent users of a suburban ED

                      grands utilisateurs, huit ou plus. Dans l’ensemble, les grands                             d’urgence, chez les adultes, en plus de fournir des données
                      utilisateurs et les très grands utilisateurs avaient une durée                           sur les caractéristiques de ces groupes et le fardeau de soins
                      de séjour au SU significativement plus longue que les autres                              qu’ils imposent dans les SU surburbains au Canada.
                      utilisateurs, et ce, dans la plupart des tranches d’âge. Les                              L’adoption de ces définitions permettrait de faire des compar-
                      diagnostics les plus fréquents étaient les troubles du                                   aisons entre centres, dans de futurs travaux de recherche, et
                      comportement liés à l’alcool, l’anxiété, les nausées et                               faciliterait la mise en oeuvre d’interventions ciblant les grands
                      vomissements, et la bronchopneumopathie chronique                                          utilisateurs et les très grands utilisateurs de SU.
                      obstructive, ce qui donne à penser que les maladies
                      mentales, somatiques, et chroniques peuvent motiver des
                      consultations à répétition. Les taux d’hospitalisation étaient                         Keywords: emergency medical services; emergency medi-
                      aussi significativement plus élevés chez les grands utilisa-                             cine; emergency service; frequent emergency department
                      teurs que chez les utilisateurs ponctuels.                                                 users; health care costs; health care quality, access, and
                      Conclusions: Nous proposons des définitions reproductibles                                evaluation; health services’ needs and demands; hospital;
                      de grands utilisateurs et de très grands utilisateurs de services                         overuse of health services

                      In the face of system capacity shortfalls and cost                                         geography, population distribution, and nationalized
                      containment pressures, frequent emergency depart-                                          health insurance system. Beyond this, it is probable
                      ment (ED) users are receiving increasing attention.1,2                                     that frequent ED users differ from community to
                      Previous studies have employed inconsistent defini-                                        community because of regional differences in the
                      tions of frequent ED use based on absolute cutoffs,                                        provision of support services and infrastructure.
                      most often four or more visits in 1 year1–20 but ranging                                   Thus, the generalizability of results and interventions
                      from three visits in 2 years4 to three visits in 1 month.18                                even within national borders may be limited without a
                      One group of investigators created multiple thresholds                                     uniform definition of frequency of use that permits
                      based loosely on mean and standard deviation to                                            cross-site comparisons. Clearly, the first step is to
                      describe gradients of frequency of use.3 In another                                        create and evaluate a set of standard definitions. The
                      study, no specific visit threshold was defined.21 This                                     purpose of this study was to develop uniform defini-
                      variability is problematic; without a uniform definition,                                  tions, quantify ED burden, and characterize adult
                      it is impossible to compare results across centres,                                        frequent users of a suburban community ED.
                      identify differences in support services and infrastruc-
                      ture that may influence the number of frequent users,                                      METHODS
                      and formulate generalizable policy recommendations.
                         Frequent ED users represent a disproportionate visit                                    Study design
                      burden; previous work has shown that 4.5 to 8% of
                      patients account for 21 to 28% of visits.1 Frequent ED                                     We retrospectively reviewed the administrative data-
                      visits may predict return ED visits within 72 hours,11                                     base of the WestView ED in Alberta for adult patients
                      and certain subsets of frequent users may have longer                                      presenting during the fiscal year of 2010 (April 1,
                      ED length of stay (LOS) and higher admission rates.12                                      2010–March 31, 2011). This was a secondary analysis
                         Frequent ED users appear to be heterogeneous, with                                      of ED abstract data collected and provided by Alberta
                      a bimodal age distribution and differing chief com-                                        Health Services (AHS). The study was approved by
                      plaints.1 Substance abuse, mental illness,1,3–5 perceived                                  the University of Alberta Health Research Ethics
                      health status, previous hospitalization or ED use,                                         Board.
                      chronic illness, low socioeconomic status, and per-
                      ceived low physician availability have been identified as                                  Study setting and population
                      risk factors.6–10
                         Canadian studies on frequent ED users have to date                                      The WestView ED is a 24-bed primary care suburban
                      been limited to select subpopulations.4,6,14,15,22 In gen-                                 community ED with an average yearly census of
                      eral, frequent ED users have been less well studied in                                     26,649 ED visits between 2005 and 2011. It serves a
                      Canada than in the United States. This represents an                                       catchment population of 76,428 persons in the
                      important gap as the results of American studies are                                       communities of Stony Plain, Spruce Grove, and
                      likely not generalizable owing to Canada’s unique                                          Parkland County outside of Edmonton.23

                                                                                                   CJEM N JCMU                                                                2013;15(4)       215

Downloaded from https://www.cambridge.org/core. IP address: 46.4.80.155, on 16 Oct 2021 at 23:24:37, subject to the Cambridge Core terms of use, available at https://www.cambridge.org/core/terms.
https://doi.org/10.2310/8000.2013.130936
Moe et al

                      Selection and description of participants                                                  reabstraction study was released in 2008 and included
                                                                                                                 validation of diagnostic coding.26 Additionally, AHS
                      The study population comprised adults 18 years of age                                      carried out an ambulatory care reabstraction study on
                      and older at the time of their visit who used the                                          2003–2004 data, which involved reabstraction of ran-
                      WestView ED at least once during the 12-month study                                        domly selected charts from ambulatory care settings
                      period. We excluded children because we hypothesized a                                     including EDs across the province. Overall, high
                      priori that the characteristics of pediatric frequent users                                agreement rates were found between the reabstracted
                      would differ from those of adults and thus would make                                      and original chart data. Provincially, ED data had 98%
                      the identification of standard definitions and determina-                                  agreement for encounter and demographic data and
                      tion of visit patterns difficult in a combined analysis.                                   87% agreement for diagnosis, which were above AHS’s
                         The WestView community ED visit database                                                predetermined target rates.27 These results confirm the
                      captures both ED and outpatient visits, including visits                                   accuracy of the national and provincial ED databases
                      in which patients are asked to return for follow-up.                                       from which our study data are drawn.
                      During the planning stages of this project, a focus
                      group was held involving two emergency physicians at                                       Statistical analysis
                      the study site to identify the ICD-10-CA codes24 used
                      for scheduled return visits. Planned returns included a                                    We used the frequency distribution of ED visits to
                      weekly cast clinic, to which patients requiring cast care                                  define our adult frequent use categories. The primary
                      are referred. To prevent these visits from skewing the                                     advantage of distribution-based definitions compared to
                      data on adult frequent users, ICD-10-CA codes for                                          fixed cutoffs is that the frequent use thresholds
                      orthopedic follow-up care were excluded if they                                            identified are inherently adjusted for underlying visit
                      occurred during the times and dates of a scheduled                                         volume, thus making the results comparable across
                      cast clinic. Additionally, WestView ED patients who                                        institutions. As the data for the number of ED visits
                      require return visits for intravenous antibiotic treat-                                    were not normally distributed, we used percentiles of
                      ments or low–molecular-weight heparin for venous                                           the visit distribution to identify frequent use categories.
                      thromboembolic disease or atrial fibrillation are asked                                    We defined adult frequent users a priori as patients with
                      to return to the ED to receive these treatments;                                           a total number of yearly visits above the 95th percentile
                      therefore, ICD-10-CA codes for such conditions were                                        and adult extreme frequent users as patients with a total
                      excluded if they occurred on the same or a subsequent                                      number of yearly visits above the 99th percentile. The
                      day after an initial visit with the same diagnostic code.                                  95th percentile represents the ED use of 95% of the
                                                                                                                 study population and is thus conceptually similar to
                      Data sources and data quality                                                              using two standard deviations from the mean in
                                                                                                                 normally distributed data, whereas the 99th percentile
                      To conduct this study, we used WestView ED data that                                       captures the extremes of any distribution.
                      had been submitted to AHS, aggregated provincially,                                           The following patient characteristics were collected
                      and forwarded to the Canadian Institute of Health                                          for study patients and stratified by ED frequency of use
                      Information (CIHI) as part of the National Ambulatory                                      categories: age, sex, ED LOS, Canadian Triage and
                      Care Reporting System (NACRS). Our data were thus                                          Acuity Scale (CTAS) level, disposition, and primary
                      subject to rigorous checks applied by AHS and the CIHI                                     ICD-10-CA diagnosis. All analyses were two-way
                      for completeness and accuracy. Quality assurance                                           comparisons between adult frequent users and users
                      measures include features built into abstraction software                                  and between adult extreme frequent users and non-
                      to verify the accuracy of patient data and visit informa-                                  frequent users. Admission rates were compared using
                      tion, audits to identify discrepancies in coding fields, and                               chi-square tests for proportions or chi-square exact
                      coding done by trained health information management                                       tests as appropriate. LOS was compared using the
                      professionals who follow Canadian coding standards.                                        Mann-Whitney test for means. Statistical significance
                      Furthermore, the NACRS carries out external database                                       was defined as an alpha level of # 0.05, and no
                      validation via occasional reabstraction studies involving                                  adjustments were made for multiple comparisons. All
                      chart reviews and comparison of results to the data                                        statistical analyses were conducted using SPSS version
                      originally submitted to the NACRS.25 The last such                                         19 (SPSS Inc, Chicago, IL).

                      216      2013;15(4)                                                          CJEM N JCMU

Downloaded from https://www.cambridge.org/core. IP address: 46.4.80.155, on 16 Oct 2021 at 23:24:37, subject to the Cambridge Core terms of use, available at https://www.cambridge.org/core/terms.
https://doi.org/10.2310/8000.2013.130936
Defining, quantifying, and characterizing adult frequent users of a suburban ED

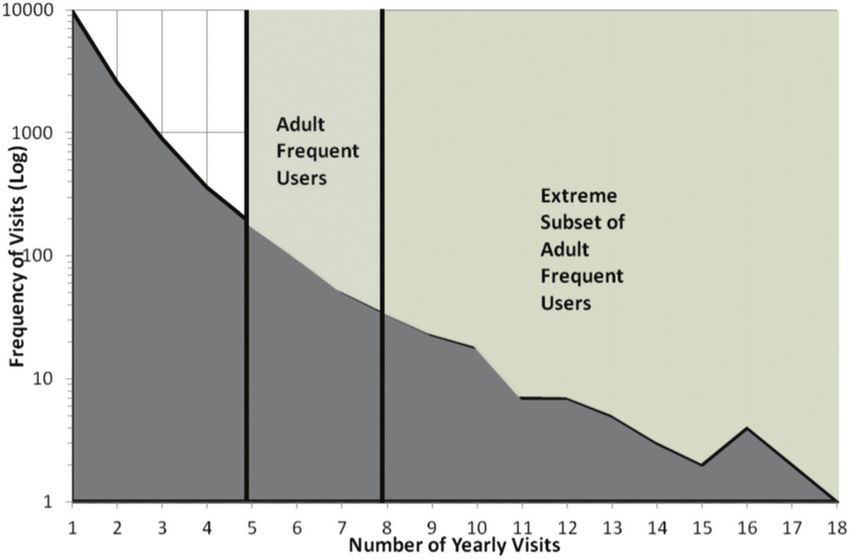
                                                                                                                                                    Figure 1. Distribution of patient
                                                                                                                                                    visit counts during the study
                                                                                                                                                    period.

                      RESULTS                                                                                      Figure 1 shows the distribution of patient visit
                                                                                                                 counts during the study period, and Figure 2 shows the
                      A total of 22,333 ED visits made by 14,223 unique                                          age distribution of patients stratified by frequency of
                      patients met the inclusion criteria, with a mean number                                    use groups. When our definitions of adult frequent and
                      of visits per patient of 2.68 (SD 3.03). A total of 8,575                                  extreme frequent use were applied to the study
                      visits were excluded (27.7% of total visits): 7,086 (83%)                                  population, they resulted in a visit threshold of five
                      because they involved children and 1,489 (17%)                                             or more annual visits for frequent use and eight or
                      because of scheduled returns. Visits by children and                                       more annual visits for extreme frequent use.
                      scheduled return visits represented 23% and 5% of                                            Adult frequent users represented 3.1% of patients
                      total annual visits, respectively.                                                         and accounted for 13.8% of all visits during the study

                                                                                                                                                    Figure 2. Age distribution of
                                                                                                                                                    patients stratified by frequency of
                                                                                                                                                    use groups.

                                                                                                   CJEM N JCMU                                                                2013;15(4)       217

Downloaded from https://www.cambridge.org/core. IP address: 46.4.80.155, on 16 Oct 2021 at 23:24:37, subject to the Cambridge Core terms of use, available at https://www.cambridge.org/core/terms.
https://doi.org/10.2310/8000.2013.130936
Moe et al

                        Table 1. Demographic and visit characteristics of study population stratified by user group

                                                                                          Adult nonfrequent users                        Adult frequent users          Extreme subset of adult
                        Characteristic                                                           (1–4 visits)                                ($ 5 visits)             frequent users ($ 8 visits)

                        Patient
                          Patients, n (% all patients)                                      13,778     (96.9)                              445   (3.1)                     111   (0.8)
                          Yearly visits per patient, mean (95% CI)                             1.4     (1.4–1.4)                           6.9   (6.6–7.2)                10.8   (10.0–11.6)
                          Male sex, % patients (95% CI)                                       50.0     (49.3–50.7)                        48.3   (46.5–50.1)              47.7   (44.9–50.5)
                          Age at first visit in years, mean (95% CI)                          45.0     (44.7–45.3)                        50.9   (48.9–52.8)              49.1   (45.5–52.8)
                        Visit
                          Visits, n (% all visits)                                          19,256 (86.2)                                3,077 (13.8)                    1,203 (5.4)
                          Visit triage level, % visits (95% CI)
                              CTAS 1                                                           0.6 (0.5–0.7)                               0.6 (0.3–0.9)                    0.9 (0.4–1.4)
                              CTAS 2                                                          10.4 (10.0–10.8)                           13.5 (12.3–14.7)                  11.6 (9.8–13.4)
                              CTAS 3                                                          40.0 (39.3–40.7)                           45.9 (44.1–47.7)                  49.3 (46.5–52.1)
                              CTAS 4                                                          43.9 (43.2–44.6)                           33.6 (31.9–35.3)                  32.9 (30.2–35.6)
                              CTAS 5                                                           5.2 (4.9–5.5)                               6.4 (5.5–7.3)                    5.3 (4.0–6.6)
                          ED LOS in minutes, mean (95% CI)                                   330.5 (322.0–339.0)                        480.1 (452.2–508.0)*              472.9 (431.5–514.3)*
                          Top five primary diagnoses,                                  Chest pain, unspecified, 570                  Chest pain, unspecified, 81     Nausea with vomiting, 37
                          n (% total visits for group)                                 (3.0)                                         (2.6)                           (3.1)
                                                                                       Urinary tract infection, site                 Other and unspecified           Vomiting alone, 32 (2.7)
                                                                                       not specified, 411 (2.1)                      abdominal pain, 72 (2.3)
                                                                                       Open wound of finger(s)                       Urinary tract infection, site   Chest pain, unspecified,
                                                                                       without damage to nail,                       not specified, 66 (2.1)         31 (2.6)
                                                                                       uncomplicated, 391 (2.0)
                                                                                       Other and unspecified                         Headache, 48 (1.6)              Anxiety disorder, unspecified,
                                                                                       abdominal pain 354 (1.8)                                                      27 (2.2)
                                                                                       Gastroenteritis and colitis of                Nausea with vomiting, 48        Mental and behavioural
                                                                                       unspecified origin, 311 (1.6)                 (1.6)                           disorders due to use of
                                                                                                                                                                     alcohol, acute intoxication,
                                                                                                                                                                     22 (1.8)
                           Post-ED disposition, % visits (95% CI)
                             Home or private dwelling                                           83.4   (82.9–83.9)                        78.8   (77.4–80.2)              80.3   (78.1–82.5)
                             Left against medical advice                                         7.6   (7.2–8.0)                           7.0   (6.1–7.9)                 8.4   (6.8–10.0)
                             Residence with support services                                     2.3   (2.1–2.5)                           5.3   (4.5–6.1)                 4.8   (3.6–6.0)
                             Admitted as inpatient                                               2.4   (2.2–2.6)                           4.4   (3.7–5.1)3                3.0   (2.0–4.0)
                        CTAS 5 Canadian Triage and Acuity Scale; ED 5 emergency department; LOS 5 length of stay.
                        *Statistically significant compared to nonfrequent user group using a Mann-Whitney test of means at an alpha level of 0.05.
                        3
                          Statistically significant compared to nonfrequent user group using a chi-square test of proportions at an alpha level of 0.05.

                      period. The extreme subset of adult frequent users                                                  2.4%, 4.4%, and 3.0%, respectively, resulted in
                      comprised 0.8% of patients, 5.4% of yearly visits, and                                              hospital admission. The admission rate was statistically
                      568,879 cumulative minutes (395 days) in the ED over                                                significantly higher for adult frequent users compared
                      the study year.                                                                                     to nonfrequent users (Figure 4).
                         Table 1 shows the demographic and visit character-                                                  Table 2, Table 3, and Table 4 are available as online
                      istics of the study population stratified by user group                                             appendices at ,http://www.xxx.xxx. and present
                      and illustrates, along with Figure 3, that ED LOS was                                               demographic and visit data for adult nonfrequent,
                      statistically significantly longer for adult frequent users                                         frequent, and extreme frequent users, respectively,
                      and the extreme frequent user subset compared to                                                    categorized by age group. Chest pain and urinary tract
                      adult nonfrequent users. Adult frequent and extreme                                                 infections were common primary diagnoses for both
                      frequent users had a statistically significantly higher                                             adult nonfrequent and frequent users. Nausea and/or
                      LOS than adult nonfrequent users in all age categories                                              vomiting were common diagnoses for younger groups
                      except for ages 81 to 102 years. Of visits by adult                                                 of adult extreme frequent users, accounting for 9.6% of
                      nonfrequent, frequent, and extreme frequent users,                                                  visits in patients ages 18 to 50 years. Mental and

                      218      2013;15(4)                                                                  CJEM N JCMU

Downloaded from https://www.cambridge.org/core. IP address: 46.4.80.155, on 16 Oct 2021 at 23:24:37, subject to the Cambridge Core terms of use, available at https://www.cambridge.org/core/terms.
https://doi.org/10.2310/8000.2013.130936
Defining, quantifying, and characterizing adult frequent users of a suburban ED

                                                                                                                                                    Figure 3. Mean emergency
                                                                                                                                                    department length of stay (LOS) by
                                                                                                                                                    adult user group and age category.
                                                                                                                                                    Bars represent a 95% CI for the
                                                                                                                                                    mean LOS. *Statistically signifi-
                                                                                                                                                    cant compared to nonfrequent
                                                                                                                                                    user group in the same age cate-
                                                                                                                                                    gory using a Mann-Whitney test of
                                                                                                                                                    means at an alpha level of 0.05.

                      behavioural disorders due to alcohol intoxication were                                     years, in which the adult extreme frequent subset had a
                      among the top five primary diagnoses for adult extreme                                     lower proportion of admissions than adult nonfrequent
                      frequent users. Anxiety disorder was a common                                              users.
                      diagnosis for adult frequent users and the extreme
                      frequent subset 18 to 50 years of age. Chronic                                             DISCUSSION
                      obstructive pulmonary disease accounted for 14.3%
                      of visits by adult extreme frequent users 66 to 80 years                                   We developed a standardized approach to defining
                      of age.                                                                                    frequent ED users and characterized the adult frequent
                         Admission rates for adult frequent users and the                                        ED users at a Canadian community suburban ED. Our
                      extreme frequent subset were not statistically signifi-                                    distribution-based definitions offer advantages over the
                      cantly different from adult nonfrequent users of the                                       use of absolute cutoffs. First, this approach provides a
                      same age categories except for the age group 81 to 102                                     measure of adult frequent ED use that is based on

                                                                                                                                                    Figure 4. Visits ending in hospital
                                                                                                                                                    admission by adult user group and
                                                                                                                                                    age category. Bars represent a 95%
                                                                                                                                                    CI for the percentage of patients
                                                                                                                                                    admitted. *Statistically significant
                                                                                                                                                    compared to the nonfrequent user
                                                                                                                                                    group in the same age category
                                                                                                                                                    using a chi-square test of propor-
                                                                                                                                                    tions at an alpha level of 0.05.

                                                                                                   CJEM N JCMU                                                                2013;15(4)       219

Downloaded from https://www.cambridge.org/core. IP address: 46.4.80.155, on 16 Oct 2021 at 23:24:37, subject to the Cambridge Core terms of use, available at https://www.cambridge.org/core/terms.
https://doi.org/10.2310/8000.2013.130936
Moe et al

                        Table 2. Demographic and visit characteristics of adult nonfrequent users by age category

                                                                                                                     Age category

                        Characteristic                            18–30                         31–50                        51–65                       66–80                     81–102

                        Patient
                          Patients, n (% of all     3,850 (27.9)                       4,808 (34.9)                  2,890 (21.0)                1,620 (11.8)                610 (4.4)
                          nonfrequent user
                          visits)
                          Yearly visits per           1.4 (1.4–1.4)                       1.4 (1.3–1.4)                 1.4 (1.4–1.4)               1.5 (1.4–1.5)             1.7 (1.6–1.8)
                          patient mean (95% CI)
                          Male sex, % (95% CI)       48.1 (46.8–49.4)                    51.9 (50.7–53.1)             48.1 (46.5–49.7)             49.2 (47.2–51.2)         41.0 (38.0–44.0)
                        Visit
                          Visits, n (% of all       5,378 (27.9)                       6,505 (33.8)                  3,982 (20.7)                2,354 (12.2)              1,037 (5.4)
                          nonfrequent user visits)
                          Visit triage level, %
                          (95% CI)
                              CTAS 1                  0.2 (0.1–0.3)                      0.3   (0.2–0.4)               1.0   (0.7–1.3)             1.4   (0.9–1.9)       0.9       (0.3–1.5)
                              CTAS 2                  6.8 (6.1–7.5)                      9.5   (8.8–10.2)             13.9   (12.8–15.0)          13.8   (12.4–15.2)    12.8       (10.8–14.8)
                              CTAS 3                 38.1 (36.8–39.4)                   39.2   (38.0–40.4)            38.3   (36.8–39.8)          44.6   (42.6–46.6)    50.8       (47.8–53.8)
                              CTAS 4                 49.0 (47.7–50.3)                   45.7   (44.5–46.9)            41.4   (39.9–42.9)          36.0   (34.1–38.0)    33.2       (30.3–36.1)
                              CTAS 5                  5.8 (5.2–6.4)                      5.4   (4.9–5.9)               5.4   (4.7–6.1)             4.2   (3.4–5.0)       2.3       (1.4–3.2)
                          ED LOS in minutes,        224.5 (216.5–232.4)                258.5   (249.4–267.7)         343.3   (325.6–361.0)       523.6   (487.1–560.1) 844.8       (764.4–925.3)
                          mean (95% CI)
                          Top five primary         Open wound of                      Chest pain,            Chest pain,            Urinary tract                           Urinary tract
                          diagnoses, n (% total finger(s) without                     unspecified, 212 (3.3) unspecified, 167 (4.2) infection, site not                     infection, site
                          visits for age category) damage to nail,                                                                  specified, 89 (3.8)                     not specified,
                                                   uncomplicated,                                                                                                           61 (5.9)
                                                   141 (2.6)
                                                   Gastroenteritis               Open wound of                      Other and unspecified Chest pain,           Congestive heart
                                                   and colitis of                finger(s) without                  abdominal pain, 78    unspecified, 78 (3.3) failure, 47 (4.5)
                                                   unspecified origin,           damage to nail,                    (2.0)
                                                   119 (2.2)                     uncomplicated,
                                                                                 153 (2.4)
                                                        Urinary tract infection, Other and unspecified         Urinary tract infection, Chronic obstructive                 Chest pain,
                                                        site not specified,      abdominal pain, 152           site not specified,      pulmonary disease                   unspecified,
                                                        98 (1.8)                 (2.3)                         73 (1.8)                 with acute                          26 (2.5)
                                                                                                                                        exacerbation,
                                                                                                                                        unspecified,
                                                                                                                                        61 (2.6)
                                                        Sprain and strain of          Gastroenteritis          Open wound of            Dizziness and                       Dizziness and
                                                        ankle, unspecified,           and colitis of           finger(s) without        giddiness, 44 (1.9)                 giddiness, 26
                                                        90 (1.7)                      unspecified origin,      damage to nail,                                              (2.5)
                                                                                      100 (1.5)                uncomplicated,
                                                                                                               67 (1.7)
                                                        Chest pain,                   Urinary tract infection, Unspecified renal        Benign                              Pneumonia,
                                                        unspecified, 87 (1.6)         site not specified,      colic, 56 (1.4)          hypertension,                       unspecified,
                                                                                      90 (1.4)                                          37 (1.6)                            20 (1.9)
                                                                                                                                        Gastroenteritis and
                                                                                                                                        colitis of unspecified
                                                                                                                                        origin, 37 (1.6)
                           Post-ED disposition,
                           % (95% CI)
                             Home or private               87.0 (86.1–87.9)              87.2 (86.4–88.0)             85.3 (84.2–86.4)             76.3 (74.6–78.0)         50.3 (47.3–53.3)
                             dwelling
                             Left against medical             10 (9.2–10.8)               8.1 (7.4–8.8)                 6.2 (5.5–6.9)               4.5 (3.7–5.3)             3.4 (2.3–4.5)
                             advice
                             Residence with                  0.1 (0.0–0.2)                0.5 (0.3–0.7)                 1.1 (0.8–1.4)               4.8 (3.9–5.7)           23.5 (20.9–26.1)
                             support services
                             Admitted as inpatient           0.4 (0.2–0.6)                0.6 (0.4–0.8)                 1.9 (1.5–2.3)               6.7 (5.7–7.7)           16.1 (13.9–18.3)
                        CTAS 5 Canadian Triage and Acuity Scale; ED 5 emergency department; LOS 5 length of stay.

                      220      2013;15(4)                                                          CJEM N JCMU

Downloaded from https://www.cambridge.org/core. IP address: 46.4.80.155, on 16 Oct 2021 at 23:24:37, subject to the Cambridge Core terms of use, available at https://www.cambridge.org/core/terms.
https://doi.org/10.2310/8000.2013.130936
Table 3. Demographic and visit characteristics of adult frequent users by age category

                                                                                                                                                                                                                                                                                                                    Age category

https://doi.org/10.2310/8000.2013.130936
                                                                                                                                                                                                                    Characteristic                               18–30                              31–50                      51–65                           66–80                           81–102

                                                                                                                                                                                                                    Patient
                                                                                                                                                                                                                      Patients, n (% of all frequent           101 (22.7)                   130 (29.2)                    85 (19.1)                       82 (18.4)                       47 (10.6)
                                                                                                                                                                                                                      user visits)
                                                                                                                                                                                                                      Yearly visits per patient,               6.9 (6.2–7.5)                 7.3 (6.6–8.0)               7.2 (6.6–7.7)                   6.2 (5.8–6.5)                   6.8 (6.0–7.6)
                                                                                                                                                                                                                      mean (95% CI)
                                                                                                                                                                                                                      Male sex, % (95% CI)                    45.1 (41.4–48.8)              40.3 (37.1–43.5)            60.3 (56.5–64.1)                53.1 (48.8–57.4)                51.9 (46.5–57.3)
                                                                                                                                                                                                                    Visit
                                                                                                                                                                                                                      Visits, n (% of all                      678 (22.0)                   928 (30.2)                  625 (20.3)                      522 (17.0)                       324 (10.5)
                                                                                                                                                                                                                      frequent user visits)
                                                                                                                                                                                                                      Visit triage level,
                                                                                                                                                                                                                      % (95% CI)
                                                                                                                                                                                                                          CTAS 1                               0.1 (0.1–0.7)                 0.9   (0.3–1.5)            1.0   (0.2–1.8)                 0.8   (0.6–1.2)                    0   (0–0)
                                                                                                                                                                                                                          CTAS 2                               8.1 (6.0–10.2)               13.5   (11.3–15.7)         18.7   (15.6–21.8)              13.6   (10.7–16.5)               14.5   (10.7–18.3)
                                                                                                                                                                                                                          CTAS 3                              43.1 (39.4–46.8)              46.4   (43.2–49.6)         48.0   (44.1–51.9)              48.9   (44.6–53.2)               41.0   (35.6–46.4)
                                                                                                                                                                                                                          CTAS 4                              41.2 (37.5–44.9)              32.5   (29.5–35.5)         27.7   (24.2, 31.2)             30.3   (26.4–34.2)               37.3   (32.0–42.6)
                                                                                                                                                                                                                          CTAS 5                               7.4 (5.4–9.4)                 6.7   (5.1–8.3)            4.6   (3.0–6.2)                 6.5   (4.4–8.6)                  7.1   (4.3–9.9)
                                                                                                                                                                                                                      ED LOS in minutes, mean               304.5 (271.6–337.3)*           379.8   (349.8–409.9)*     501.5   (441.7–561.3)*          677.8   (576.6–779.0)*           775.4   (650.4–900.4)
                                                                                                                                                                                                                      (95% CI)
                                                                                                                                                                                                                      Top five primary diagnoses, Tubulointerstitial nephritis, not    Chest pain, unspecified,     Chest pain, unspecified,        Urinary tract infection,        Urinary tract infection,

                                                                                                                                                                                                      CJEM N JCMU
                                                                                                                                                                                                                      n (% total visits for age      specified as acute or chronic,    27 (2.9)                     25 (4.0)                        site not specified,             site not specified,
                                                                                                                                                                                                                      category)                      21 (3.1)                                                                                       26 (5.0)                        17 (5.2)
                                                                                                                                                                                                                                                     Other and unspecified abdominal   Headache, 27 (2.9)           Atrial fibrillation, 18 (2.9)   Chronic obstructive             Blood transfusion
                                                                                                                                                                                                                                                     pain, 20 (2.9)                                                                                 pulmonary disease               (without reported
                                                                                                                                                                                                                                                                                                                                                    with acute exacerbation,        diagnosis), 13 (4.0)
                                                                                                                                                                                                                                                                                                                                                    unspecified, 24 (4.6)
                                                                                                                                                                                                                                                   Anxiety disorder, unspecified,      Nausea with vomiting,        Other and unspecified           Atrial fibrillation, 15 (2.9)   Pneumonia, unspecified,
                                                                                                                                                                                                                                                   16 (2.4)                            27 (2.9)                     abdominal pain, 18 (2.9)                                        11 (3.4)
                                                                                                                                                                                                                                                   Vomiting alone, 16 (2.4)            Other and unspecified        Unspecified renal colic,        Epistaxis, 11 (2.1)             Chest pain, unspecified,
                                                                                                                                                                                                                                                                                       abdominal pain, 26 (2.8)     16 (2.6)                                                        9 (2.8)
                                                                                                                                                                                                                                                   Headache, 14 (2.1)                  Vomiting alone, 21 (2.3)     Asthma, unspecified,            Chest pain, unspecified,        Malaise and fatigue,
                                                                                                                                                                                                                                                                                                                    without stated status           10 (1.9)                        8 (2.5);
                                                                                                                                                                                                                                                                                                                    asthmaticus, 14 (2.2)
                                                                                                                                                                                                                                                                                                                    Chronic obstructive                                             Retention of urine, 8 (2.5)
                                                                                                                                                                                                                                                                                                                    pulmonary disease with
                                                                                                                                                                                                                                                                                                                    acute exacerbation,
                                                                                                                                                                                                                                                                                                                    unspecified, 14 (2.2)
                                                                                                                                                                                                                                                                                                                    Retention of urine,
                                                                                                                                                                                                                                                                                                                    14 (2.2)

                                                                                                                                                                                                      2013;15(4)

Downloaded from https://www.cambridge.org/core. IP address: 46.4.80.155, on 16 Oct 2021 at 23:24:37, subject to the Cambridge Core terms of use, available at https://www.cambridge.org/core/terms.
                                                                                                                                                                                                                                                                                                                                                                                                                  Defining, quantifying, and characterizing adult frequent users of a suburban ED

                                                                                                                                                                                                      221
Moe et al

                                                                                                                                                                                                                                                                                                  commonly used statistical thresholds to identify the
                                                                                                                                                                                                                                                                                                  upper end of a distribution, in this case of the total

                                                                                                   25.6 (20.8–30.4)
                                                                                                   53.4 (48.0–58.8)

                                                                                                                      12.3 (8.7–15.9)
                                                                                                                                                                                                                                                                                                  number of visits per patient. Second, as this approach

                                                                                                    3.4 (1.4–5.4)
                                                                          81–102                                                                                                                                                                                                                  accounts for the total number of ED visits, it
                                                                                                                                                                                                                                                                                                  inherently controls for differences in infrastructure
                                                                                                                                                                                                                                                                                                  across centres that may influence the total number of
                                                                                                                                                                                                                                                                                                  ED visits. Although absolute visit thresholds are
                                                                                                                                                                                                                                                                                                  difficult to compare across sites as they are influenced
                                                                                                                                                                                                                                                                                                  and potentially distorted by the availability of regional
                                                                                                   70.7 (66.8–74.6)

                                                                                                                                                                                                                                                                                                  support services (e.g., community mental health services
                                                                                                    9.6 (7.0–12.1)

                                                                                                                      10.0 (7.4–12.6)
                                                                                                    4.4 (2.6–6.2)
                                                                          66–80

                                                                                                                                                                                                                                                                                                  or family physician accessibility), the measures we
                                                                                                                                                                                                                                                                                                  propose would allow cross-site comparisons. Finally,
                                                                                                                                                                                                                                                                                                  our definitions are reproducible by centres regardless of
                                                                                                                                                                                                                                                                                                  baseline population differences. Researchers could
                                                                                                                                                                                                                                                                                                  apply our percentile-based definitions to identify site-
                                                                                                                                                                                                                                                                                                  specific visit thresholds for adult frequent and extreme
                                                                                                                                                                                                                                                                                                  frequent use; various site thresholds could then be
                                                                                                   82.1 (79.1–85.1)
                                                                                                    7.2 (5.2–9.2)
                                                                                                    2.6 (1.4–3.8)

                                                                                                                      4.0 (2.5–5.5)

                                                                                                                                                                                                                                                                                                  plotted to produce a regional distribution from which an
                                                                          51–65
                                                           Age category

                                                                                                                                                                                                                                                                                                  overall mean or median could be calculated to facilitate
                                                                                                                                        *Statistically significant compared to nonfrequent user group in same age category using a Mann-Whitney test of means at an alpha level of 0.05.

                                                                                                                                                                                                                                                                                                  comparisons. Such an approach would also allow the
                                                                                                                                                                                                                                                                                                  assessment of adult frequent ED use over time, using
                                                                                                                                                                                                                                                                                                  either a baseline year as a reference point or determining
                                                                                                                                                                                                                                                                                                  yearly thresholds of adult ED use depending on the
                                                                                                                                                                                                                                                                                                  study objective.
                                                                                                                                                                                                                                                                                                     Our results indicate that in our study community, a
                                                                                                   85.2 (82.9–87.5)
                                                                                                    7.1 (5.4–8.8)
                                                                                                    0.9 (0.3–1.5)

                                                                                                                      1.5 (0.7–2.3)

                                                                                                                                                                                                                                                                                                  small number of adult frequent and extreme frequent
                                                                          31–50

                                                                                                                                                                                                                                                                                                  users account for a disproportionally large number of
                                                                                                                                                                                                                                                                                                  visits; these visits were significantly longer for frequent
                                                                                                                                                                                                                                                                                                  users and extreme frequent users than nonfrequent
                                                                                                                                        CTAS 5 Canadian Triage and Acuity Scale; ED 5 emergency department; LOS 5 length of stay.

                                                                                                                                                                                                                                                                                                  users overall and across all age categories except for the
                                                                                                                                                                                                                                                                                                  oldest group. The admission rate for adult frequent
                                                                                                                                                                                                                                                                                                  users was also higher.
                                                                                                                                                                                                                                                                                                     Our results demonstrate heterogeneity but support
                                                                                                                                                                                                                                                                                                  the hypothesis that there are patterns of adult frequent
                                                                                                   85.4 (82.7–88.1)
                                                                                                    4.8 (3.2–6.4)
                                                                                                    0.7 (0.5–1.0)

                                                                                                                      0.4 (0.3–0.9)

                                                                                                                                                                                                                                                                                                  and extreme frequent ED use. Psychiatric complaints
                                                                          18–30

                                                                                                                                                                                                                                                                                                  and alcohol-related presentations were overrepre-
                                                                                                                                                                                                                                                                                                  sented for adult frequent and extreme frequent users.
                                                                                                                                                                                                                                                                                                  Common diagnoses for adult extreme frequent users
                                                                                                                                                                                                                                                                                                  were nausea and vomiting in patients 18 to 50 years of
                                                                                                                                                                                                                                                                                                  age and chronic obstructive pulmonary disease in
                                                                                             Left against medical advice

                                                                                                                                                                                                                                                                                                  patients 66 to 80 years of age. These trends suggest
                                                                                             Home or private dwelling

                                                                                             Residence with support

                                                                                                                                                                                                                                                                                                  that somatic complaints and chronic conditions may
                                                                                             Admitted as inpatient
                                                                                           Post-ED disposition, %

                                                                                                                                                                                                                                                                                                  underlie the multiple return visits of some adult
                                      Table 3. Continued

                                                                                                                                                                                                                                                                                                  extreme frequent users, a hypothesis supported by
                                                                                                                                                                                                                                                                                                  other published work.1,4,5,7–10
                                                                          Characteristic

                                                                                             services

                                                                                                                                                                                                                                                                                                     To our knowledge, no consistent definition for adult
                                                                                           (95% CI)

                                                                                                                                                                                                                                                                                                  frequent ED use has been published to date. It is
                                                                                                                                                                                                                                                                                                  noteworthy that the frequent use thresholds we devel-
                                                                                                                                                                                                                                                                                                  oped led to absolute cutoffs similar to those chosen by

                      222      2013;15(4)                                                                                                                                                                                                                                                  CJEM N JCMU

Downloaded from https://www.cambridge.org/core. IP address: 46.4.80.155, on 16 Oct 2021 at 23:24:37, subject to the Cambridge Core terms of use, available at https://www.cambridge.org/core/terms.
https://doi.org/10.2310/8000.2013.130936
Table 4. Demographic and visit characteristics of extreme subset of adult frequent users by age category

                                                                                                                                                                                                                                                                                                                                 Age category

https://doi.org/10.2310/8000.2013.130936
                                                                                                                                                                                                                    Characteristic                                          18–30                         31–50                        51–65                   66–80                         81–102

                                                                                                                                                                                                                    Patient
                                                                                                                                                                                                                      Patients, n (% of all extreme frequent           23 (20.7)                      36 (32.4)                  30 (27.0)                  13 (11.7)                      9 (8.1)
                                                                                                                                                                                                                      users)
                                                                                                                                                                                                                      Yearly visits per patient, mean (95% CI)       11.3 (9.4–13.2)                11.8 (9.9–13.7)            10.0 (9.1–10.9)             9.2 (8.0–10.4)               11.1 (8.4–13.8)
                                                                                                                                                                                                                      Male sex, % (95% CI)                           52.2 (46.0–58.4)               41.7 (37.0–46.4)           56.7 (51.1–62.3)           23.1 (15.9–30.3)              66.7 (57.5–75.9)
                                                                                                                                                                                                                    Visit
                                                                                                                                                                                                                      Visits, n (% all extreme frequent user          248 (20.6)                     417 (34.7)                305 (25.4)                 133 (11.1)                    100 (8.3)
                                                                                                                                                                                                                      visits)
                                                                                                                                                                                                                      Visit triage level, % (95% CI)
                                                                                                                                                                                                                      CTAS 1                                          0.4 (0.01–2.2)                  1.2 (0.4–2.8)             1.3 (0.4–3.3)               0.8 (0.0–4.1)                   0 (0.0–0.0)
                                                                                                                                                                                                                      CTAS 2                                          5.2 (2.4–8.0)                 10.1 (7.2–13.0)           15.4 (11.3–19.5)            15.0 (8.9–21.1)                17.0 (9.6–24.4)
                                                                                                                                                                                                                      CTAS 3                                        47.2 (41.0–53.4)                51.3 (46.5–56.1)          48.2 (42.6–53.8)            58.6 (50.2–67.0)               37.0 (27.5–46.5)
                                                                                                                                                                                                                      CTAS 4                                        40.3 (34.2–46.4)                31.9 (27.4–36.4)          31.8 (26.6–37.0)            18.8 (12.2–25.4)               41.0 (31.4–50.6)
                                                                                                                                                                                                                      CTAS 5                                          6.9 (3.7–10.1)                  5.5 (3.3–7.7)             3.3 (1.3–5.3)               6.8 (2.5–11.1)                5.0 (1.6–11.3)
                                                                                                                                                                                                                      ED LOS in minutes, mean (95% CI)             368.6 (289.4–447.8)*            401.3 (359.2–443.4)*      477.6 (397.3–557.8)*       825.1 (598.8–1,051.4)*         547.4 (394.9–699.8)
                                                                                                                                                                                                                      Top five primary diagnoses, n (% total     Vomiting alone, 14 (5.6)        Nausea with vomiting,      Retention of urine,      Chronic obstructive            Urinary tract infection,
                                                                                                                                                                                                                      visits for age category)                                                   23 (5.5)                   11 (3.6)                 pulmonary disease              site not specified,
                                                                                                                                                                                                                                                                                                                                                     with acute exacerbation,       9 (9.0)
                                                                                                                                                                                                                                                                                                                                                     unspecified, 15 (11.3)

                                                                                                                                                                                                      CJEM N JCMU
                                                                                                                                                                                                                                                                 Anxiety disorder,               Vomiting alone, 17 (4.1)   Atrial fibrillation,     Atrial fibrillation, 6 (4.5)   Blood transfusion
                                                                                                                                                                                                                                                                 unspecified, 13 (5.2)                                      10 (3.3)                                                (without reported
                                                                                                                                                                                                                                                                                                                                                                                    diagnosis), 7 (7.0)
                                                                                                                                                                                                                                                                 Nausea with                     Mental and behavioural     Chest pain,              Epistaxis, 6 (4.5)             Chest pain, unspecified,
                                                                                                                                                                                                                                                                 vomiting, 10 (4.0)              disorders due to use       unspecified, 10 (3.3)                                   6 (6.0)
                                                                                                                                                                                                                                                                                                 of alcohol, acute
                                                                                                                                                                                                                                                                                                 intoxication, 13 (3.1)
                                                                                                                                                                                                                                                                 Right upper quadrant            Anxiety disorder,          Unspecified renal        Chronic obstructive            Angina pectoris,
                                                                                                                                                                                                                                                                 pain, 7 (2.8)                   unspecified, 11 (2.6)      colic, 10 (3.3)          pulmonary disease              unspecified, 4 (4.0)
                                                                                                                                                                                                                                                                                                                                                     with acute lower
                                                                                                                                                                                                                                                                                                                                                     respiratory infection,
                                                                                                                                                                                                                                                                                                                                                     4 (3.0)
                                                                                                                                                                                                                                                                 Tubulointerstitial nephritis,   Chest pain, unspecified,   Low back pain, 7 (2.3)   Dyspnea, 4 (3.0)               Mechanical complication
                                                                                                                                                                                                                                                                 not specified as acute          10 (2.4)                                                                           of urinary (indwelling)
                                                                                                                                                                                                                                                                 or chronic, 6 (2.4)             Headache, 10 (2.4)                                  Mental and behavioural         catheter, 4 (4.0)
                                                                                                                                                                                                                                                                                                                                                     disorders due to use of
                                                                                                                                                                                                                                                                                                                                                     alcohol, acute
                                                                                                                                                                                                                                                                                                                                                     intoxication, 4 (3.0)
                                                                                                                                                                                                                                                                                                 Other and unspecified
                                                                                                                                                                                                                                                                                                 abdominal pain, 10 (2.4)

                                                                                                                                                                                                      2013;15(4)

Downloaded from https://www.cambridge.org/core. IP address: 46.4.80.155, on 16 Oct 2021 at 23:24:37, subject to the Cambridge Core terms of use, available at https://www.cambridge.org/core/terms.
                                                                                                                                                                                                                                                                                                                                                                                                               Defining, quantifying, and characterizing adult frequent users of a suburban ED

                                                                                                                                                                                                      223
Moe et al

                                                                                                                                                                                                                                                                                                       other investigators, although most previously published
                                                                                                                                                                                                                                                                                                       articles do not specify a methodology for determining

                                                                                                      (50.4–70.0)

                                                                                                      (19.2–36.8)
                                                                                                      (2.7–13.3)

                                                                                                      (1.1–9.9)3
                                                                                                                                                                                                                                                                                                       frequency of use2,3,7,9,11,12,17,20; this may reflect underlying

                                                                              81–102
                                                                                                                                                                                                                                                                                                       similarities in study populations and/or communities or
                                                                                                                                                                                                                                                                                                       similarities between researchers’ judgment regard-

                                                                                                      60.0

                                                                                                      28.0
                                                                                                       8.0

                                                                                                       4.0
                                                                                                                                                                                                                                                                                                       ing the extremes of their distribution of use and
                                                                                                                                                                                                                                                                                                       our percentile method or may be coincidental. Our
                                                                                                                                                                                                                                                                                                       distribution-based definition is novel and generalizable
                                                                                                                                                                                                                                                                                                       in that it would allow centres to characterize their
                                                                                                      (63.0–78.4)

                                                                                                                                                                                                                                                                                                       unique populations of adult frequent users. Our findings
                                                                                                      (3.6–13.0)
                                                                                                      (7.1–18.5)
                                                                                                      (0.8–7.5)
                                                                              66–80

                                                                                                                                                                                                                                                                                                       support existing evidence that adult frequent ED users
                                                                                                                                                                                                                                                                                                       represent a disproportionate number of overall ED
                                                                                                      70.7

                                                                                                      12.8
                                                                                                       3.1
                                                                                                       8.3

                                                                                                                                                                                                                                                                                                       visits,1 are heterogeneous,1 have longer visits and more
                                                                                                                                                                                                                                                                                                       admissions in certain subgroups,12 and often have
                                                                                                                                                                                                                                                                                                       chronic illness10 and psychiatric comorbidity.1,3–5 We
                                                                                                                                                                                                                                                                                                       did not, however, find the previously described bimodal
                                                                                                                                                                                                                                                                                                       age distribution.1
                                                                                                      (79.8–88.0)
                                                               Age category

                                                                                                      (4.5–10.5)
                                                                                                      (1.3–5.3)
                                                                                                      (0.6–4.0)

                                                                                                                                                                                                                                                                                                          Our findings contribute to the evidence on adult
                                                                              51–65

                                                                                                                                    Statistically significant compared to nonfrequent user group in same age category using a chi-square exact test of proportions at an alpha level of 0.05.

                                                                                                                                                                                                                                                                                                       frequent ED use in Canada and have important
                                                                                                                                   *Statistically significant compared to nonfrequent user group in same age category using a Mann-Whitney test of means at an alpha level of 0.05.

                                                                                                                                                                                                                                                                                                       implications. For example, the prevalence of mental
                                                                                                      83.9
                                                                                                       7.5
                                                                                                       3.3
                                                                                                       2.3

                                                                                                                                                                                                                                                                                                       disorders points to the need for better community-
                                                                                                                                                                                                                                                                                                       based mental health care access and follow-up. Case
                                                                                                                                                                                                                                                                                                       management for frequent ED users has been tried,
                                                                                                                                                                                                                                                                                                       with mixed success.16–20 Approaches employing multi-
                                                                                                      (82.0–88.8)
                                                                                                      (4.7–9.7)
                                                                                                      (0.3–2.4)
                                                                                                      (0.4–2.8)

                                                                                                                                                                                                                                                                                                       disciplinary, individualized patient care plans with
                                                                              31–50

                                                                                                                                                                                                                                                                                                       medical and social supports21 and targeted dynamic
                                                                                                                                                                                                                                                                                                       psychotherapy for somatization disorders28 have
                                                                                                       7.2
                                                                                                       1.0
                                                                                                       1.2
                                                                                                      85.4

                                                                                                                                                                                                                                                                                                       achieved significant reductions in Canadian ED use
                                                                                                                                                                                                                                                                                                       among frequent users. However, a clear definition of
                                                                                                                                   CTAS 5 Canadian Triage and Acuit Scale; ED 5 emergency department; LOS 5 length of stay.

                                                                                                                                                                                                                                                                                                       frequent use is a prerequisite for intervention.13
                                                                                                                                                                                                                                                                                                          Future studies may expand the characterization of
                                                                                                      (75.7–85.5)
                                                                                                      (10.1–18.9)

                                                                                                                                                                                                                                                                                                       adult frequent and extreme frequent users by linking
                                                                                                      (0.7–4.6)
                                                                                                      (0.3–3.5)
                                                                              18–30

                                                                                                                                                                                                                                                                                                       with additional databases to include potential predic-
                                                                                                                                                                                                                                                                                                       tors of adult frequent ED use such as socioeconomic
                                                                                                      80.6
                                                                                                      14.5
                                                                                                       2.0
                                                                                                       1.2

                                                                                                                                                                                                                                                                                                       status,29 comorbidities, health care services use,30 and
                                                                                                                                                                                                                                                                                                       family physician attachment or access. Additionally,
                                                                                                                                                                                                                                                                                                       our percentile-based methodology could be used by
                                                                                                                                                                                                                                                                                                       multiple EDs to determine an overall distribution of
                                                                                                                                                                                                                                                                                                       frequency of use, the mean or median of which could
                                                                                                 Residence with support services
                                                                                               Post-ED disposition, % (95% CI)

                                                                                                                                                                                                                                                                                                       be used to establish regional, provincial, or national
                                                                                                 Left against medical advice

                                                                                                                                                                                                                                                                                                       thresholds for adult frequent ED use that could serve
                                                                                                 Home or private dwelling

                                                                                                                                                                                                                                                                                                       as universal benchmarks.
                                                                                                 Admitted as inpatient

                                                                                                                                                                                                                                                                                                          Our findings are robust because we examined a large
                                          Table 4. Continued

                                                                                                                                                                                                                                                                                                       number of visit data. However, our study has several
                                                                                                                                                                                                                                                                                                       limitations that should be considered. First, we
                                                                              Characteristic

                                                                                                                                                                                                                                                                                                       examined visit data at our study site without access to
                                                                                                                                                                                                                                                                                                       ED data from surrounding hospitals. Movement of
                                                                                                                                                                                                                                                                                                       patients between different sites is possible and may
                                                                                                                                                                                                                                                                                                       have affected our results. ED use by some adult
                                                                                                                                   3

                      224      2013;15(4)                                                                                                                                                                                                                                                       CJEM N JCMU

Downloaded from https://www.cambridge.org/core. IP address: 46.4.80.155, on 16 Oct 2021 at 23:24:37, subject to the Cambridge Core terms of use, available at https://www.cambridge.org/core/terms.
https://doi.org/10.2310/8000.2013.130936
Defining, quantifying, and characterizing adult frequent users of a suburban ED

                      frequent users may have been underestimated if care                                         5. Kne T, Young R, Spillane L. Frequent ED users: patterns of
                                                                                                                     use over time. Am J Emerg Med 1998;16:648-52, doi:10.
                      was sought outside of our centre. Second, the ED                                               1016/S0735-6757(98)90166-8.
                      database at our study site captured outpatient visits,                                      6. McCusker J, Karp I, Cardin S. Determinants of emergency
                      which has the potential to distort our findings. We                                            visits by older adults: a systematic review. Acad Emerg Med
                      attempted to exclude such visits by consulting with site                                       2003;10:1362-70, doi:10.1111/j.1553-2712.2003.tb00011.x.
                      emergency physicians to identify the ICD-10-CA codes                                        7. Milbrett P, Halm M. Characteristics and predictors of
                      used for scheduled returns; however, our algorithm has                                         frequent utilization of emergency services. J Emerg Nurs
                                                                                                                     2009;35:191-8, doi:10.1016/j.jen.2008.04.032.
                      not yet been validated and requires further study. Third,
                                                                                                                  8. Sandoval E, Smith S, Walter J, et al. A comparison of
                      our results depend to some extent on database compre-                                          frequent and infrequent visitors to an urban emergency
                      hensiveness.31 Our ED database did not include family                                          department. J Emerg Med 2010;38:115-21, doi:10.1016/
                      physician attachment and patient comorbidities; stan-                                          j.jemermed.2007.09.042.
                      dard prospective collection of this information from ED                                     9. Sun BC, Burstin HR, Brennan TA. Predictors and outcomes
                      users would enhance future studies. A final limitation                                         of frequent emergency department users. Acad Emerg Med
                                                                                                                     2003;10:320-8, doi:10.1111/j.1553-2712.2003.tb01344.x.
                      involves the validity of our database. Although we did
                                                                                                                 10. Zuckerman S, Shen YC. Characteristics of occasional and
                      not independently validate the data used in this study, as                                     frequent emergency department users: do insurance cover-
                      previously described, the WestView ED data are subject                                         age and access to care matter? Med Care 2004;42:176-82,
                      to internal and external verification by AHS and the                                           doi:10.1097/01.mlr.0000108747.51198.41.
                      CIHI as part of the NACRS.                                                                 11. Riggs JE, Davis SM, Hobbs GR, et al. Association between
                                                                                                                     early returns and frequent ED visits at a rural academic
                                                                                                                     medical centre. Am J Emerg Med 2003;21:30-1, doi:10.1053/
                      CONCLUSIONS                                                                                    ajem.2003.50017.
                                                                                                                 12. Ruger JP, Richter CJ, Spitznagel EL, et al. Analysis of costs,
                      We have proposed reproducible definitions for adult                                            length of stay, and utilization of emergency department
                      frequent and extreme frequent ED users and provide                                             services by frequent users: implications for health policy.
                      information on the characteristics and burden of care                                          Acad Emerg Med 2004;11:1311-7, doi:10.1111/j.1553-2712.
                                                                                                                     2004.tb01919.x.
                      of these groups at a community Canadian suburban
                                                                                                                 13. Althaus F, Paroz S, Hugli O, et al. Effectiveness of
                      ED. Adoption of these definitions would allow                                                  interventions targeting frequent users of emergency depart-
                      comparison across centres in future research and                                               ments: a systematic review. Ann Emerg Med 2011;58:41-52,
                      facilitate targeted interventions for frequent and                                             doi:10.1016/j.annemergmed.2011.03.007.
                      extreme frequent ED users.                                                                 14. McCusker J, Cardin S, Bellavance F, et al. Return to the
                                                                                                                     emergency department among elders: patterns and predic-
                      Competing interests: None declared. The authors acknowl-                                       tors. Acad Emerg Med 2000;7:249-59, doi:10.1111/j.1553-
                      edge in-kind support provided by the WestView Physician                                        2712.2000.tb01070.x.
                      Collaborative and WestView Primary Care Network (www.                                      15. McCusker J, Ionescu-Ittu R, Ciampi A, et al. Hospital
                      westviewpcn.ca).                                                                               characteristics and emergency department care of older
                                                                                                                     patients are associated with return visits. Acad Emerg Med
                                                                                                                     2007;14:426-33.
                      REFERENCES
                                                                                                                 16. Grover CA, Close RJH, Villarreal K, et al. Emergency
                                                                                                                     department frequent user: pilot study intensive case manage-
                        1. LaCalle E, Rabin E. Frequent users of emergency depart-                                   ment to reduce visits and computed tomography. West J
                           ments: the myths, the data and the policy implications. Ann                               Emerg Med 2010;11:336-43.
                           Emerg Med 2010;56:42-8, doi:10.1016/j.annemergmed.2010.
                           01.032.                                                                               17. Hansagi H, Olsson M, Hussain A, et al. Is information sharing
                                                                                                                     between the emergency department and primary care useful to
                        2. Peppe EM, Mays JW, Chang HC, et al. Characteristics of                                    the care of frequent emergency department users? Eur J Emerg
                           frequent emergency department users. The Henry J. Kaiser                                  Med 2008;15:34-9, doi:10.1097/MEJ.0b013e3282aa4115.
                           Family Foundation. 2007. Available from: http://www.kff.
                           org/insurance/7696.cfm (accessed May 3, 2012).                                        18. Lee KH, Davenport L. Can case management interventions
                                                                                                                     reduce the number of emergency department visits by
                        3. Curran GM, Sullivan G, Williams K, et al. The association
                                                                                                                     frequent users? Health Care Manager 2006;25:155-9.
                           of psychiatric comorbidity and use of the emergency
                           department among persons with substance use disorders:                                19. Michelen W, Martinez J, Lee A, et al. Reducing frequent
                           an observational cohort study. BMC Emerg Med 2008;8:17,                                   flyer emergency department visits. J Health Care Poor
                           doi:10.1186/1471-227X-8-17.                                                               Underserved 2006;17:59-69.
                        4. Kerr T, Wood E, Grafstein E, et al. High rates of primary                             20. Phillips GA, Brophy DS, Weiland TJ, et al. The effect of
                           care and emergency department use among injection drug                                    multidisciplinary case management on selected outcomes for
                           use in Vancouver. J Public Health (Oxf) 2005;27:62-6,                                     frequent attenders at an emergency department. Med J Aust
                           doi:10.1093/pubmed/fdh189.                                                                2006;184:602-6.

                                                                                                   CJEM N JCMU                                                                2013;15(4)       225

Downloaded from https://www.cambridge.org/core. IP address: 46.4.80.155, on 16 Oct 2021 at 23:24:37, subject to the Cambridge Core terms of use, available at https://www.cambridge.org/core/terms.
https://doi.org/10.2310/8000.2013.130936
Moe et al

                      21. Pope D, Fernandes CMB, Bouthillette F, et al. Frequent                                 27. Alberta Health and Wellness. Alberta Health and Wellness
                          users of the emergency department: a program to improve                                    Ambulatory Care Re-abstraction Study executive report. 2006.
                          care and reduce visits. CMAJ 2000;162:1017-20.                                             Available from: http://www.health.alberta.ca/newsroom/pub-
                      22. McCusker J, Healey E, Bellavance F, et al. Predictors of                                   ambulatory-care.html (accessed May 3, 2012).
                          repeat emergency department visits by elders. Acad Emerg                               28. Abbass A, Campbell S, Magee K, et al. Intensive short-term
                          Med 1997;4:581-8, doi:10.1111/j.1553-2712.1997.tb03582.x.                                  dynamic psychotherapy to reduce rates of emergency
                                                                                                                     department return visits for patients with medically unex-
                      23. WestView Primary Care Network. WestView Primary Care                                       plained symptoms: preliminary evidence from a pre-post
                          Network Business Plan, 2008-2014 [internal document]. Spruce                               intervention study. CJEM 2009;11:529-34.
                          Grove, AB: WestView Primary Care Network ; 2008.
                                                                                                                 29. Khan Y, Glazier RH, Moineddin R, et al. A population-
                      24. Canadian Institute for Health Information. International                                   based study of the association between socioeconomic status
                          statistical classification of diseases and related health problems:                        and emergency department utilization in Ontario, Canada.
                          tenth revision, volume one – tabular list. Ottawa: CIHI; 2009.                             Acad Emerg Med 2011;18:836-43, doi:10.1111/j.1553-2712.
                      25. Canadian Institute of Health Information. Data quality                                     2011.01127.x.
                          documentation for external users: National Ambulatory Care                             30. Kroner EL, Hoffmann RG, Brousseau DC. Emergency
                          Reporting System, 2010-2011. Ottawa: CIHI; 2011.                                           department reliance: a discriminatory measure of frequent
                      26. Gibson D, Richards H, Chapman A. The National                                              emergency department users. Pediatrics 2010;125:133-8, doi:
                          Ambulatory Care Reporting System: factors that affect the                                  10.1542/peds.2009-0960.
                          quality of its emergency data. Int J Inform Qual 2008;2:97-                            31. Iezzoni L. Assessing quality using administrative data. Ann
                          114, doi:10.1504/IJIQ.2008.022958.                                                         Intern Med 1997;127:666-74.

                      226      2013;15(4)                                                          CJEM N JCMU

Downloaded from https://www.cambridge.org/core. IP address: 46.4.80.155, on 16 Oct 2021 at 23:24:37, subject to the Cambridge Core terms of use, available at https://www.cambridge.org/core/terms.
https://doi.org/10.2310/8000.2013.130936
You can also read