R 457 - Natural catastrophes and bank lending: the case of flood risk in Italy by Ivan Faiella and Filippo Natoli - Banca d'Italia
←
→
Page content transcription
If your browser does not render page correctly, please read the page content below
Questioni di Economia e Finanza
               (Occasional Papers)

               Natural catastrophes and bank lending:
               the case of flood risk in Italy

               by Ivan Faiella and Filippo Natoli
October 2018

                                                                 457
                                                        Number
Questioni di Economia e Finanza (Occasional Papers) Natural catastrophes and bank lending: the case of flood risk in Italy by Ivan Faiella and Filippo Natoli Number 457 – October 2018
The series Occasional Papers presents studies and documents on issues pertaining to
the institutional tasks of the Bank of Italy and the Eurosystem. The Occasional Papers appear
alongside the Working Papers series which are specifically aimed at providing original contributions
to economic research.

                 The Occasional Papers include studies conducted within the Bank of Italy, sometimes
in cooperation with the Eurosystem or other institutions. The views expressed in the studies are those of
the authors and do not involve the responsibility of the institutions to which they belong.

                 The series is available online at www.bancaditalia.it .

ISSN 1972-6627 (print)
ISSN 1972-6643 (online)

Printed by the Printing and Publishing Division of the Bank of Italy
NATURAL CATASTROPHES AND BANK LENDING:
THE CASE OF FLOOD RISK IN ITALY
by Ivan Faiella* and Filippo Natoli*
Abstract
We investigate the relationship between bank lending and catastrophe risk by
analyzing the exposure of banks to Italian firms located in areas at risk of flooding. By
matching a new map of flood risk areas with proprietary data on bank loans at municipal level
we find that, on controlling for sectoral- and province-level fixed effects, lending to non-
financial firms is negatively correlated with their flood risk exposure. A province-level
analysis, which also allows us to control for bank- and firm-specific factors, confirms this
finding when the borrowers are small and medium-sized enterprises. This investigation gives
an initial insight into the relationship between the risk of natural catastrophes - exacerbated by
climate change - and lending decisions.
JEL Classification: G21, P48, Q54.
Keywords: catastrophe risk, climate change, rare disasters, bank lending, flooding, Italy.
Contents
1. Introduction ........................................................................................................................... 5
2. Literature review ................................................................................................................... 6
3. Hydrogeological risk in Italy ................................................................................................. 8
3.1 Historical perspective......................................................................................................... 8
3.2 Local Business Units at risk of floods ............................................................................... 8
4. Empirical analysis ............................................................................................................... 12
4.1 Catastrophe risk indicator ................................................................................................ 12
4.2 Bank loans to risky firms ................................................................................................. 13
4.3 A multivariate descriptive analysis .................................................................................. 15
4.4 Results .............................................................................................................................. 16
4.5 Robustness analysis at province-level ............................................................................. 18
4.6 Insurance coverage........................................................................................................... 21
5. Conclusions .......................................................................................................................... 23
References ................................................................................................................................ 24
_______________________________________
* Bank of Italy, Directorate General for Economics, Statistics and Research.1 Introduction*
Climate change is causing a structural transformation of the natural environment. One
important effect of this ongoing process is the increasing frequency and intensity of ad-
verse natural events, which poses material risks for the economy. Natural catastrophes
are local phenomena but their consequences spread out over the economic system, just
like other extreme, rare events. One relevant propagation mechanism is the credit chan-
nel: physical damages and business disruptions caused by natural events may affect the
ability of borrowers to repay back loans, eventually forcing banks to fire sale assets and
ration credit. The ability of banks to price and hedge this risk ex-ante is key to avoid
unintended consequences on credit and asset prices.
We investigate the connection between catastrophe risk and bank lending by analyz-
ing lending activity to Italian firms located in areas at risk of flood. Flood risk is one
of the most relevant sources of catastrophe risk in Italy and, at the same time, is highly
heterogeneously distributed over the Italian territory. We adopt the mapping of
flood risk realized in 2015 by the Italian Institute for Environmental Protection and
Research (ISPRA) and construct an indicator at the municipal level as the share of firms
located in high-risk flood areas within each municipality. The analysis is conducted in
two steps: first, we match data on flood risk with proprietary data on bank loans – from
the Italian Central Credit Register – by geographic location of credit; then, using
municipal-level ag-gregations, we correlate the level of flood risk with the amount of
credit granted to firms by the banking sector. Provided that firms may operate in
different areas (possibly more risky) than those in which they are legally resident, we
impute loans to the municipality of the lending bank branch, supposedly closer to the
final use destination of credit.
Controlling for sectoral- and province-level fixed effects, we find that catastrophe risk
have a negative effect on bank lending. As a robustness check, we repeat our regres-
sion using province-level data from a different proprietary dataset – compiled from the
surveillance reports of banks to the Bank of Italy – which allows to distinguish between
credit granted by big and small banks and received by big and small firms: results are
confirmed in the case of loans granted to small and medium-sized enterprises. While
there is no identification of demand and supply drivers of credit, our results may suggest
that banks can discriminate borrowers by their catastrophe risk exposure but ration credit
only to small companies, that are less able to diversify risk.
*We are indebted to Andrea Orame for providing us high quality municipal level data. We thank the ISPRA
research team for useful clarifications on ISPRA data. We also thank Luigi Cannari and the participants in the 3rd
Banking Research Network workshop of the Bank of Italy and the 30th Villa Mondragone International Economic
Seminar for the useful comments and suggestions. The views expressed in this paper are those of the authors and do
not necessarily reflect those of the Bank of Italy. All the remaining errors are ours. E-mail: ivan.faiella@bancaditalia.it,
filippo.natoli@bancaditalia.it.
5The relevance of these results seems not to depend on the lack of information on flood insurance
penetration in the industry sector: indeed, survey data on catastrophe insurance collected for the
first time in 2017 by the Bank of Italy show that insurance penetration is not even high for large
firms,suggesting that the industry (and, by consequence, the banking sector) remains
largely exposed to natural disasters.
Overall, our results suggest that credit availability may not be independent on one of the
main sources of catastrophe risk, opening to new research on the topic. While the es-
timation is in reduced form and it is mainly used as a descriptive tool, results come from the
analysis of the entire population of bank-firm relationships, not from those existing in limited
areas, as in most papers on the topic; moreover, for the fact of being independent on the
occurrence of catastrophic events, cross-section estimates can be replicated over time to
track the lending behaviour in risky areas. Our method, that is based on publicly available
information on the degree of flood risk by geographic areas, allows to give a first insight on
the ex-ante perception of risk, without making inference from the ex-post be-havior of
agents. As far as we know, this is the first study which proposes a classification of the entire
stock of credit in one economy by climate-related riskiness of the borrower. Concerning
Italy, this is the first economic study using a new, detailed territorial flood mapping, and
one of the first dealing with catastrophe risk from the perspective of Italian banks.
2 Literature review
Many papers investigate the effects of natural catastrophes. Some of them focus on local
socio-economic effects, as the direct economic and demographic damage (Cavallo et al.,
2010) and the variation in growth rates in affected cities (Strobl, 2011), as well as on the
risks and opportunities linked to the reconstruction (Vigdor, 2008); others look at macroe-
conomic implications in terms of short- and long-term growth (Cavallo et al., 2013; Mc-
Dermott et al., 2014), of cross-country capital flows (Odell and Weidenmier, 2004), and
of the different effects in advanced vs emerging economies (Noy, 2009). The reported
results, while rich in terms of economic analysis, mainly come from the evidence on hur-
ricanes and earthquakes, so they are not representative of the entire spectrum of hydro-
geological events. Moreover, they mostly focus on the United States, and in particular on
specific areas of that country that have historically suffered the most from those types of
natural catastrophes.
6From a theoretical point of view, unpredictable natural catastrophes can be analyzed
in the same frameworks which embed large macroeconomic shocks, or rare disasters.
Starting from the seminal work of Rietz (1988), the literature on rare disasters has empha-
sized the effects of a non-negligible probability of disasters on equilibrium asset prices
(Barro, 2006; Barro and Ursúa, 2012; Gabaix, 2012; Gourio, 2012; Wachter, 2013). While
theoretical models typically do not include the banking sector, the economic research is
showing growing interest on the link between natural disasters and bank lending. Morse
(2011) analyzes the role of payday lenders in mitigating financial distress caused by nat-
ural disasters; Cortés and Strahan (2017) investigate how banks alter their credit supply
decisions in response to shocks to local credit demand stimulated by natural disasters;
Garmaise and Moskowitz (2009) analyze the implications of earthquake risk on real es-
tate financing. A literature review on the consequences of natural disasters on banks is
reported in Klomp (2014).
Few papers before ours have specifically focused on floods. Looking at a number of
flood events in the UK and to housing market developments in affected areas, Lamond
et al. (2010) do not find broad-based evidence of a strong and persistent impact of floods
on house prices; opposite evidence is instead reported in Belanger and Bourdeau-Brien
(2017) who examine the effects of flood risk on property prices in the United Kingdom
and find a significant “flood risk discount” for both waterfront properties and real estates
that are located farther away within the same area. Koetter et al. (2016) exploit the 2013
Elbe flooding in Germany to assess how lending behaviour has changed after that event,
finding that local banks with sound relationship with flooded firms lent more than big
banks in the aftermath of the flood, mitigating the effects of the shocks on the industry
sector. Our paper gives some insights on the risk perception of banks. Lending choices
in risky provinces can be informative on banks’ awareness of catastrophe risk or on their
willingness to take it on. Provided that studies on property values and insurance markets
hint on the underestimation of catastrophe risks by households and insurance companies,
this might also be the case for the banking sector.1
The rest of the paper is organized as follows. Section 3 presents hydrogeological risk
and describes the dataset. Section 4 explains the estimation strategy, comments on the
results and discusses key issues. Section 5 concludes.
1 Other evidence relates to insurance and reinsurance companies. Concerning insurance companies, a
study by Lloyds (2014) note that most catastrophe models used by insurers and other agents still tend
to rely on historical data without incorporating climate change trends explicitly; moreover, according to
Standard and Poor’s (2014), reinsurers do not believe that climate change is having a material impact on
their current risk exposure.
73 Hydrogeological risk in Italy
In this Section we present evidence on hydrogeological risk in Italy. First, we characterize
the main sources of risk in this country; then, we comment on the current level of flood
risk borne by Italian firms, focusing on the geographic distribution of local business units
over the Italian territory.
3.1 Historical perspective
Italy is particularly exposed to hydrogeological risk because of its geomorphological char-
acteristics and the intense urbanization that followed the economic post-war boom. Table
1 reports aggregate statistics on floods and landslides between 1950 and 2011, divided in
two subperiods (1950 – 2008, upper panel, and 2009 – 2011, middle panel). Over the entire
sample, the relevance of the exposure to hydrogeological risk is witnessed by the average
number of events per year (65) and the total population involved over the history (more
than three million people); moreover, the economic damage is estimated to be at least 2.7
billion euro per year, according to Faiella (2013).
Floods have historically been less frequent than landslides; however, the number of
casualties associated to flood events is estimated to be higher than that of landslides, par-
ticularly for the last two years of the sample.2 Moreover, the frequency of floods is pro-
jected to increase significantly: climate simulations made with a hydrogeological model
shows that flood frequency in Italy could almost double by 2050 and triple by 2080 (Al-
fieri et al., 2015). All in all, the evidence suggests that floods can be considered as the main
source of hydrogeological risk for households and firms located over the Italian territory.
3.2 Local Business Units at risk of floods
In order to support national climate-related policies, Trigila et al. (2015) (the ISPRA re-
port, henceforth) have created a database of the population (households, firms and cul-
tural heritage sites) exposed to the risk of floods and landslides over the Italian territory.
The database has been constructed in two steps: first, for each of the two types of natural
events, land has been categorized in terms of riskiness using granular environmental data
and information about the historical occurrence of each event; second, both land datasets
have been matched with data on the geographic residence of households, firms and cul-
2 In line with data on casualties, also damages related to past flood events are estimated to be higher than
those related to landslides, according to Faiella (2013).
8N. of events Involved Pop N. of casualties Events/year Casualties/year Casualties/event
1950-2008
Landslides 2,204 177,376 4,103 37 70 1.86
Flooding 1,654 497,334 1,214 28 21 0.73
Total 3,858 674,71 5,317 65 90 1.38
2009-2011
Landslides 133 4,7 38 44 13 0.29
Flooding 31 2,335,500 104 10 35 3.35
Total 164 2,340,200 142 55 47 0.87
1950-2011
Landslides 2,337 182,076 4,141 38 67 1.77
Flooding 1,685 2,832,834 1,318 27 21 0.78
Total 4,022 3,014,910 5,459 65 88 1.36
Table 1: Hydrogeological events in Italy. total number of events, estimated population involved and total
number of casualties: 1950-2011. Source: Faiella (2013).
tural heritage sites taken from the 2011 ISTAT census (the last one available), obtaining
statistics of the population exposed to flood and landslide risk at different risk levels.3
Following the evidence reported in Section 3.1 and the unavailability of a joint flood-
landslide risk mapping, we restrict our analysis to flood risk. Land categorization for
flood risk is constructed using data collected from river basin authorities, municipalities,
provinces, regions and other public authorities.4 Land is categorized at low, medium,
high or no risk of flood based on the estimated frequency of flood events over time: ar-
eas in which floods are estimated to occur once in 20–50 years are flagged as high-risk
areas, while those in which floods are estimated to be less frequent (once in 100–200 years
and once in more than 200 years) are labelled as medium- and low-risk areas, respec-
tively. Areas at lower risk are farther from the river basins and damaged only in case
of large floods: indeed, in the classification made in the ISPRA report, low-risk areas in-
clude medium-risk ones, and medium-risk areas include high-risk ones. Figure 3.1 shows
3 For further details, on the ISTAT census, search 9th Censimento generale dell’industria e dei servizi e Cen-
simento delle istituzioni non profit at www.istat.it. ISTAT census of firms are conducted once every ten
years.
4 River basin authorities are public entities in charge of supervising the conservation and sustainable
use of river resources, pursuing hydrogeological risk mitigation policies and contributing to structural and
non-structural measures programming.
9LBUs at risk by risk level share by risk level (%) Value Added
# LBUs high medium low high medium low (% of tot VA)
Abruzzo 109,925 2,135 13,435 3,569 1.9 12.2 3.2 1.9
Basilicata 38,043 219 333 352 0.6 0.9 0.9 0.6
Calabria 117,904 3,924 4,900 6,749 3.3 4.2 5.7 1.9
Campania 362,502 6,010 15,098 17,788 1.7 4.2 4.9 6.2
Emilia Romagna 403,272 40,665 254,337 160,280 10.1 63.1 39.7 9.0
Friuli 95,940 2,573 7,505 9,817 2.7 7.8 10.2 2.2
Lazio 456,377 7,060 13,134 54,156 1.5 2.9 11.9 11.4
Liguria 140,737 25,114 37,376 47,570 17.8 26.6 33.8 2.9
Lombardia 888,054 18,867 28,578 97,879 2.1 3.2 11.0 22.1
Marche 142,657 836 7,101 3,629 0.6 5.0 2.5 2.5
Molise 23,254 126 444 541 0.5 1.9 2.3 0.4
Piemonte 369,062 7,835 18,843 58,112 2.1 5.1 15.7 7.6
Puglia 269,834 4,927 7,926 10,186 1.8 2.9 3.8 4.3
Sardegna 117,588 4,931 7,817 19,431 4.2 6.6 16.5 1.9
Sicilia 291,506 1,014 1,609 1,874 0.3 0.6 0.6 5.3
Toscana 358,984 23,281 105,605 257,770 6.5 29.4 71.8 6.8
Trentino 91,614 1,600 2,224 5,136 1.7 2.4 5.6 2.3
Umbria 75,262 2,682 5,750 9,187 3.6 7.6 12.2 1.3
Valle D’Aosta 12,876 573 1,245 5,209 4.5 9.7 40.5 0.3
Veneto 440,623 31,894 43,275 110,129 7.2 9.8 25.0 9.2
total 4,806,014 186,266 576,535 879,364 3.9 12.0 18.3 100
Table 2: Statistics on flood risk by Italian region. Column 1: total number of LBUs from the 2011 Census;
columns 2 to 7: number of LBUs at risk and percentages by risk level (from the ISPRA report); column 8:
regional share of national value added, computed from ISTAT data. Data on LBUs at risk for Marche are an
underestimate of the number of firms at risk in that region.
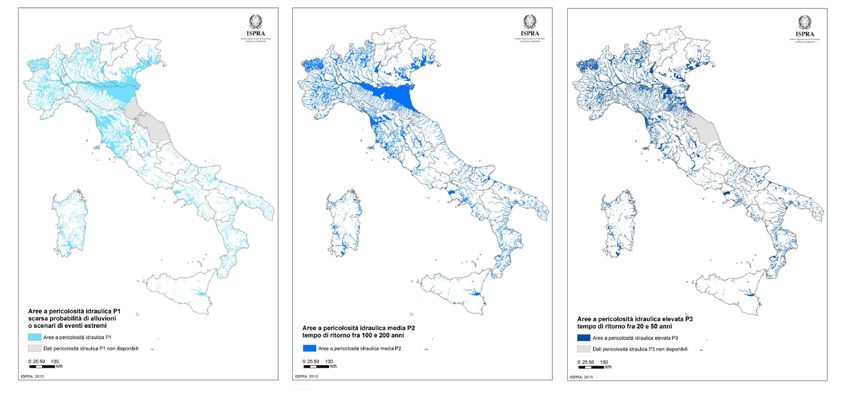
the geographical distribution over the Italian territory of areas at low-risk (left picture),
medium-risk (center picture) and high-risk (right picture), with grey lines indicating re-
gions’ borders. According to the maps, in 2014 10.6 percent of the Italian territory was
exposed to flood risk, of which 4.0 percent to high-risk.
In this paper we focus on Italian firms, leaving households and cultural heritage sites
for further analyses. Concerning firms, the ISTAT census reports detail of the Local Busi-
ness Units (LBUs henceforth), defined as “economic units that perform arts and profes-
sions in industry, trade and services in favor of enterprises and households”. In general,
firm’s activity can be organized in more than one LBU: in the census, ISTAT assigns the
exact geographic location to each of them, irrespective of the legal residence of the com-
pany. This aspect is key in our investigation, because it allows for a correct quantification
of the physical risk concentrated in each province. We extract province-level data from
Table 5.24 of the ISPRA report and compute summary statistics. Table 2 shows the geo-
graphic distribution of LBUs at risk of flood by the 20 Italian regions: 18.3 percent of the
total LBUs are exposed to flood risk, of which 3.9 per cent at high-risk. Looking at the
regional breakdown, Emilia-Romagna, Veneto, Liguria, Tuscany and Sardinia have the
highest concentration of LBUs at high-risk: these regions together produce almost a third
1011
Figure 3.1: Categorization of the Italian territory in terms on flood risk- Left picture: low-risk areas (light blue color); center
picture: medium-risk areas (blue color); right picture: high-risk areas (dark blue color). Grey lines indicate regions’ borders.
Source: Trigila et al. (2015)of the national value added.5
In order to investigate the exposure of the banking sector to flood risk, we will only
consider the fraction of LBUs at high-risk (i.e., those located in dark blue areas of Fig-
ure 3.1). The reason of this choice is that the investment horizon of banks is limited: in
medium- and low-risk areas flood damages can be so infrequent that banks are unlikely
to care of, while floods occurring once in 20 to 50 years (i.e., in high-risk areas) are suffi-
ciently frequent to be considered by banks when financing firms’ activities.
4 Empirical analysis
In this Section we explore the possible relationship between bank loans and flood risk.
First, we explore data at municipal level and construct an indicator of catastrophe risk
based on the fraction of LBUs exposed to high flood risk within each municipality. Sec-
ond, we match data from the ISPRA report with proprietary bank lending data, comment-
ing on Italian banks’ exposure to catastrophe risk. Third, we investigate the determinants
of bank loans to firms with a focus on the explanatory power of the catastrophe risk indi-
cator, looking separately at performing and non-performing loans.
4.1 Catastrophe risk indicator
As Figure 3.1 clearly shows, flood risk is not only spread unequally among regions and
provinces, but also within each province. The ISPRA dataset is available at municipal
level, so we take the municipality as reference unit.6 We define our measure of catastro-
phe risk per municipality j as the share of LBUs at high-risk of flood over the total number
of LBUs located in municipality j:
LBUs at risk j
CatRisk j = (4.1)
total number of LBUs j
Figure 4.1 plots the distribution of Catrisk. The median of the distribution is very close
to 0, confirming that risk is concentrated in a relatively small number of municipalities.
The distribution is right-skewed, with risky municipalities having up to 40 percent of
5 Statistics
on landslide risk in the ISPRA report show, instead, that only 1.7 percent of LBUs is at high
or very high-risk, with most of them located in only one region (Valle d’Aosta) producing the 0.3 percent
of national value added. For this reason, in the rest of paper we just focus on flood risk, the most relevant
hydrogeological risk for investment financing in Italy.
6 Municipal data for high-flood risk areas, which are not present in the ISPRA report, are available from
the Italia Sicura website of the Italian government.
12firms at high-risk.
Figure 4.1: Municipal distribution of LBUs at high flooding risk (P3). Labels of the x-axis indicate the
lower bound of each class.
In order to give a synthetic description of the per-municipality flood risk, we divide
municipalities in two groups: the Low-Impact Flooding (LIF) one, which encompasses
municipalities with lower share of exposed LBUs than the 75th percentile (around 3 per-
cent), and the High-Impact Flooding (HIF) group, with equal or higher share of exposed
LBUs than 3 percent.7 Table 3 reports the number of LIF and HIF municipalities for each
region. HIF municipalities are mostly concentrated in Piemonte, Lombardia and Emilia
Romagna.
4.2 Bank loans to risky firms
If floods damage LBUs, firms can suffer business disruptions and fail to pay back their
debt obligations. Therefore, financial intermediaries are exposed to natural catastrophes
through their loans, other than through their own offices located in risky areas. This
indirect channel should be relevant in Italy, provided that Italian firms mainly rely on
7 The 75th percentile is arbitrarily chosen for illustrative purposes. This choice does not affect results in
the regression analysis, which is carried out using the whole sample of data.
13Region LIF HIF Total
Abruzzo 290 15 305
Basilicata 128 3 131
Calabria 287 122 409
Campania 475 76 551
Emilia-Romagna 174 174 348
Friuli-Venezia Giulia 187 31 218
Lazio 340 38 378
Liguria 98 137 235
Lombardia 1228 316 1544
Marche 24 9 33
Molise 134 2 136
Piemonte 855 351 1206
Puglia 212 46 258
Sardegna 310 67 377
Sicilia 378 12 390
Toscana 155 132 287
Trentino 315 18 333
Umbria 65 26 91
Valle d’Aosta 24 50 74
Veneto 481 100 581
All 6160 1725 7885
Table 3: Municipal-level distribution for class of Flooding Impact in 2014. The High-Impact Flooding
(HIF) class contains municipalities with share of exposed LBUs equal or greater than 3 percent; Low-Impact
Flooding (LIF) municipalities are the remaining ones. Data on the remaining 170 municipalities are missing.
the banking system to raise external finance: indeed, for Italian non-financial companies
bank debt represents about 70 percent of total debt, compared with 38 percent in France,
49 in Germany, and 30 percent in UK (Accetturo et al., 2013).
We investigate the indirect exposure of banks using loan data. Credit granted by banks
operating over the Italian territory is collected by the Bank of Italy through its bank over-
sight activity. In order to be consistent with land categorization in the ISPRA report, we
take data as of end-2014: at that time, the stock of outstanding loans was 1.9 trillion euros,
of which 856 billion (the 47 percent) granted to the non-financial business sector. Consid-
ering only credit to non-financial business sector, we aggregate loan-level data by munic-
ipality in which the bank branch which granted credit is located, supposedly close to the
final use destination of credit. Then, we match municipal data with our Catrisk indicator.
Table 4 displays the amount of outstanding business loans as of end-2014 , divided by
LIF and HIF municipalities. More than 20 percent of the total loan amount is granted in
HIF municipalities, with the bulk of business loans at risk located in Lombardia, Veneto,
Emilia Romagna and Tuscany.
The loan-level dataset from the Central Credit Register also contains information on
14Region LIF HIF Total
Abruzzo 9.763 1.037 10.801
Basilicata 2.040 18 2.059
Calabria 2.531 1.785 4.316
Campania 25.030 1.733 26.763
Emilia-Romagna 52.734 26.091 78.825
Friuli-Venezia Giulia 11.057 2.649 13.706
Lazio 64.498 2.006 66.504
Liguria 223 15.611 15.834
Lombardia 227.927 39.873 267.800
Marche 1.997 1.533 3.529
Molise 1.191 1 1.193
Piemonte 48.561 6.481 55.042
Puglia 15.261 2.950 18.211
Sardegna 4.927 2.814 7.740
Sicilia 18.366 37 18.404
Toscana 49.059 22.860 71.919
Trentino 20.161 1.847 22.008
Umbria 6.105 2.933 9.038
Valle d’Aosta 580 262 842
Veneto 51.587 29.435 81.023
All 613.601 161.956 775.557
Table 4: Bank loans to firms for class of Flooding Impact and Region: 2014 (mln euro).
the sector to which each borrower belong. Table 5 reports business loans, granted in LIF
and HIF municipalities, by borrower sector.8 About 60 percent of the loan amount in
HIF municipalities is concentrated in four industries: Construction, Wholesale and Retail
Trade, Real Estate activities and Basic Metals and Plastic Products.
4.3 A multivariate descriptive analysis
In this section, we analyze our environment-firm-credit dataset within a regression setup
in order to estimate the elasticity of bank loans to the variation in flood risk at municipal
level. We regress both the total amount of loans and the subset of performing loans on
the natural logarithm of the CatRisk variable and controls. Using credit stocks instead of
one-year flows, on one side we capture the historical relationship between lending and
catastrophe risk, not conditional on economic and natural events related to one specific
year of the sample; on the other side, we include loans made at times when the awareness
on climate-related risks and the expertise to estimate them were very low. The estimates
may therefore underestimate the existing link between catastrophe risk and bank lending.
8 The sectorial breakdown is based on ATECO sectors, i.e. the adaptation of Eurostat’s NACE sector
classification to the Italian industry by the ISTAT.
15# Industry sector LIF HIF Total
1 Mining 1.294 454 1.748
2 Food Products 22.462 6.105 28.567
3 Textiles 14.471 5.787 20.258
4 Wood and Products of Wood 9.229 2.694 11.923
5 Paper and Paper Products 6.874 2.134 9.009
6 Chemicals and Pharmaceuticals 12.173 2.592 14.764
7 Rubber and Plastic Products 7.932 2.025 9.956
8 Basic Metals and Metal Products 38.001 13.272 51.273
9 Electrical Equipment 8.751 2.174 10.924
10 Machinery and Equipment 16.490 4.787 21.276
11 Transport Equipment 7.795 1.718 9.512
12 Other Manufacturing 6.612 1.830 8.442
13 Electricity and Gas 33.882 5.608 39.490
14 Construction 106.765 30.639 137.404
15 Wholesale and Retail Trade 101.226 27.430 128.656
16 Transportation and Storage 34.246 5.903 40.149
17 Accommodation and Food Service 22.113 8.149 30.262
18 Information and Communication 13.031 1.556 14.587
19 Real Estate Activities 91.854 24.646 116.499
20 Professional Activities 25.929 5.596 31.525
21 Rental and Leasing Activities, Travel Etc 16.697 3.063 19.760
22 Other Service Activities 15.776 3.795 19.571
All 613.601 161.956 775.557
Table 5: Banks loans to firms for class of Flooding Impact and Industry: 2014 (mln euros).
Defining the total loan stock as TL = PL + NPL, where PL (NPL) are performing
(non-performing) loans, we estimate the following regressions:
TL j,h,k = β 0 + β 1 CatRisk j,h + δ controls j,h,k + e j,h,k (4.2)
PL j,h,k = β 0 + β 1 CatRisk j,h + δ controls j,h,k + e j,h,k (4.3)
where { j = 1, . . . 7885} indicates the municipality, {h = 1, . . . , 108} the province
and {k = 1, . . . , 23} the borrower’s industry sector; controls stands for control variables,
which include 107 province dummies and 22 sectoral dummies.
4.4 Results
Table 6 reports the results of the estimation of Equation 4.2, where standard errors are
clustered at province level. The percentage of business units at high-risk of flooding
within each municipality has a significant, negative effect on bank lending: a one-percentage
16point increase in CatRisk entails a fall in the amount of total loans by 0,17 percentage
points. This suggests that the catastrophe risk exposure can affect lending decisions or,
more generally, credit availability. The regression has an R-squared of 0.13. With few ex-
ceptions, sectoral- and province-level dummies are significant at the one percent level (not
reported in table), entailing strong relationship of lending activity with the geographic
destination of loans and type of industry.
Results of Equation 4.3 are displayed in Table 7. The coefficient of Catrisk is slightly
higher than that in Table 6, showing that the relationship is stronger in the case of per-
forming loans only.
Dependent variable: TL
Parameter Estimate Std Err t Value p-value 95% Conf Int
Intercept - 0,755 0,041 - 18,3104.5 Robustness analysis at province-level
Our municipal level dataset does not allow us to control for bank and firm size, as well as
for local value added that is not reported at municipal level. On the bank side, big banks
can be more able to diversify risk, screen firms and absorb losses, but also have different
internal decision processes and relationships with their customers; on the firm side, small
and medium enterprises can be less resilient to floods than larger firms, also because they
have less business units and those are geographically closer to each other (so they have
less room to diversify catastrophe risk than large firms).
We conduct a robustness analysis by using credit data from a different proprietary
dataset, based on surveillance reports of banks to the Bank of Italy, which allows for a
wider set of controls. This dataset aggregates loans to firms at province level, imputing
loans to the province in which the firm is legally resident. The province scale and the
imputation by firm residence constitute two limitations of this data source. We construct
a measure of catastrophe risk at province level (CatRiskprov ) and, using the province-level
stocks of performing and non-performing loans (PLprov and NPLprov ), run the following
regressions
prov prov prov prov
PL p,q,r,s,u = β 0 + β 1 CatRisk p,q + γ controls p,q,r,s,u + δ int p,q,r,s,u + e p,q,r,s,u (4.4)
where { p = 1, . . . , 110} identifies the borrower’s province of residence, {q = 1, . . . , 20}
the region of residence, {r = 1, 2} identifies the bank type (i.e., 1 = small bank, 2 =
big bank, 3 = non-classified banks), {s = 1, 2, 3} the type of borrower (i.e., 1 = small
and medium enterprises, 2 = large non-financial firms, 3 = producer households), {u =
1, . . . , 23} the borrower’s industry sector; controlsprov stands for control variables, and
intprov for interaction terms.
Control variables are:
• a firm-size dummy for small-medium enterprises (SME);
• two bank-size dummies (BigBanks and SmallBanks);
• 22 sector dummies, to disentangle differences in the credit granted among provinces
related to the sectoral specialization of each province from differences due to flood
risk considerations;
18• the 2013 sectoral value added for the two macro-sectors (manufacturing and ser-
vices) at province level (log (VAManu f 2013) and log (VAServ2013)): higher valued-
added provinces might demand a different amount of credit than lower value-
added ones;
• 19 regional dummies: regional characteristics (e.g., the presence or lack of specific
public spending programs at regional level) can positively or negatively affect the
business environment, so the propensity of banks to lend to firms that operate in
that environment;
Interaction terms are included to control for possible combined effects between variables.
The firm-size dummy is interacted with the bank-size ones to control for combined bank-
firm characteristics; the catastrophe risk variable is interacted with bank dummies to iden-
tify correlations between bank lending and catastrophe risk that are limited to specific
bank types (i.e., small or bigs) or firm type (i.e., small and medium enterprises).
Table 8 reports the results for the specification in Equation 4.4. The regression has an
R-squared of 0.2. Also in this case, sectoral and regional dummies are significant at the
one percent level. The dummy for small- and medium-size enterprises has the expected
negative sign, meaning that an increase in the share of small and medium enterprises is
associated with a reduction in the total amount of loans; on the contrary, the coefficients
of the two bank-size dummies are both positive, meaning that bank loans are higher for
big and small banks compared with medium-sized banks. As bank and firm dummies,
the sectoral value added dummies are also significant at the 1 percent level.
Bank lending is positively correlated with the CatRisk variable and it is negatively
correlated with the dummy SME; this negative SME effect increases with catastrophe risk
indicating that bank lending further decrease for the SMEs that are located in high-risk
flooding areas. The latter result is in line with the municipal level analysis, and reflect the
fact that the imputation of credit in the two analyses may be similar in case of small and
medium-size firms, which are likely to have a legal residence that is close to the places
in which credit is granted (and used). Assuming the imputation of credit to big firms
is not biased, the joint result for the two coefficients may suggest that banks take into
consideration catastrophe risk in their loan decisions only in the case the borrower is a
small or medium enterprise, because the latter is considered to be less resilient to natural
catastrophes. Another interesting result is that CatRisk is positively correlated with bank
lending in case of loans being granted by big banks: big banks lend more to risky areas,
maybe because firms hit by floods demand credit mainly to them to rebuild damaged
industrial sheds.
19Dependent variable: PL_province
Parameter Estimate Std Err t Value p-value 95% Conf Int
Intercept 8.499 0.063 134.9Unfortunately our source loan-level dataset does not include information on the inter-
est rate applied to each loan. The costs of loans can in principle be used to discriminate
across firms located in risky areas; however, if there is credit rationing for firms exposed
to flood risk, we could safely ignore it on the ground of the evidence according to which
banks might rather set below-average rates and ration credit than increase interest rates
when facing an increased demand (see the literature review in Kirschenmann (2016)).
4.6 Insurance coverage
In the previous regressions we did not control for the possibility that firms can be in-
sured against flooding, because data on flood risk insurance, as well as data on general
catastrophe risk insurance coverage, are not available for the Italian business sector. The
insurance coverage may be a relevant omitted variable: indeed, if one firm is insured
against floods, banks may ideally choose to ignore its exposure to flood risk when grant-
ing loans, knowing that physical damages are reimbursed by the insurance. While this
hypothesis may sound naive, provided that firms suffer business disruptions in case of
floods (and can become unable to repay loans) no matter whether they are insured or not,
it cannot be ruled out.
To gain insights on this topic, we added two specific questions in the 2016 edition of
the Survey of Industrial and Service Firms and Business Outlook conducted on an annual
basis by the Bank of Italy. In particular, we asked the following two questions:
• Question 1: Has your company suffered losses or spent money to restore its business because
of floods or landslides during the last five years? (Possible answers are: Yes; No; I dont’
know/I don’t want to answer)
• Question 2: Are your business units and machinery insured against floods or landslides?
(Possible answers are: No, but we will do it; No, and we will not do it; Yes)
Results are reported in Table 9 and 10, where missing answers in the two questions are
imputed using standard statistical procedures. Of the whole set of interviewees, the 5.3
percent has been hit by a hydrogeological event between 2012 and 2016, with the majority
of them in the industry sector and located in the north-west and in the center of Italy; the
44 percent of interviewees is insured against damages caused by floods or landslides,
with a lower insurance coverage in the South of Italy and for smaller firms.9
9 Interestingly, by crossing information on Question 1 and Question 2, you get that not all firms that have
suffered losses related to landslides and floods between 2012 and 2016 were planning to insure against
21Geographic area and size Industry Services Total
North-west 8.4% 5.2% 6.9%
North-east 3.8% 2.5% 3.2%
Center 6.7% 5.8% 6.2%
South 5.9% 3.5% 4.4%
20-49 5.9% 3.4% 4.6%
50-99 6.4% 5.6% 6.0%
100-199 6.2% 5.4% 5.9%
200-499 9.9% 7.6% 8.7%
500-999 10.6% 13.1% 12.0%
1000+ 12.8% 15.8% 14.7%
Total 6.3% 4.4% 5.3%
Table 9: Percentage of the interviewed companies which suffered losses or spent money to restore their
business because of floods or landslides between 2012 and 2016, by geographic area, number of employees
and sector (Question 1).
Geographic area and size Industry Services Total
North-west 50.4% 41.4% 46.9%
North-east 51.0% 42.6% 47.3%
Center 44.1% 44.1% 44.1%
South 39.2% 28.7% 32.7%
20-49 43.1% 38.5% 40.7%
50-99 54.0% 39.0% 46.6%
100-199 59.1% 44.4% 51.9%
200-499 65.7% 42.2% 53.6%
500-999 66.3% 52.4% 58.4%
1000+ 66.8% 53.6% 58.3%
Total 48.0% 39.6% 43.7%
Table 10: Percentage of the interviewed companies which was insured against floods or landslides as of
2016, by geographic area, number of employees and sector (Question 2).
these types of events in the future. The complete set of results from Question 1 and 2 are available upon
request.
22All in all, results from the Survey indicate a low insurance penetration in the Italian
business sector. This is relevant for our analysis, also because the Survey targets firms
with 20 or more workers, while the average dimension of Italian firms is 3.7 workers
(according to ISTAT): if one reasonably assumes that small firms are less incline to buy
insurance against catastrophe events than big ones, as it is evident in the Invind data
(e.g. because insurance premia are relative more expensive for SMEs), the percentage of
insured firms in the population of Italian firms is actually lower than that obtained in the
Survey’s sample. This suggests that the omission of insurance coverage in our regressions
should not seriously bias the estimator adopted.
5 Conclusions
We make an empirical assessment of the risk borne by the Italian banking sector through
its exposure to firms located in areas at risk of flooding. For this purpose, we match a new
mapping of flood risk areas over the Italian territory with proprietary bank lending data.
We construct a measure of flood risk as the share of firms located in high-flood risk areas
within each municipality and test whether the amount of bank credit granted to firms
depends on the level of flood risk. We find that lending activity is negatively correlated
with catastrophe risk, and results are confirmed for loans granted to small and medium
enterprises in a robustness analysis at the province level. Our results are compatible
with the hypothesis that credit activity could be somehow influenced by catastrophe risk
and open to new research on the topic: while there is no identification of demand and
supply drivers of credit, our results may suggest that banks can discriminate borrowers
by their catastrophe risk exposure. This study proposes a classification of the entire stock
of credit in one economy by climate-related riskiness of the borrower, that can be used
to track climate-related risk perception over time. Indeed, based on publicly available
information on the degree of flood risk by geographic areas, it allows to give insights
on the ex-ante perception of risk, without making inference from the ex-post behavior of
agents.
23References
Accetturo, D. A., Bassanetti, A., Bugamelli, M., Faiella, I., Russo, P. F., Franco, D., Gia-
comelli, S., Numero, M. O., 2013. Questioni di Economia e Finanza Il sistema industriale
italiano tra globalizzazione e crisi.
Alfieri, L., Burek, P., Feyen, L., Forzieri, G., 2015. Global warming increases the frequency
of river floods in Europe. Hydrology and Earth System Sciences.
Barro, R. J., aug 2006. Rare Disasters and Asset Markets in the Twentieth Century*. Quar-
terly Journal of Economics 121 (3), 823–866.
Barro, R. J., Ursúa, J. F., sep 2012. Rare Macroeconomic Disasters. Annual Review of Eco-
nomics 4 (1), 83–109.
Belanger, P., Bourdeau-Brien, M., dec 2017. The impact of flood risk on the price of resi-
dential properties: the case of England. Housing Studies, 1–26.
Cavallo, E., Galiani, S., Noy, I., Pantano, J., dec 2013. Catastrophic Natural Disasters and
Economic Growth. Review of Economics and Statistics 95 (5), 1549–1561.
Cavallo, E., Powell, A., Becerra, O., jul 2010. Estimating the Direct Economic Damages of
the Earthquake in Haiti*. The Economic Journal 120 (546), F298–F312.
Cortés, K. R., Strahan, P. E., 2017. Tracing out capital flows: How financially integrated
banks respond to natural disasters. Journal of Financial Economics.
Faiella, I., 2013. Uso sostenibile del suolo in italia: analisi e proposte. In: Calamita idrogeo-
logiche: aspetti economici. Accademia dei Lincei, Rome (Italy), XIII Giornata mondiale
dell’acqua.
Gabaix, X., may 2012. Variable Rare Disasters: An Exactly Solved Framework for Ten
Puzzles in Macro-Finance. The Quarterly Journal of Economics 127 (2), 645–700.
Garmaise, M. J., Moskowitz, T. J., 2009. Catastrophic Risk and Credit Markets. The Jorur-
nal of Finance (2).
Gourio, F., oct 2012. Disaster Risk and Business Cycles. American Economic Review
102 (6), 2734–2766.
URL http://pubs.aeaweb.org/doi/10.1257/aer.102.6.2734
24Kirschenmann, K., apr 2016. Credit rationing in small firm-bank relationships. Journal of
Financial Intermediation 26, 68–99.
URL https://www.sciencedirect.com/science/article/pii/S1042957315000406
Klomp, J., aug 2014. Financial fragility and natural disasters: An empirical analysis. Jour-
nal of Financial Stability 13, 180–192.
URL https://www.sciencedirect.com/science/article/pii/S1572308914000539
Koetter, M., Noth, F., Rehbein, O., 2016. Borrowers Under Water! Rare Disasters, Regional
Banks, and Recovery Lending. IWH Discussion Papers, No. 31/2016.
Lamond, J., Proverbs, D., Hammond, F., may 2010. The Impact of Flooding on the Price
of Residential Property: A Transactional Analysis of the UK Market. Housing Studies
25 (3), 335–356.
URL http://www.tandfonline.com/doi/abs/10.1080/02673031003711543
Lloyds, 2014. Catastrophe modelling and climate change. Tech. rep.
McDermott, T. K., Barry, F., Tol, R. S., jul 2014. Disasters and development: natural disas-
ters, credit constraints, and economic growth. Oxford Economic Papers 66 (3), 750–773.
Morse, A., oct 2011. Payday lenders: Heroes or villains? Journal of Financial Economics
102 (1), 28–44.
URL https://www.sciencedirect.com/science/article/pii/S0304405X11000870
Noy, I., mar 2009. The macroeconomic consequences of disasters. Journal of Development
Economics 88 (2), 221–231.
URL https://www.sciencedirect.com/science/article/pii/S030438780800031X
Odell, K. A., Weidenmier, M. D., 2004. Real shock, monetary aftershock: The 1906 San
Francisco Earthquake and the Panic of 1907. The Journal of Economic History 64 (4),
1002–1027.
Rietz, T. A., jul 1988. The equity risk premium a solution. Journal of Monetary Economics
22 (1), 117–131.
URL https://www.sciencedirect.com/science/article/pii/0304393288901729
Standard, Poor’s, 2014. Climate change could sting reinsurers that underestimate its im-
pact. Tech. rep.
Strobl, E., 2011. The Economic Growth Impact of Hurricanes: Evidence from U.S. Coastal
Counties. Review of Economics and Statistics.
25Trigila, A., Iadanza, C., Bussettini, M., Lastoria, B., Barbano, A., 2015. Dissesto idrogeo-
logico in italia: pericolosità e indicatori di rischio. ISPRA Report 233.
Vigdor, J., oct 2008. The Economic Aftermath of Hurricane Katrina. Journal of Economic
Perspectives 22 (4), 135–154.
URL http://pubs.aeaweb.org/doi/10.1257/jep.22.4.135
Wachter, J., jun 2013. Can Time-Varying Risk of Rare Disasters Explain Aggregate Stock
Market Volatility? The Journal of Finance 68 (3), 987–1035.
26You can also read