Broadband speed and firm entry in digitally intensive sectors: The case of Croatia
←
→
Page content transcription
If your browser does not render page correctly, please read the page content below
Munich Personal RePEc Archive

Broadband speed and firm entry in
digitally intensive sectors: The case of
Croatia

Drilo, Boris and Stojcic, Nebojsa and Vizek, Maruska

Croatian Telecom, University of Dubrovnik, Department of
Economics and Business, The Institute of Economics Zagreb

July 2021

Online at https://mpra.ub.uni-muenchen.de/108717/
MPRA Paper No. 108717, posted 11 Jul 2021 08:29 UTC
BROADBAND SPEED AND FIRM ENTRY IN DIGITALLY INTENSIVE SECTORS:
                        THE CASE OF CROATIA

                                             Boris Drilo1
                                            Nebojša Stojčić2
                                            Maruška Vizek3

We explore how improvements in digital infrastructure contribute to digital transformation of
the Croatian economy. More specifically, we investigate under what conditions improvements
in broadband speed are conductive for firm entry in digitally intensive sectors at the local level
(cities and municipalities; LGUs) during the period 2014–2017. The results of the benchmark
random effects panel data model suggest a 10 percent increase in broadband speed increases
the number of new digitally intensive firms by 0.68. Two-way interactions between
explanatory variables suggest improvements in broadband infrastructure yield the greatest
number of new firm entries in densely populated LGUs, and in LGUs with a higher quality of
human capital and greater public investment in physical infrastructure. Using the spatial Durbin
panel method, we find improvements in broadband infrastructure exhibit positive firm entry
effects both within and between cities and municipalities.

Key words: firm entry, digitally intensive sectors, broadband speed, digital transformation,
Croatia, spatial spillovers

Disclaimer: Draft of manuscript accepted for publication in Društvena istraživanja : Journal
for General Social Issues. For citation please check for final version at journal website.

1
  Chief technological and information officer, Croatian Telekom, Croatia, boris.drilo@t.ht.hr.
2
  Vicerector for business affairs, University of Dubrovnik, Croatia and Visiting professor at Staffordshire
University, UK, nstojcic@unidu.hr.
3
  Director, The Institute of Economics, Zagreb, mvizek@eizg.hr.

                                                                                                         1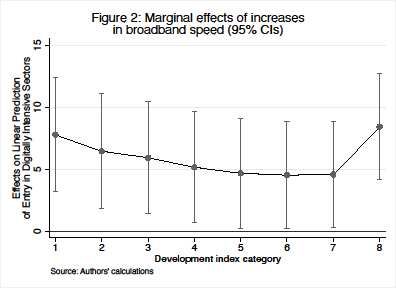
1. Introduction

One of most profound features of modern economies is the penetration of digital technologies

into nearly every aspect of socio-economic living. The benefits of digital transformation

encompass easier search for information, greater consumer choice, ease of access to

organizational resources, cost savings due to automation and penetration of artificial

intelligence in production process, and the ability to reach customers at greater economic

distances, thereby improving organizational performance. This motivates many advancing

economies to seek out ways to steer their economic structure towards digitally intensive

activities and to facilitate entry of firms into digitally intensive sectors. The success of such

incentives depends on actions in the field of key enabling technologies, among which the most

relevant is broadband infrastructure.

Empirical studies investigated the contribution of broadband to digital transformation of the

economy and organizational behaviour in advanced countries. However, far less is known

about its effects in advancing economies. The reason for this is lack of relevant firm and

industry level data that would enable assessment of the microeconomic dynamics of digital

transformation.

       This paper explores for the first time how improvements in broadband infrastructure

facilitate digital transformation of local governmental units in Croatia (LGUs). Specifically,

we investigate whether faster broadband increases firm entry in digitally intensive sectors and

whether these effects are spatially bounded. We want to determine the conditions under which

improvements in digital infrastructure can foster entrepreneurship in digitally intensive sectors

within and between LGUs. We use LGU level data for the period 2014–2017, and apply

random effects and spatial Durbin panel data models. Panel data on broadband speeds at LGU

level are, in general, rare and beyond the reach of researchers. Our study is in unique position

to obtain access to the most recent available dataset covering all Croatian LGUs and timespan

                                                                                               2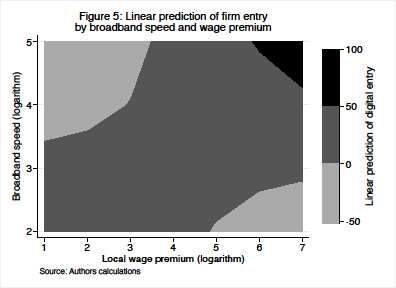
of several years. This allows us to advance existing literature by tracing the relationship

between broadband speeds and firm entry in spatio-temporal framework.

       In terms of broadband speeds Croatia falls in the group of digitally lagging European

economies. European Commission’s Digital Scoreboard (2020) data shows that share of fixed

broadband subscriptions with speeds above 30 Mbit/s has been much lower than EU average

and growing at slower rate throughout analysed period. These trends are still present in 2020

and particularly evident in case of broadband speeds equal to or higher than 100 Mbit/s.

Worldwide broadband speed rankings (Cable.co.uk, 2021) further confirm these trends. On

global scale Croatia ranked 40 in 2017 but fell on 52nd position in 2020. Understanding whether

broadband speeds influence firm entry in digitally intensive sectors of such environment may

serve as input to both academics and policy makers.

       To the best of our knowledge, this is the first study to explore the relationship between

the state of digital infrastructure and market outcomes in digitally intensive segments of the

economy, and the first to explore the influence of broadband Internet on firm entry in advancing

country such as Croatia.

   The paper is organised as follows. The second section reviews the literature. The third

section describes the dataset and the methodology. Section four discusses the main findings.

Section five summarises the main findings and offers policy recommendations.

   2. Conceptual framework

The relationship between broadband speeds and firm entry belongs to relatively unaddressed

areas of market dynamics literature. From rare studies undertaken on advanced economies we

know that better broadband quality (including speed) facilitates firm entry (Lehr et al., 2006;

McCoy et al., 2018) and that it can offset disadvantages of rural regions (Mack, 2014; Kim and

Orazem, 2017). However, its effects vary across sectors (Hasbi, 2019). Evidence was found of

particularly beneficial effects on knowledge and digitally intensive sectors (Mack et al., 2011).

                                                                                               3
The effect of better broadband access on firm entry takes place through several channels.
Improvements in broadband lower transaction costs and facilitate coordination between firms,
customers and suppliers (Borenstein & Saloner. 2001; Sinai and Waldfogel, 2004; Lamie et
al., 2014). Further beneficial effects are instigated through remote working opportunities and
easier job matching that reduce firm dependence on local labour markets (Autor, 2001).
Finally, better broadband increases market transparency and thus reduces barriers to firm entry
(Czernich et al., 2011). These beneficial effects of broadband speed facilitate firm entry but
they also may increase attractiveness of some locations over others leading to spatial
divergence of firm entry rates (Grubesic & O´Kelly, 2002; Grubesic & Murray, 2002; Grubesic
& Murray, 2004; Kolko, 2012).
Despite its beneficial effects for firm entry, the role of broadband speeds did not receive much
attention outside of advanced economies. This is surprising as digital transformation presents
window of technological opportunity for catching-up of advancing economies and first step in
such direction are key enabling technologies such as broadband. It follows from there that
investigation of broadband speed effects on firm entry in such economies may present first
evidence-based step towards formulation of digital transformation policies in advancing
economies. Our study aims to fill this literature gap.
3. Dataset and methodology
The objective of the analysis is to assess the impact of improvements in broadband speed on
firm entry in digitally intensive sectors. Although digital transformation has impacts across a
variety of sectors, these effects are not evenly distributed across all industries. Considering this,
a taxonomy of sectoral digital intensity was recently proposed by Calvino et al. (2018) and
adopted by OECD. The taxonomy considers the contribution to sectoral digital transformation
from firms’ investment in digital assets and the digital transformation of organizational
4business models, particularly their customer and supplier relations management, production
organization, and skill mismatch management in the digital economy. Such a taxonomy acts as
a proxy for the extent of the digital transformation in sectors.
The taxonomy takes into account measures such as shares of investment in ICT
equipment and software, purchases of ICT intermediate goods, stocks of robots per employee,
share of ICT specialists in employment, and propensity towards engagement in e-commerce.
The choice of the underlying indicators is reliant on the availability of data used in the
derivation of the index. Some measures relevant for edge technologies in digital
transformation, such as additive manufacturing or big data and machine learning, are not used
due to a lack of relevant and comparable data. Based on available indicators, industries are
grouped as high, medium-high, medium-low or low-digitally intensive sectors. Table 1
provides an overview of the taxonomy of digitally intensive sectors.
Table 1: Taxonomy of sectors by digital intensity
Sector Intensity Sector Intensity
Agriculture, forestry and fishing Low Wholesale and retail trade, repair Medium high
Mining and quarrying Low Transportation and storage Low
Food products, beverages and tobacco Low Accommodation and food service activities Low
Textiles, wearing apparel, leather Medium low Publishing, audiovisual and broadcasting Medium high
Wood and paper products, and printing Medium high Telecommunications High
Coke and refined petroleum products Medium low IT and other information services High
Chemicals and chemical products Medium low Finance and insurance High
Pharmaceutical products Medium low Real estate Low
Rubber and plastics products Medium low Legal and accounting activities, etc. High
Basic metals and fabricated metal products Medium low Scientific research and development High
Computer, electronic, optical products Medium high Advertising and other business services High
Electrical equipment Medium high Administrative and support service High
Machinery and equipment n.e.c. Medium high Public administration and defence Medium high
Transport equipment High Education Medium low
Furniture; other manufacturing; repairs Medium high Human health activities Medium low
Electricity, gas, steam and air cond. Low Residential care and social work activities Medium low
Water supply; sewerage, waste Low Arts, entertainment and recreation Medium high
Construction Low Other service activities High
Source: Calvino et al. (2018)
5Following the above classification, we focus on medium-high and high digitally
intensive sectors which we label as digitally intensive. The analysis utilises several data sources
to explore how improvements in broadband speed facilitate the birth of new firms in these
sectors. A detailed description of data sources is provided in the Appendix. Most data is
available for all 557 Croatian LGUs. However, data on average broadband speeds were
obtained only for 480 LGUs. To this end, our analysis covers 86% of all LGUs distributed
across the country. Figure 1a provides a visual presentation of our sample through the average
number of firm entries in digitally intensive sectors at the LGU level.
From Figure 1, it is evident that digitally intensive firms are concentrated in several
regions in Croatia, which is most pronounced in the capital city of Zagreb. In most cities and
municipalities for which data were available, the number of newly established firms in digitally
intensive sectors during the study period ranges from 0 to 5. In most areas, the share of digitally
intensive entries in the total number of firms in digitally intensive sectors (Figure 1b) is fairly
low, ranging between 0 and 5 percent. However, digitally intensive entrants constitute the bulk
of entries when examined across the entire population of entrants in each year. Figure 1c
indicates that in most cities and municipalities, these firms constitute more than 25% of new
firm establishments.
6To explore the relationship between broadband speed and firm entry in digitally
intensive sectors, we develop an empirical model based on the theoretical predictions of
determinants of firm entry and the available data. The key independent variable is average
broadband speed in a given LGU, as measured in Mbit/s. The Croatian fixed broadband market
is dominated by two large operators (Hrvatski Telekom, i.e. Croatian Telecom, and A1), where
Croatian Telecom is considered the market leader, holding 51 percent of the market (Institute
of Economics, Zagreb. 2020). Both companies are foreign-owned. The majority owner of
Croatian Telecom is Deutsche Telekom, while A1 is part of the Telekom Austria Group. The
7fixed telecommunication market in Croatia is in gradual decline, with the last quarter of 2017
recording a 12.04 percent annual drop in revenues, accompanied by annual decline in the
number of new landline hook-ups of 2.14 percent.
We control for the distance of the local unit from the county administrative centre
(measured in kilometres). Administrative centres provide a variety of amenities for new
businesses such as professional expertise, greater workforce pool, and higher demand, and as
such are more attractive to potential entrepreneurs. We also control for average population
density in LGUs as a proxy for local demand that may facilitate firm entry. Several variables
control for public incentives of the local administration. Public expenditure in material assets
was included as a proxy for investments in infrastructure. Moreover, the model includes the
share of public production subsidies in total revenues of the business sector in a given LGU.
We expect that better access to infrastructure and financial incentives support firm entry. We
also control for a locational wage premium through the ratio between the local average wage
and average wage at the national level. The model also includes categorical variables for
development levels of each LGU.
Finally, we include year and county categorical variables among control variables. All
non-categorical variables and variables not taking zero values enter the model in natural
logarithm form. Table 2 provides the list of variables and their definitions, while a detailed
explanation of data sources and descriptive statistics for the main variables are provided in the
Appendix.
Table 2: Description of variables
Variable Definition Source
Entry Number of firm births in digitally intensive sectors in city/municipality i in period t. FINA
Speed Broadband speed in city/municipality i in period t in Mbit/s – natural logarithm Croatian
Telecom
Distance Distance from the county administrative centre in kilometres – natural logarithm Google maps
Density Population density in city/municipality i in period t (number/km2) – natural logarithm Central
Bureau of
Statistics
8Expenditure Average amount of public expenditure on material assets in the three years prior to period t (in HRK Ministry of
1000s) - natural logarithm Economy
Subsidies Share of production subsidies in total revenues of the business sector in city/municipality i in period t FINA
Wage Ratio between the average wage in city/municipality i in period t and the average wage at the national FINA
level in period t (in %) – natural logarithm
IR1-IR8 Categorical variables for categories of development level index Ministry of
Regional
Development
and EU Funds
County 1-21 Categorical variables for Croatian counties FINA
Year1-Year4 Categorical variables for years FINA
Our empirical analysis combines several techniques. Baseline analysis relies on the use
of a random effects panel estimator. The choice of estimation technique is driven with several
features of our model. The relatively short time span prevents the use of dynamic panel
estimators. Our model contains several time invariant variables, such as measures of distance,
population density and categorical variables for development index, year and county, as
dummy variables that would be differenced away with fixed effects estimators.
Random effects models rest on several assumptions such as strict exogeneity,
homoscedasticity and existence of significant differences in variance across units (i.e. panel
effects). The strict exogeneity assumption means that in random effects estimation independent
variables and unobserved individual effects are uncorrelated. For such assumption to hold
researcher should include all relevant variables in the model. However, it is often the case that
all variables cannot be accounted for. This poses a risk of omitted variable bias. In our analysis
we included all possible variables to which we had access. However, our estimates should be
interpreted taking into consideration the above requirement of random effects estimation. To
control for further requirements of random effects estimation such as homoscedasticity we
incorporated robust standard errors. Finally, Breusch-Pagan LM test was performed to assess
whether variation in variance across entities is equal to zero, i.e. whether random effects
estimation should be preferred over pooled OLS one.
9In the second part of the analysis, we are also interested in mediating the effects of
several of our controlling variables, which is why the subsequent parts of analysis assess the
role of different interaction effects. This allows us to assess how outcome of our interest (firm
entry) varies as partial change in one independent variable takes place in relation to the change
of another independent variable. Additional value of this part of analysis is that it enables
assessment of whether the interactions between different variables are large enough to matter.
Urban and regional economics recognised long ago that linkages between business
entities in different locations have a non-negligible role in stimulating local economic activity
of other geographic areas (Marshall, 1920; Jacobs, 1969). To explore whether investments in
broadband infrastructure create any effects on other spatial units, we employ the spatial Durbin
panel model (Lesage and Pace, 2009; Elhorts, 2014). The choice of such model is motivated
by the ability of that model to take into account the variety of spatial linkages through the
dependent and independent variables. In turn, these are aggregated and averaged in the form
of direct, indirect and total spatial effects (LeSage and Pace, 2009; Elhorst, 2014; Belotti et al.,
2017; Stojcic and Orlic, 2020). Direct effects refer to those effects of independent variables
within the LGU, while indirect effects encompass the effects from the original spatial unit to
other spatial units, accounting for the feedback loops between them.
An important issue in the specification of spatial models is also the selection of the spatial
weight matrix, as an NxN matrix that defines the correlation between units in space. To explore
the reach of spatial effects, we employ three types of matrices, i.e. two contiguity matrices
limiting the range of spatial correlation, one to first order only and the other to first and second
order neighbouring LGUs, and an inverse distance matrix allowing for spatial correlation
across the entire sample. The next two sections discuss the findings from our analysis.
104. Discussion of findings
a. Baseline specification
The premise is the assessment of the baseline specification presented in Table 3. As our
dependent variable enters the model in its original form, while other variables enter the model
in the form of a natural logarithm, our model takes on the form of a semi-log estimation. Care
must be taken with interpretation since in semi-log models, a 1% increase in the logarithmic
independent variable corresponds to a 1/100 coefficient of magnitude change in the units of the
dependent variable.
As Table 3 shows, model diagnostics provide support to our model. Wald test value is
highly significant suggesting that all coefficients in the model are jointly different from zero.
Breusch-Pagan Lagrange multiplier test suggests that variances across entities are not zero and
that panel effect is present. In other words, there are significant differences across LGUs and
random effects model should be preferred over pooled OLS regression.
Several of the variables included in our model are highly significant. Starting with
broadband speed, our principal variable of interest, it is evident that a 1% increase in broadband
speed increases number of firms in digitally intensive sectors by a factor of 0.068. This should
be considered in the context of current changes in the broadband speed during the analysed
period. From 2014–2017, broadband speed in Croatian LGUs increased by an average of 10%.
Relating to the above, this means that, on average, 0.68 new digitally intensive firms were
established in each LGU as a result of broadband speed increase. As Croatia has 557 LGUs,
this suggests that broadband improvements over the observed period contributed to the birth of
379 new firms nation-wide. To assess the magnitude of this finding one has to look into total
number of entries in digitally intensive sectors over analysed period. In total, 22.094 new firms
were established in digitally intensive sectors over analysed period. When placed in such
11perspective it follows that creation of only small fraction of them can be attributed to the
improvements in broadband speeds.
An increase in the distance from administrative centre reduces the number of new firms
in digitally intensive sectors by 0.07, suggesting that amenities of agglomerations also matter
for firms in digitally intensive sectors.
Table 3: Results from baseline specification
Variable Coefficient p-value Standard error
Speed 6.80 0.000 2.371
Distance -7.24 0.000 2.105
Density 8.19 0.000 2.498
Expenditure 3.90 0.000 0.665
Subsidies -0.003 0.871 0.022
Wage 1.13 0.379 1.289
Number of observations 1920 1920 1920
Number of groups 480 480 480
Model diagnostics
Wald chi2 test 18750.88 p-value 0.000
Breusch-Pagan LM test 985.31 p-value 0.000
Note: Robust standard errors. Development index, county and year dummy variables included.
Our analysis also shows that a higher population density positively contributes to firm
entry in digitally intensive sectors. This signals that the greater demand and workforce pool
commonly associated with higher population density are relevant for more intensive firm entry
in digitally intensive sectors. A somewhat smaller, but nevertheless positive effect, is also
found for public investments in infrastructure. This suggests that public infrastructure
complements private improvements in broadband infrastructure in facilitating the entry of
digital entrepreneurs.
b. Mediating effects
To explore whether improvements in broadband speed vary along changes in other variables,
we introduce mediating effects between broadband speed and selected variables of interest.
Firstly, we explore whether effects of broadband speed vary across LGUs of different
12development levels, by introducing an interaction between development index variables for
each LGU and broadband speed. Figure 2 presents the findings of effects of this two-way
interaction and shows that the effects of increases in broadband speed are highest in the least
and most developed LGUs although the effects remain significant for all groups of LGUs.
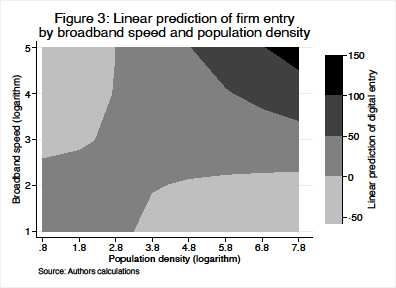
A further question of interest is the role of local population density and public
investments in physical infrastructure. The heat map in Figure 3 reveals an interesting picture
in this respect, as the light grey part of the map reflects negative effects. Less populated LGUs
with high broadband speeds and densely populated LGUs with low broadband speeds have the
lowest predictions for entry of firms. At the opposite end of spectrum, the highest chances for
digital entry can be found in densely populated LGUs with high broadband speeds. These
findings suggest that the benefits of broadband infrastructure are not evenly distributed across
all LGUs, and that they gain the strongest positive effects only when complemented with the
amenities of densely populated LGUs, such as higher demand and workforce pools.
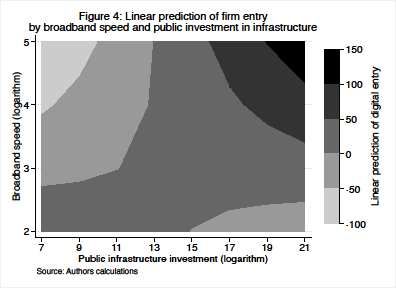
13Figure 4 presents the heat map showing the interaction effects of improvements in
broadband speed and increases in public infrastructure investments. Negative effects are found
in those LGUs (light grey part of figure) where investments in broadband speeds are high but
public investment in physical infrastructure is low and vice versa. This clearly signals
complementarity in the effects of these private and public incentives for entry of firms in
digitally intensive sectors. Further evidence is seen in that highest chances for firm entry are in
areas with high shares of both types of incentives. This may also indicate that the investment
gap needed to upgrade infrastructure in general is, on average, very high and demands more
public and private investments to promote digital entrepreneurship at the local level.
14Wage competitiveness is among the decisive factors for the establishment of businesses
in a particular location. To explore whether local wage conditions matter for entry of our group
of firms, we examine the interaction of the measure of wage premium with broadband speed
and re-estimate the regression. Once again, the same pattern appears as in previous parts of the
analysis (Figure 5). Both measures of broadband speed and local wage premium, and their
interaction term, become highly significant once the interaction term is included. Secondly,
one needs to reflect on our measure of local wage premium. As noted previously, the local
wage premium is expressed as a percentage as the ratio between the local average wage and
the national average wage for a given year. Values of this measure above 100 (corresponding
roughly to a natural logarithm of 4.6) refer to cities and municipalities with above-average
wages, while the opposite holds for areas where the measure has values below 100 (or less than
4.6 on the x-axis scale).
Figure 5 suggests that LGUs with below-average wages and high broadband speeds,
and those areas with above-average wages but low broadband speeds are characterised by
15having negative values of linear prediction of entry in digitally intensive sectors. This signals
that broadband infrastructure or human capital alone are not sufficient incentive for entry of
firms in digitally intensive sectors. In addition, this finding further broadens our understanding
of the prerequisites for a higher number of newly created digitally intensive firms. This
corroborates the findings of Hasbi (2019) and McCoy et al. (2018). We also observe the highest
share of digitally intensive firms created in LGUs with the highest broadband speed and highest
wage premiums.
Together, these findings help to define a rather nuanced map of factors facilitating firm
entry in digitally intensive sectors. Improvements in broadband speed are highly relevant for
firm entry, but obviously not sufficient on their own. Improvements in broadband infrastructure
best flourish in densely populated LGUs with better human capital and complementary public
investment in physical infrastructure.
c. Spatial effects of improvements in broadband infrastructure
The section outlined the characteristics of LGUs with the highest potential for attracting new
business establishments in digitally intensive sectors. One important insight from this part of
the analysis is that on its own, digital infrastructure provides far weaker effects in those areas
that are in the greatest need for the impulse to their economy.
16Table 4 shows the results of the estimation based on spatial econometric analysis.
Following common model diagnostics practice (LeSage and Pace, 2009; Elhorst, 2010; Belotti
et al., 2017; Stojcic and Orlic, 2020), the spatial Durbin panel model was applied, as it enables
the modelling of spatial effects of dependent and independent variables. Following Belotti et
al. (2017) we first performed Wald test on spatial lags of regressors which suggested that these
lags are statistically different from zero and that Spatial Durbin model should be preferred over
spatial autoregressive model. Further testing of restrictions on spatial lag of dependent variable
suggested that Spatial Durbin model should be given preference over spatial error model.
Finally, in line with common procedure AIC and BIC criteria were employed to assess whether
Spatial Durbin model should be preferred over spatial autocorrelation model. As noted
previously, all these tests provided strong support to Spatial Durbin model allowing us to
proceed with interpretation of results.
Starting with improvements in broadband speed, our key variable of interest, we obtain
direct (local) effects comparable to those from the random effects estimation. There is also
evidence of positive indirect (between cities and municipalities) effects, though these effects
are limited to first (direct neighbours) and second (neighbours of neighbours) order
neighbouring LGUs. It is thus likely that improvements in digital infrastructure also facilitate
the entry of firms in digitally intensive sectors in the surrounding LGUs. Findings for other
variables are also in line with expectations. Positive local and spatial effects of population
density and public investment in physical infrastructure are found, as well as negative local and
positive spatial effects of distance (suggesting that greater distance of other units from
administrative centre facilitates entry in location i).
Overall, our findings offer a congruent story. Improvements in broadband speed have
a positive effect on the entry of firms in digitally intensive sectors and this also extends into
the surrounding areas, thus reflecting spatial linkages between firms. These effects, however,
17are attenuated if complementary incentives are present in other areas, such as proximity to
administrative centres, public investment or availability of human capital.
Table 4: Spatial effects on firm entry in digitally intensive sectors
First order neighbours First and Second order neighbours Full spatial
correlation
Direct effects
Speed 6.93*** (2.108) 8.22*** (2.119) 7.74*** (0.964)
Distance -5.86*** (0.997) -6.15*** (1.002) -7.33*** (0.965)
Density 8.66*** (1.128) 8.39*** (1.126) 8.29*** (1.157)
Expenditure 3.42*** (0.755) 3.64*** (0.751) 3.74*** (0.778)
Subsidies 0.02 (0.141) -0.01 (0.141) 0.003 (0.143)
Wage 1.50 (1.365) 1.81 (1.367) 1.95 (1.391)
Indirect effects
Speed 9.94*** (2.103) 7.81*** (2.316) -1.49 (5.549)
Distance 0.01 (0.066) 0.19 (0.136) 2.12*** (0.763)
Density -0.01 (0.08) -0.27 (0.192) -2.39*** (0.878)
Expenditure 1.01 (0.769) 3.85*** (1.126) 7.08** (3.260)
Subsidies -0.05 (0.252) 0.04 (0.484) 0.89 (1.252)
Wage -8.03*** (2.297) -16.66*** (3.297) -27.29*** (8.213)
Number of observations 1920 1920 1920
Number of groups 480 480 480
Wald test all spatial terms 50.79*** 45.52*** 26.07***
Wald test Ho: (wX’s=0) 36.56*** 42.78*** 23.39***
SAR vs SDM
Wald test Ho: ( = -) 57.37*** 48.44*** 25.63***
SEM vs SDM
AIC criteria SDM: 16070.4 SDM: 16075.51 SDM: 16101.68
SDM vs SAC SAC: 16114.86 SAC: 16115.12 SAC: 16113.08
BIC criteria SDM: 16325.8 SDM: 16331.27 SDM: 16357.44
SDM vs SAC SAC: 16337.27 SAC: 16337.52 SAC: 16335.48
Note: For expositional convenience coefficients on indices of local development, county and dummy variables
are not presented. Standard errors in parentheses. ***,** and * denote significance at 1%, 5% and 10% levels.
County, year and development index dummy variables included.
5. Concluding remarks
The objective of our paper was to explore one crucial aspect of digital transformation, the
impact of improvements to digital infrastructure, measured as broadband speed on entry of
firms in digitally intensive sectors of an advancing, efficiency-driven economy, using the case
of Croatia. A unique dataset containing information on firm entry and broadband speed for the
18majority of Croatian LGUs was compiled for this purpose. The results of the benchmark
random effects panel data model suggest that, on average, a 10 percent increase in broadband
speed over the analysed period paved the way for the entry of 379 new firms in digitally
intensive sectors in Croatia. The effects are highest when complemented with investments in
physical infrastructure and when occurring in densely populated areas with a high level of
human capital. To this end, our findings are consistent with those reported by other authors for
advanced economies. Moreover, the beneficial effects are not limited within the LGUs, but
also create spatial spillovers to neighbouring cities and municipalities.
Our findings call for greater investment in digital infrastructure. . This is not just
because Croatia is lagging behind other EU countries in this respect, but also because the
analysis presented here suggests that considerable benefits of such investments can be reaped
by local economies and local entrepreneurs interested in starting digitally intensive companies.
As mentioned above, our findings also suggest that improvements in digital infrastructure alone
are not enough to stimulate stronger development of the digital economy in sparsely populated
areas with low levels of human capital and limited potential for public investment. This, in
turn, necessitates a broader combination of measures both from central and local governments
aimed at ensuring adequate quality and quantity of labour supply, public infrastructure and
administrative services. In addition, LGUs interested in establishing themselves as digital
economy hubs should aim to develop a comprehensive strategic framework to lay the
groundwork for key enabling technologies such as broadband infrastructure to yield stronger
and more lasting effects.
In this context, the Croatian government can take advantage of the EUR 9.2 billion
Digital Europe programme proposed by the European Commission for 2021–2027 Multiannual
Financial Framework aimed at fostering strategic digital capacities and facilitating the wide
deployment of digital technologies in EU Member States. Moreover, for remote areas to catch
19up with advanced parts of country on the wings of digital transformation incentives should be
provided for private investors in digital infrastructure as administrative and financial obstacles
to digital infrastructure developments in Croatia are among highest in Europe.
Our research provides the first assessment of the impact of broadband speeds on firm
entry in Croatia and is the first to address the interactions and spatial effects of this process.
While comprehensive, the research is not without its limitations. Its focus is on effects on firm
creation, though future research should also explore how broadband infrastructure influences
firm growth and survival. Another avenue worth pursuing concerns the effects of education
and other measures of entrepreneurial system such as entrepreneurial zones. Subject to data
availability, future research could also explore the effects of broadband infrastructure on
organisational changes within enterprises, as digitally intensive firms typically have more
hierarchical organizational structure.
References
Autor, D.H. (2001). Wiring the Labor Market. Journal of Economic Perspectives, 15, 25–40.
Available at: https://www.aeaweb.org/articles?id=10.1257/jep.15.1.25.
Belotti, F., Hughes, G. & Mortari Piano, A. (2017). Spatial Panel Data Models Using Stata.
The Stata Journal, 17(1), 139-180. https://doi.org/10.1177/1536867X1701700109
Borenstein, S., & Saloner, G. (2001). Economics and Electronic Commerce. Journal of
Economic Perspectives. 15, 3–12.
Available at: https://pubs.aeaweb.org/doi/pdf/10.1257/jep.15.1.3.
20Calvino, F., Criscuolo, C., Marcolin, L., & Squicciarini, M (2018). A taxonomy of digital
intensive sectors. OECD Science, Technology and Industry Working Papers, No. 2018/14,
OECD Publishing, Paris.
Available at https://doi.org/10.1787/f404736a-en.
Czernich, N., Falck, O., Kretschmer, T., & Woessmann, L. (2011). Broadband Infrastructure
and Economic Growth. Economic Journal, 121, 505-532.
doi: 10.1111/j.1468-0297.2011.02420.
Elhorst, J. P. (2014). Spatial panel data models. In Spatial econometrics (pp. 37-93),
Springer, Berlin, Heidelberg.
Grubesic, T.H., & Murray, A.T. (2002). Constructing the divide: spatial disparities in
broadband access. Papers in Regional Science, 81, 197-221.
doi: 10.1007/s101100100096.
Grubesic, T.H., & Murray, A.T. (2004). Waiting for broadband: local competition and the
spatial distribution of advanced telecommunication services in the United States. Growth and
Change, 35, 139-165.
doi: 10.1111/j.0017-4815.2004.00243.x.
Grubesic, T.H., & O’Kelly, M.E. (2002). Using points of presence to measure city
accessibility to the commercial Internet. Professional Geographer, 54: 259–278.
doi: 10.1111/0033-0124.00330.
21Jacobs, J. (1969). The Economy of Cities. Random House, New York.
Hasbi, M. (2019). Impact of very high-speed broadband on company creation and
entrepreneurship: Empirical Evidence. Telecommunications Policy, In Press, Available online
26 September 2019.
doi: 10.1016/j.telpol.2019.101873.
Kim, Y., & Orazem, P. (2017). Broadband Internet and New Firm Location Decisions in
Rural Areas. American Journal of Agricultural Economics, 99, 285–302.
doi: 10.1093/ajae/aaw082.
Kolko, J. (2012). Broadband and Local Growth. Journal of Urban Economics, 71, 100-113.
doi: 10.1016/j.jue.2011.07.004.
Institute of Economics, Zagreb (2020). Sektorska analize Telekomunikacije.
Available at:
https://www.eizg.hr/userdocsimages/publikacije/serijske-publikacije/sektorske-
analize/sa_telekomunikacije-2020.pdf.
Lamie, R.D., Barkley, D.L., & Markley, D.M. (2008). Positive Examples and Lessons
Learned from Rural Small Business Adoption of E-Commerce Strategies. UECD Working
paper, 12-2008-01.
Available at:
https://scholar.google.hr/scholar?hl=hr&as_sdt=0%2C5&q=Positive+Examples+and+Lesson
22s+Learned+from+Rural+Small+Business+Adoption+of+E-
Commerce+Strategies+Journal+of+Extension+&btnG=.
Lehr, W. H., Osorio, C., Gillett, S. E., & Sirbu, M. A. (2006). Measuring broadband's
economic impact”,
http://www.itu.int/net/wsis/stocktaking/docs/activities/1288616475/MIT_Carnegie.pdf
handle/1721.1/102779#files-area.
LeSage, J., & Pace, R. K. (2009). Introduction to spatial econometrics. Chapman and
Hall/CRC.
Mack, A. E. (2014). Businesses and the Need for Speed: The Impact of Broadband Speed on
Business Presence. Telematics and Informatics, 31, 617-627.
doi:10.1016/j.tele.2013.12.001.
Mack, A. E., Anselin, L., & Grubesic, T. H. (2011). The importance of broadband provision
to knowledge intensive firm location. Regional Science Policy & Practice, 3, 17-35.
doi: 10.1111/j.1757-7802.2011.01026.x.
Marshall, A. (1920). Principles of Economics. 8th edition ed. Macmillan and co., London.
McCoy, D., Lyons, S., Morgenroth, E., Palcic, D., & Allen, L. (2018). The impact of
broadband and other infrastructure on the location of new business establishments. Journal of
Regional Science, 58, 509–534.
doi: 10.1111/jors.12376.
23Sinai, T., & Waldfogel. J. (2004). Geography and the Internet: Is the Internet a Substitute or a
Complement for Cities?. Journal of Urban Economics, 56, 1–24.
doi: 10.1016/j.jue.2004.04.001.
Stojcic, N. & Orlic, E. (2020). Spatial dependence, foreign investment and productivity
spillovers in new EU member states. Regional Studies, 54(8), 1057-1068.
doi:10.1080/00343404.2019.1653451
APPENDIX
1. The dataset
The analysis utilises several sources of data to explore how improvements in broadband speed
facilitate the birth of new firms in these sectors. Our principal source of data is the firm database
of the Croatian Financial Agency (FINA) for the period 2014–2017. The database provides
financial information and a number of firm characteristics such as location (in terms of the
LGU where the firm is established), sector and date of birth of Croatian enterprises. All firms
are required to submit their annual reports to FINA, meaning that we are effectively dealing
with an entire population of enterprises. This is another added value of our research.
Another source of data is information obtained from Hrvatski Telekom (Croatian
Telecom) on the average broadband speed available at the LGU level in each of the analysed
years. Croatian Telecom is the largest Internet provider in Croatia. Its infrastructure is used for
access to end users by the majority of other providers in Croatia. Average broadband speeds
are calculated for each year, meaning that this study uses the most reliable nation-wide source
of information on broadband speeds in Croatia. By combining these two sources of data we are
able to construct a unique database and, for the first time, to perform an analysis of the impact
of improvements in speed of broadband on economic outcomes.
The data from FINA are available on all Croatian LGUs while the information on
average available broadband speeds can be obtained only for 480 of 556 LGUs. The LGUs for
which data on broadband speeds are not available are mainly small municipalities with little or
no economic activity. Bearing this in mind we can state that our analysis covers 86% of all
LGUs distributed across the country.
Several other data sources were additionally consulted. The distance of each
municipality from county administrative centre was calculated by the authors using Google
Maps data. Population density data was taken from Croatian Bureau of Statistics (DZS), while
information on public expenditure on material assets for municipalities was provided by the
Croatian Ministry of the Economy and Sustainable Development (MINGO). Data on
development index levels for each city or municipality was taken from the Croatian Ministry
of Regional Development and EU Funds (MRRFEU). This index is a composite indicator
calculated from data in six categories: average income per inhabitant, average generic revenues
per inhabitant, average unemployment rate, fluctuation of population, tertiary education of
24inhabitants and ageing index. On the basis of the index values, each LGU is assigned to one of
eight development categories. Our categorical variables correspond to these development
levels.
Table A1 provides the descriptive statistics for the main variables. For expositional
convenience, descriptives are not presented for year, county and development index dummy
variables.
Table A1: Descriptive statistics
Variable Observations Mean Standard deviation Min Max
Entry 480 11.51 106.54 0 2594
Speed 480 24.03 10.28 7.3 94.4
Distance 480 36.98 28.33 1 207
Density 480 101.89 216.46 2.29 2965.01
Expenditure 480 6293 40979 1 886212
Subsidies 480 0.18 2.60 0 71.89
Wage 480 100 37.89 3.67 843.84
Note: Does not include development index, county and annual categorical variables.
Variables presented in original form even when they enter models as logarithms.
BRZINA ŠIROKOPOJASNOG INTERNETA I OSNIVANJE NOVIH PODUZEĆA U
DIGITALNO INTENZIVNIM SEKTORIMA
U članku se istražuje na koji način poboljšanja u digitalnoj infrastrukturi doprinose digitalnoj
transformaciji hrvatske ekonomije. Pri tome se fokusiramo na uvjete pri kojima poboljšanja u
brzini širokopojasnog interneta omogućavaju ubrzaniji ulazak novih kompanija u digitalno
intenzivne sektore. U tu svrhu istražujemo vezu između prosječne dostupne brzine
širokopojasnog interneta u jedinicama lokalne samouprave i osnivanja poduzeća u digitalno
intenzivnim sektorima u razdoblju od 2014. do 2017. Rezultati našeg osnovnog modela
sugeriraju da povećanje brzine od 10 posto korespondira s 0,68 novih poduzeća u prosječnoj
lokalnoj jedinici. Povećanjem udaljenosti od administrativnog središta smanjuje se broj
novoosnovanih digitalno intenzivnih poduzeća, dok veća gustoća naseljenosti i veća javna
ulaganja u infrastrukturu doprinose povećanju broja novoosnovanih poduzeća. Interakcije
među objašnjavajućim varijablama modela sugeriraju da poboljšanja u širokopojasnoj
infrastrukturi rezultiraju najvećim brojem novoosnovanih poduzeća u gusto naseljenim
lokalnim jedinicama, u lokalnim jedinicama s bolje obrazovanom radnom snagom i većim
javnim ulaganjima u infrastrukturu. Korištenjem prostornog Durbinovog panel-modela
nalazimo da poboljšanja u širokopojasnoj infrastrukturi utječu i na lokalne jedinice koje se
nalaze u susjedstvu lokalne jedinice koja bilježi navedena poboljšanja u širokopojasnoj
infrastrukturi.
25Ključne riječi: ulazak poduzeća, digitalno intenzivni sektori, širokopojasna brzina, digitalna
transformacija, Hrvatska, prostorna prelijevanja.
26You can also read