Privacy: Gone with the Typing! Identifying Web Users by Their Typing Patterns
←
→
Page content transcription
If your browser does not render page correctly, please read the page content below
Privacy: Gone with the Typing!
Identifying Web Users by Their Typing Patterns

              Prima Chairunnanda, Nam Pham and Urs Hengartner

                    David R. Cheriton School of Computer Science
                               University of Waterloo
                          Waterloo, ON, Canada N2L 3G1
                   {pchairun, npham, uhengart}@cs.uwaterloo.ca

        Abstract. The lack of privacy protection for Internet users has been
        identified as a major problem in modern web browsers. Despite poten-
        tially high risk of identification by typing patterns, this topic has received
        little attention in both the research and general community. In this paper
        we present a simple but efficient statistical detection model for construct-
        ing users’ identity from their typing patterns. Extensive experiments are
        conducted to justify the accuracy of our model. Using this model, online
        adversaries could uncover the identity of Web users even if they are us-
        ing anonymizing services. Our goal is to raise awareness of this privacy
        risk to general Internet users and encourage countermeasures in future
        implementations of anonymous browsing techniques.

        Keywords: Typing Pattern, Biometric, Privacy, Identity

1     Introduction
Among all the information, the personal information of users is being sought by
several third parties, such as advertisers and identity thieves. Even the simple act
of browsing inadvertently leaks a variety of information to the Internet. First,
HTTP cookies stored on the user’s computer can provide unique identifying
information about the user. Fortunately, most browsers allow user to delete
cookies, and a privacy-conscious user might choose to do so after every browsing
session. Second, the user’s IP can be used to infer user’s location up to several
hundred-kilometer accuracy [5]. A web proxy can provide a simple anonymizing
service, but to defend against more sophisticated network surveillance or traffic
analysis, the Tor network1 needs to be utilized.
    In spite of all these mitigation strategies, Eckersley was still able to uniquely
identify the majority of visitors to his website [3]. This technique, called “Browser
Fingerprinting”, uses HTTP header values and other information made avail-
able to Javascript. One possible workaround suggested is to activate the pri-
vate browsing mode offered by most modern browsers, effectively blocking some
information from being sent out. Recent research by Aggarwal et al. [1], how-
ever, showed several shortcomings of private browsing mode implementations on
1
    http://www.torproject.org
2 P. Chairunnanda, N. Pham, U. Hengartner
four major browsers. Furthermore, Fioravanti [4] demonstrated that even if the
browser spoofed the User-Agent and DOM information, intricate details about a
browser’s scripting environment were already sufficient to identify a user. Some
browser vendors have taken positive steps to address this issue; Mozilla has an-
nounced plans to close some information leakage to prevent fingerprinting [10].
It has to be noted that at least in the case of Mozilla, some types of informa-
tion leakage will not be closed due to its potential to provide an enhanced user
experience (e.g. timezone).
The above works focused on the information leakage coming from technology
and its implementation, but we would like to explore leakage coming from the
user him/herself. This can be compared to employing social engineering tactics
to attack a cryptosystem instead of directly attacking its implementation. We
foresee the rise of this kind of attacks in the near future, as attackers try to find
other ways to de-anonymize a user. Also, it has the advantage of being harder
to prevent: browser vendors could easily fix their browsers to close loopholes,
but they cannot “fix” their users. Some studies, such as [11], have indicated that
user education might be the most effective way to address social engineering.
To be more specific, we are looking at users’ typing pattern as the side-
channel information we want to exploit. Internet activities require users to do a
significant amount of typing, from entering his/her username and password in a
login screen, typing to answer chat messages, to editing an article on Wikipedia.
To improve user experience, many Web 2.0 websites immediately transmit any
key strokes entered by the user directly to the website (e.g., Google Instant). Al-
ternatively, a website could use Javascript to measure a user’s keystroke timings
while the user is filling in a form. These measurements will be sent to the website
at the same time when the form data is submitted. We hypothesize that typ-
ing pattern analysis can reveal a user’s identity to some extent. Combined with
information gained from other leakage sources, it can potentially de-anonymize
a user completely, regardless of the usage of private browsing mode, web prox-
ies, or other anonymizing networks. In this study, we verify that such weakness
exists, hence bringing attention to the security and privacy community.
1.1 Related Work
Using typing patterns to detect a unique user has been studied for a long time.
The Allies in World War II developed a technique based on Morse code to distin-
guish their real operators from those pretending to be on their side [13]. This kind
of techniques have been more formally researched since the 1980s, as mentioned
in the comprehensive survey article by Peacock et al. [12]. Monrose and Rubin [9],
for example, studied the keystroke dynamics, or typing rhythm pattern, as a bio-
metric for authentication. Their classifiers were able to authenticate a user with
an accuracy of 83.22% to 92.14%. Clarke and Furnell [2] further extended au-
thentication using keystroke analysis to mobile devices. Though, mobile devices
have inherently different usage patterns from normal computer keyboards; for
example, phone numbers are frequently typed in, and some devices (includingPrivacy: Gone with the Typing 3
the one used in their experiment) require users to press a key several times to
produce a character.
In another study, Song et al. [14] were able to develop a Hidden Markov Chain
Model based on inter-keystroke timings of users’ typing during an SSH session
to recover a significant amount of information on their passwords. Leggett and
Williams [8] also performed an experimental evaluation of keystroke authentica-
tion utilizing various kinds of filters. However, most of the above researches re-
quire the user to type several pairs of characters repeatedly (30-40 times in [14]).
In [8], users were asked to enter the same prose twice, the first one for profile
creation, and the second one for testing. This approach might work in the case
of authentication as the user must type the same pair of username and pass-
word every time, but it is unrealistic in the context of general Internet usage. To
post the same paragraph on two different forums, for instance, a user could just
post a URL referring to the first forum, or even simpler, copy-paste the whole
paragraph content.
Various aspects of a user’s typing pattern can be used for analysis, such
as: digraph, trigraph, and tetragraph latencies (interval between two, three, and
four successive characters) [8], overall typing speed, error frequency, and key-hold
time [7]. We primarily use digraph latency information in our model, however it
can be extended to consider the other aspects mentioned earlier. The problem
of how best to aggregate information from different aspects is out of the scope
of this paper, and we leave it for future work.
1.2 Contributions
Compared to previous studies, which focused on authentication, our study puts
typing pattern analysis in a different light: to identify a user in the otherwise
anonymous context of the Internet. The problems of authentication and iden-
tification are closely related, but they are not the same. In the authentication
setting, the system typically knows which user is trying to authenticate, for ex-
ample by means of a username. Also, the user is actively trying to pass the
authentication in order to get some privileges reserved only for authenticated
users. Contrast this with our identification scenario: the users are not aware
that they are being profiled, and the system is trying to uncover who they are
by searching over a set of known typing patterns.
With this paper, we make the following contributions: first, we show that
keystroke dynamics can be easily harvested on webpages without the user being
any wiser about such activity. Next, we devise a model in order to demonstrate
that analysis of some keystroke dynamic features can identify a user with high
accuracy rate. Finally, by analysing the method by which we collected the typing
patterns, we are also able to outline several countermeasures to mitigate the
problem.
This paper is organized as following: we will briefly describe the threat model,
followed by an introduction to our statistical model for analyzing and detecting
the typing dynamics of different users in Sect. 2. Our experiments and results4 P. Chairunnanda, N. Pham, U. Hengartner
are presented in Sect. 3. We propose several mitigation strategies to the problem
in Sect. 4. Finally, in Sect. 5 we give our conclusions and future directions.
2 Our Model
To verify our hypothesis, we started by exploring techniques for detecting typing
patterns based on the time difference between two keystrokes (digraph latency).
2.1 Threat Model
In our setting, the typing pattern of each user is the main asset of interest to
attackers. However, constructing a unique pattern for each individual requires
a significant amount of sample data. In order to achieve it, the attacker could
be a single powerful attacker who has frequent access to users typing on the
Internet, such as a search engine or an email service provider. A collaboration
effort among a group of attackers is also possible if each individual attacker
knows the identity of the user. For example, advertisers might be willing to buy
partial typing patterns of users from different sources and then combine them
to use against anonymous browsing sessions.
2.2 System Model
The threat that we demonstrate in this paper is unlikely to affect all Internet
users. In particular, it is unlikely to affect people who care about privacy to a
great degree and who already, for example, use Tor for all their browsing or who
have Javascript disabled in their browser. Instead, the threat mainly concerns
the (probably larger) set of people who care about their privacy while browsing
the web, but are willing to trade off privacy for usability and performance. For
example, these users have their browsers accept cookies and have Javascript
enabled since otherwise many web sites simply would not work. On the other
hand, these users have their browser delete all cookies at the end of a browsing
session. Also, they may use Tor in cases where it is really important to remain
anonymous (e.g., while entering a particularly sensitive Google search query),
but they do not use Tor for their everyday web surfing due to performance
reasons. They also use their browser’s private browsing mode (or an extension
of it since current implementations have been shown to be vulnerable [1]) to
prevent a website from learning their detailed browser/OS fingerprint. Finally,
they use an ISP that employs NAT to assign the same IP address to multiple
users, which makes it difficult for a website to track a particular user based on
IP address. (If NAT is not available, the users could use a simple proxy instead.)
Due to these measures, in particular due to the last one, a user can arguably
expect to remain anonymous among dozens or maybe even hundreds of users,
for example, while making a Google query.2 Unfortunately, as we demonstrate
in this paper, this expectation is overly optimistic.
2
Of course, this assumes that the user does not log in to Google. Otherwise, all bets
are off.Privacy: Gone with the Typing 5
2.3 Notations and Definitions
We introduce several notations in our model:
– X - a set of observations of a user’s typing timestamps
– TX [a][b] - the list of observed digraph latencies, or the time difference in
milliseconds, between two characters a and b.
For example, TX [‘e’][‘r’] =< 69, 75, 85, 90, 94 > means that in observation
X, the user typed the pair (‘e’,‘r’) five times.
– DX = {(a, b)|length(TX [a][b]) ≥ β} - the dimension, or set of character
pairs in observation X with no less than β data points. The value β is the
Minimum Data Points (MDP) parameter of our model, which controls the
minimum number of observations required for a character pair in order to
be included in our calculation. We set β = 5 for now, and we will discuss
the effect of this parameter in Sect. 3.5.
For example, given TX [‘e’][‘r’] =< 69, 75, 85, 90, 94 >,
TX [‘a’][‘n’] =< 94, 94, 101, 132, 146 >, TX [‘i’][‘t’] =< 87, 89, 101, 134 >,
TX [‘e’][‘s’] =< 75, 79, 83, 89, 93, 99 >, then DX = {(‘a’,‘n’), (‘e’,‘r’), (‘e’,‘s’)}
– DX,Y = Dx ∩ Dy - The shared dimension between observation X and obser-
vation Y , where the observations might be made on the same or a different
person.
For example, given DX = {(‘a’,‘n’), (‘e’,‘r’), (‘e’,‘s’)} and
DY = {(‘a’,‘r’), (‘e’,‘r’), (‘e’,‘s’), (‘o’,‘n’)}, then DX,Y = {(‘e’,‘r’), (‘e’,‘s’)}
– kP k - The size of a collection P (can be a set or a list)
2.4 The Detection Model
In our model, we rely on the Kolmogorov-Smirnov test (K-S test) to determine
if two observations X and Y belong to a same user. We define KS(P, Q) to be
the probability that P and Q are samples from the same distribution based on
the Kolmogorov-Smirnov test. In our setting, we make an assumption that the
latency between every character pair is independent of those of other pairs. This
assumption allows us to approximate the likelihood that X and Y are sample
data from one user as:
Y
KS(TX [a][b], TY [a][b]) (1)
(a,b)∈DX,Y
However, this score has several problems. First of all, notice that KS(P, Q) is a
probability, thus its value has the range [0,1]. It is therefore theoretically possible
for the value to be 0, especially if kTX [a][b]k or kTY [a][b]k for some pair (a, b)
is relatively small. Unfortunately, the overall product will then be 0, regardless
of the values of the KS() function for other pairs in DX,Y . We need to limit
the effect of a mismatch, so that it does not penalize our likelihood function too
much. We do this by introducing the Minimum Sampling Correlation (MSC)
parameter α. Hence our likelihood function L(X, Y ) is defined as follows:
Y
L(X, Y ) = max(KS(TX [a][b], TY [a][b]), α) (2)
(a,b)∈DX,Y6 P. Chairunnanda, N. Pham, U. Hengartner
where 0 ≤ α ≤ 1. While α can be as high as 1, it is worth mentioning that
normally we do not want α to be too high such that it is too forgiving on
matching failures. In our experiments, we set α = 0.001 unless noted otherwise.
The second problem stems from the fact that the sizes of X and Y are not
equal and different pairs of (X, Y ) potentially have different shared dimensions.
Since KS(TX [a][b], TY [a][b]) is in the range [0, 1], the more terms you multiply
together, the smaller the value becomes. Consequently, L(X, Y ) then becomes
predominated by kDX,Y k rather than the amount of information they share.
In order to solve these problems, we introduce a new improved similarity score
function:
log(L(X, Y ))
score(X, Y ) = (3)
kDX,Y k
The range of the similarity score is heavily influenced by the KS(P, Q) values.
The highest possible score is 0, which occurs when all KS(P, Q) return 1 (i.e.
P and Q are sampled from the same distribution based on the K-S test). On
the other end, the lowest possible score occurs when all KS(P, Q) return 0 (i.e.
P and Q have no chance of being sampled from the same distribution based
on the K-S test). When this happens, L(X, Y ) will evaluate to αkDX,Y k , and in
consequence, score(X, Y ) = log(α).
We can then conclude that the value of score(X, Y ) has the range of [log(α), 0]
(from ‘totally different’ to ‘exactly the same’). Note that when α = 0, the range
of the similarity score will be (−∞, 0].
3 Experiment
We seek to answer the following questions:
1. Can we accurately match each user’s typing pattern to his/her profile?
2. Can we accurately identify a new user whose typing pattern does not exist in
our set of profiles?
3. Can we accurately match typing patterns of a user collected at different times?
4. What are the effects of parameters Minimum Sampling Correlation (MSC)
and Minimum Data Points (MDP) on our model?
3.1 Experiment Setup
We recruited 36 participants through mailing lists and personal invitations. All
participants are frequent Internet users. The participants were asked to visit a
website we set up to collect typing patterns3 . All experiments were conducted
exclusively through this online website, and participants could view full infor-
mation about the study before agreeing to take part.
In the experiment, each participant was asked to retype a randomly selected
sequence of English words from a database of 1340 words. These words were
3
This study has received approval from the Office of Research Ethics at University of
Waterloo (ORE# 16814)Privacy: Gone with the Typing 7
chosen from the top 1000 Internet search terms as ranked in [6]. We used Internet
search terms as our basis because we felt that those words would be more likely
to be familiar to the participants. Some words that we found to be unfamiliar
or inappropriate were also filtered out. While typing, the timestamp of each
keystroke was collected by means of Javascript. Once the Enter key was pressed
to signify completion, the timing data was sent to our website together with the
actual text typed by the participant.
This setup mimics exactly how we imagine our attacker to be. The user types
some texts in an innocent-looking textbox, and without his/her knowledge, the
typing pattern is collected and sent out as part of the form submission data.
There is no additional round of communication involved to avoid rousing users’
suspicion, although with AJAX becoming more popular nowadays, users might
be led to believe the extra communication is part of the interactivity system to
provide better customer experience. Ironically, in our putative scenario the extra
communication is actually for a completely opposite purpose.
There were two different phases in our study. There was no difference in the
conduct of the experiment between the two phases; only the amount of data
gathered differed. For the first phase, each participant was asked to do 20 trials,
each consisted of entering 50 characters on average. 28 participants took part in
the first phase.
We invited 13 participants to take part in the second phase, 5 of whom took
part in the first phase. This phase was conducted several days after the first
phase on a different website URL. The task given was exactly the same as in the
first phase, but there were 50 stages, consisting of entering 100 characters each.
Therefore, for each participant, we collected approximately five times as much
data from the second phase as from the first one.
For clarity, we will use the following convention to refer to our participants.
Participants who took part in the first phase are each assigned a unique number
from 1-28. Those taking part in the second phase are each assigned a unique
character from A-L. For the five participants who did both phases, we will use
numbers to refer to their typing pattern collected during the first phase, and
characters to refer to their typing patterns collected from the second phase. The
number-to-character pairings for those five are: {(22, A), (19, B), (18, C), (9,
D), (2, J)}.
3.2 Model Accuracy
We would like to answer the first question posed regarding the accuracy of our
model. We created a custom-made Java application to digest the typing tim-
ing information and compute the similarity score between two typing timing
patterns. The Java Statistical Classes (JSC) library4 is used to conduct the
Kolmogorov-Smirnov test. We then conducted 5-fold validation on the data ob-
tained from the second phase of the experiment. Unfortunately, we found that
data from one participant was corrupted, therefore we could only work with the
4
http://www.jsc.nildram.co.uk/8 P. Chairunnanda, N. Pham, U. Hengartner
remaining 12. The validation showed that our model gave the highest similarity
score to the participant from whom the training set was built. All 5 validation
runs return similar results, and one of them is depicted in Fig. 1.
In Fig. 1, the triangles denote the best similarity score for each participant’s
data, while the bars represent the range of other similarity scores. It can be seen
from the figure that there is a significant difference in the similarity score between
the best match (µ=-0.85, σ=0.17) and the other candidates (µ=-3.90, σ=1.09).
The difference is still significant even when we compare it only against the next
best match (µ=-2.19, σ=0.45). The lowest similarity score achieved for a correct
match is -1.06 for participant G, but the next best match scored nearly thrice
at -3.10. The highest similarity score for an incorrect match is -1.63 between
participant B and D, but then the correct match for participant B scored only
half of it at -0.83. Overall across the board, our model can easily distinguish
a correct match from the incorrect one. We realize that the difference in score
might be less significant on a bigger scale involving thousands of participants,
resulting in several close matches. Other traditional detection methodologies (e.g.
IP address, browser’s User-Agent, etc) can then be used to refine the results to
reveal the actual user.
Fig. 1. Similarity scores for 12 second phase participants. A score closer to 0 means a
better match. The triangles indicate the best score, while the bars represent the range
of other scores for each participant. The top of the bar, therefore, can be seen as the
next-best score. We can see a significant difference between the best and the next-best
score across all participants.Privacy: Gone with the Typing 9
3.3 New User Identification
We are then interested in knowing if our model could identify a new user whose
typing pattern has never been profiled before. We cannot simply take the highest
similarity score as our “correct” match: this could be an entirely new user. In
reality the importance of this capability really depends on the adversary and
his/her goal for user identification in the first place. An adversary whose goal
is to track the activity of a group of anonymous users in a forum, for example,
needs to be able to accurately distinguish those users from other website visitors.
However, if the goal is just to show advertisements tailored for a specific user, it
will not matter as much. Any advertisement can be shown to the new user, so
it does not make a difference whether it was tailored or picked at random.
The problem of new user identification can be seen as a classification prob-
lem with two classes: existing users, and new users. For simplicity, we used the
similarity score as the only feature considered, and performed the classification
based only on whether the score exceeds a threshold value τ . For the purpose of
our experiment, we selected the threshold value by empirical observation from
the previous experiment. We chose the mid-point between the lowest similarity
score for a correct match (-1.06) and the highest similarity score for an incorrect
match (-1.63), yielding a threshold value τ = -1.345. We admit that this may
not be the best threshold selection method, but given the limited data points
we have, we choose to leave threshold selection analysis as future work.
We started by creating profiles for the 12 participants of the second phase
study, using random selection of 4000 out of 5000 character data. The reason for
this is because we wanted to make the similarity score comparable to the ones in
Fig. 1. Recall that in each iteration of 5-fold cross validation, four-fifths of the
data set is used as training set to validate the remaining one-fifth.
Afterwards, the typing patterns collected from the first phase were compared
against the 12 profiles. Note that only 23 out of 28 typing patterns were used for
this experiment, because the remaining 5 were also participants of the second
phase, thus they are not new users. The best similarity score for 10 of the 23
new users are shown in Table 1 ordered by the scores. The remaining 13 have
worse best score than the lowest shown in the table, and we purposely omit
them for clarity. As can be seen from the table, not even the largest score passes
the threshold value τ and our model correctly identifies all new users. In other
words, there were no false-positives during our experiment.
3.4 Matching Typing Pattern Collected at Different Times
Another point which comes to mind is to see if a user’s typing pattern is iden-
tifiable over time. We acknowledge that there will be variance when a user uses
different input methods (e.g. keyboard vs. stylus) or even when different key-
board layouts are used. These aspects warrant a further detailed study on its
own, but for now we would like to focus on something much more fundamental.
That is, given a set of user profiles obtained from an observation, can we still
correlate a user’s typing pattern observed at a different time to his/her profile?10 P. Chairunnanda, N. Pham, U. Hengartner
Table 1. Best similarity scores for 10 new users
Participant ID Best Match Similarity Score
21 D -1.62
12 J -1.66
5 F -1.76
27 D -1.83
14 E -1.90
16 L -1.93
15 G -2.08
25 H -2.14
4 D -2.17
7 J -2.18
To answer this question, we used the data of five users who did both phases of
the experiment. We started with the 12 profiles we had created for the previous
experiment. Recall that we also had data of those five users from the first phase,
and this data was never considered in the creation of the profiles. We emphasize
that there were several days of gap between the first and the second phase.
From there, we wanted to see if our model could match those five users to their
corresponding profiles.
We found that we could successfully match 4 out of 5 users to their profile,
while the remaining one was detected to be a new user based on the threshold τ
we set earlier. This result is shown in Table 2. One participant specifically told
us that she did not think we could correlate her typing pattern because she was
very tired and made a lot of mistakes in the second phase, but it turned out we
could still match her correctly.
We also investigated the only participant whose typing pattern failed to be
matched to his profile. His typing pattern similarity score of -1.655 was quite
good but still below the threshold. We manually checked the data we gathered
from this participant, and we were surprised to find that there were noticeably a
lot of typing errors made in his second phase experiment. This could be because
of the length of the experiment, or perhaps the participant tried to induce some
noise into the data. Nevertheless, we are encouraged by the fact that our model
could identify 4 out of the 5 participants, and even the one with a large number of
errors still got relatively good similarity score albeit it was below the threshold.
3.5 Effect of Model Parameters
Our similarity score model depends on two important parameters: the Minimum
Sampling Correlation α, and the Minimum Data Points β. We initially set each
parameter to a value that we estimated to be “sufficiently useful” to fulfill its
intended purpose. In this subsection, we strive to explore the effect of these values
on the accuracy of our model. We refer a discussion of the threshold parameter
τ to future work. Recall that the threshold τ is used by our simple classifier to
differentiate between new users and existing users. A more elaborate classifier,Privacy: Gone with the Typing 11
Table 2. Classification results for the 5 users who did both phases, using their first
phase data against their second phase data
Participant Best Similarity New User/ Correct?
ID Match Score Existing?
9 D -0.699 Existing Yes
22 A -1.182 Existing Yes
19 B -1.190 Existing Yes
18 C -1.206 Existing Yes
2 J -1.655 New No
though, may take more features into account, such as the dimensionality used to
produce the score, or the history of the similarity score from previous matches.
As we have discussed in Sect. 2.4, we introduce the MSC parameter α to limit
the effect of a mismatch on one dimension to the other dimensions. Also, α has
the side effect of providing the lower limit of the similarity score function. When
α is 0, score(X, Y ) may evaluate to −∞ which may not always be suitable for
plotting or further processing. Table 3 shows the similarity score values between
selected pairs when α is 0.001 and 0. Introducing MSC also allows us to deduce
some information which would have been lost otherwise. Had we set α = 0, we
could only say that participant 28’s typing pattern does not match profile E and
G. However, setting α = 0.001 reveals that participant 28’s typing pattern is
significantly closer to E than to G.
Table 3. Effects of MSC value α on similarity scores between selected pairs
Participant ID Profile ID Similarity Score
α = 0.001 α = 0
E -4.45 −∞
3 F -5.71 −∞
G -3.10 -3.64
E -3.66 -4.69
8 F -3.30 -4.05
G -4.91 −∞
E -3.84 −∞
28 F -2.18 -2.35
G -5.50 −∞
Our model also depends on the MDP parameter value β, which filters out
dimensions containing too few data to be useful. Some pairs of characters occur
very infrequently in words, and inevitably they cannot be considered for pro-
cessing. In particular, the Kolmogorov-Smirnov test may not be meaningful if
there are too few data to compare. We now would like to see if varying β will
have an impact on accuracy. For the purpose of this experiment, we use data12 P. Chairunnanda, N. Pham, U. Hengartner
from the 12 participants of the second phase. We performed 5-fold validation for
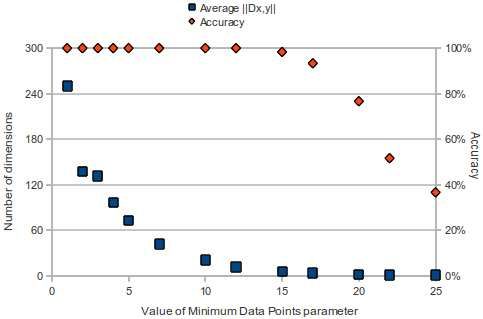
different values of β, and the result is depicted in Fig. 2.
With the profiles from 12 participants, we can see that the precision starts
to drop between β values of 12 and 15. It deteriorates rapidly with only around
75% accuracy for β=20, and 35% for β=25. We then look at the number of
dimensions being used to calculate the similarity score. We can clearly see that
the number of dimensions being considered starts with 250 for β=1, then drops
nearly half when we increase β to 2, and only around 20 for β=10. This shows
that a big portion of the dimensions have only few data points. In spite of this,
the distribution of samples from other dimensions is still enough to accurately
identify a user’s typing pattern. Only when there are too few dimensions to
explore does the model start to be inaccurate (there are only 12 dimensions
considered for β=12).
Fig. 2. The effect of MDP parameter β on average kDX,Y k and overall accuracy. In-
creasing β past a certain point brings down accuracy considerably.
4 Countermeasures
We have shown through experiments that users’ typing pattern can be efficiently
collected and used to identify the user again. Fortunately, the user is not com-
pletely defenseless. We have identified several ways using which the risk can be
mitigated.
First, a user might simply alter his/her typing pattern, or introduce random
noise as one participant in the second phase might have done. That particular
participant was able to marginally avoid our detection, but more noise is required
to completely avoid detection. This may be difficult to do in all circumstances,Privacy: Gone with the Typing 13
but the user only needs to do this when he/she needs anonymity with respect
to the content of the text. Another variation of this is to combine keystrokes
with cursor movements. For example, a user can write a word omitting several
middle characters, then use the mouse and/or arrow keys to go to the middle of
the word and fill in the remaining characters. This method, however, is very time
consuming and may not be very applicable if the user needs to write a whole lot
of texts.
Disabling Javascript can certainly beat our data collection system, but web-
sites have grown from simple content providers to become a platform. AJAX
plays a big role for increased interactivity on websites, and more and more ap-
plications are delivered over the Internet as a webpage. Therefore, we felt that
this approach is not feasible.
The simplest and perhaps the most effective way is for the user to write the
texts with a separate program, such as a text editor, and then paste the text
into the browser window. Assuming that there is no keylogger or spyware on the
user’s computer collecting the typing pattern, this method is foolproof. However,
this requires that the user knows that he wants to protect his anonymity before
he even started writing. If the user has written half-way in the browser, then
writes the other remaining half in a text editor, the collected timing information
might still reveal the user’s identity.
Modern browsers becoming more open and offering more ways for customiza-
tion provides another countermeasure. We could develop a Firefox extension that
automatically scrambles the timing of keystrokes as user enters the text. The
copy-and-paste approach can also be employed – when the user clicks on a text
box, the extension could overlay another textbox on top of it. Once focus moves
to another element, the text is pasted into the actual textbox below, and the
overlay is removed. This way, it will be almost seamless to the user.
5 Conclusions
Broadly, our paper made the following contributions: First, we analyzed the feasi-
bility of identifying web users by their typing patterns. Based on the Kolmogorov-
Smirnov test, we constructed a new statistical detection model, and used it to
measure the similarity between the keystroke dynamics of two web users.
Additionally, we demonstrated the accuracy of our detection model by con-
ducting an extensive set of experiments with real typing statistics of 35 par-
ticipants. The participants were asked to type several English sentences on our
website at their normal typing speed. Our detection model was able to accu-
rately identify both existing users and new users. The results confirmed our
initial hypothesis that we could use typing pattern as a mean to de-anonymize a
user. These findings further suggested the existence of yet another side-channel
attack to privacy on the Internet. Several countermeasures to this problem were
also proposed and discussed.14 P. Chairunnanda, N. Pham, U. Hengartner
6 Future Work
At the current stage, we have done a pilot test for our model with a small num-
ber of participants. We are conducting a larger-scale experiment with hundreds
of participants. We are also examining other aspects of typing patterns, espe-
cially the trigraph latency and key-hold time. While we used digraph latency
for our experiments, a combination with other aspects might produce higher
identification accuracy.
There are also several directions for future works. First of all, in the current
implementation, we use the Kolmogorov-Smirnov test to calculate the probabil-
ity that two typing patterns belong to a same person. It would be interesting
to apply other methods, such as Hidden Markov Models or Support Vector Ma-
chines to calculate the similarity score. Second, even though our detection model
is able to detect accurately a user whose typing profile has been collected before,
it still has to rely on a good choice of threshold τ to detect a new user. In our
experiments, we were able to heuristically pick a value for τ based on empirical
observations and use it to separate new users from existing users. However, we
feel it is desirable to have a more structured and elaborate approach to distin-
guish the two.
It would be interesting to use our detection model in practical applications,
such as authentication or theft prevention. For example, it could be developed
as a security software running on background. If an unauthorized user tries to
use the computer, his typing patterns could reveal his identity, hence logging out
the session. It could also be developed into an optional plugin to email accounts,
where illegal access by a third party could be prevented.
References
1. G. Aggarwal, E. Bursztein, C. Jackson, and D. Boneh. An analysis of private
browsing modes in modern browsers. USENIX Security ’10, Washington, D.C.,
USA, 2010.
2. N. L. Clarke and S. M. Furnell. Authenticating mobile phone users using
keystroke analysis. Int. J. Inf. Secur., 6, December 2006.
3. P. Eckersley. How unique is your web browser? Technical report, Electronics
Frontier Foundation, 2009.
4. M. Fioravanti. Client fingerprinting via analysis of browser scripting
environment. Technical report, 2010.
5. F. Holzhauer. IP geolocation. Technical report, TU Berlin, 2007.
6. HowRank. Top 1000 internet search terms.
http://www.howrank.com/top-1000-internet-search-terms.php.
7. J. Ilonen. Keystroke dynamics. Advanced Topics in Information Processing, 2003.
8. J. Leggett and G. Williams. Verifying identity via keystroke characteristics. Int.
J. Man-Mach. Stud., 28, January 1988.
9. F. Monrose and A. D. Rubin. Authentication via keystroke dynamics. CCS ’97,
Zurich, Switzerland, 1997.
10. Mozilla. Fingerprinting. Technical report, 2010.Privacy: Gone with the Typing 15
11. G. L. Orgill, G. W. Romney, M. G. Bailey, and P. M. Orgill. The urgency for
effective user privacy-education to counter social engineering attacks on secure
computer systems. CITC5 ’04, Salt Lake City, UT, USA, 2004.
12. A. Peacock, X. Ke, and M. Wilkerson. Typing patterns: A key to user
identification. IEEE Security and Privacy, 2:40–47, 2004.
13. J. Richards. Security at your fingertips. Technical report, 2007.
14. D. X. Song, D. Wagner, and X. Tian. Timing analysis of keystrokes and timing
attacks on SSH. USENIX Security ’01, Washington, D.C., USA, 2001.You can also read