Kidney360 Publish Ahead of Print, published on February 19, 2021 as doi:10.34067/KID.0007452020
←
→
Page content transcription
If your browser does not render page correctly, please read the page content below
Kidney360 Publish Ahead of Print, published on February 19, 2021 as doi:10.34067/KID.0007452020

        Electrolyte Changes in Contemporary Hemodialysis: A Secondary Analysis of the
                                 Monitoring in Dialysis (MiD) Study

    Simon Correa*1,2, Katherine Mikovna Scovner*1,2, James A. Tumlin3, Prabir Roy-Chaudhury4,
    Bruce A. Koplan5, Alexandru I. Costea6, Vijay Kher7, Don Williamson8, Saurabh Pokhariyal9,
    Candace K. McClure10, Finnian R. Mc Causland†1,2; David M. Charytan†11, on behalf of the MiD
    investigators and Committees12

    1
      Renal Division, Department of Medicine, Brigham and Women’s Hospital, Boston, MA, USA.
    2
      Harvard Medical School, Boston, MA, USA.
    3
      NephroNet Clinical Research Consortium, Atlanta, Georgia, USA
    4
      UNC Kidney Center, Chapel Hill, NC and WG (Bill) Hefner VA Medical Center, Salisbury, NC
    5
      Cardiology Division, Department of Medicine, Brigham and Women’s Hospital
    6
      University of Cincinnati School of Medicine, Cincinnati, Ohio, USA
    7
      Medanta Kidney & Urology Institute, Medanta The Medicity, India
    8
      Southeastern Clinical Research Institute, Augusta, Georgia, USA
    9
      Manipal Hospital, New Delhi, India
    10
       NAMSA, Minneapolis, Minnesota, USA
    11
       New York University School of Medicine and NYU Langone Medical Center, New York, NY
    12
       See Appendix for list of investigators and committees

    *Dr. Correa and Dr. Scovner contributed equally to this manuscript as first authors.
    †
     Dr. Charytan and Dr. Mc Causland contributed equally to this manuscript as senior authors.

    Address for Correspondence:
    Simon Correa, MD, MMSc
    Division of Renal Medicine
    Department of Medicine
    Brigham and Women’s Hospital
    75 Francis St, Medical Research Building, Suite 416
    Boston, MA, 02115
    Tel: 857-800-3455, Fax: 617-975-0840
    Email: scorreagaviria@bwh.harvard.edu

                                                  1

                          Copyright 2021 by American Society of Nephrology.
Key Points
Electrolyte fluxes after contemporary HD and the relationship between serum
electrolytes and dialysate prescription remain understudied
HCO3, Ca, and albumin increased, while K, Mg, and PO4 decreased immediately post-
HD. Dynamic changes followed at 15- and 30-minutes post-HD
We provide predictive models to estimate the pre- to post-HD change in serum
electrolytes. Validation of models is warranted
Abstract
Background: There is a paucity of contemporary data examining electrolyte changes during
and immediately after hemodialysis (HD), and their relationship with dialysate prescriptions. The
present study examines these relationships.
Methods: We analyzed patient- (n=66) and HD session-level pre- and post-dialysis laboratory
data (n=1,713) over a six-month period from the Monitoring in Dialysis Study. We fit mixed
effects regression models to analyze electrolyte, blood urea nitrogen, creatinine, and albumin
levels immediately post-HD, accounting for pre-HD and dialysate prescriptions. In a subset of
US patients (n=40), 15-minute post-HD and 30-minute post-HD values were available at one
session. Predictive models were fit to estimate electrolyte levels immediately post-HD,
accounting for pre-HD concentrations and dialysate prescriptions.
Results: Serum bicarbonate, calcium, and albumin increased (mean increase 4.9±0.3 mEq/L,
0.7±0.1 mEq/L, and 0.4±0.03 g/dL, respectively), whereas potassium, magnesium, and
phosphorus decreased immediately post-HD (mean -1.2±0.1 mEq/L, -0.3±0.03 mEq/L, and -
3.0±0.2 mg/dL, respectively). Hypokalemia and hypophosphatemia were present in 40% of and
267% of immediate post-HD samples, respectively. Dynamic changes were observed in
electrolyte concentrations at 15- and 30-minutes post-HD, compared to immediately post-HD.
Conclusion: We describe the magnitude of post-dialytic changes in serum electrolytes with
contemporary HD, reporting a high incidence of electrolyte abnormalities post-HD, and present
predictive nomograms relating electrolyte changes immediately post-HD to dialysate
prescriptions. Our results may be useful for clinical care and provide insights for future research
on dialysate prescriptions.
3Introduction
Over 450,000 patients in the United States are dependent on maintenance hemodialysis (HD)
for control of serum electrolyte concentrations and acid-base parameters1. Traditionally offered
as a thrice-weekly therapy, HD utilizes the processes of diffusion and convection to ensure
adequate and safe removal of some molecules, while maintaining or replenishing others2,3. The
dialysate prescription is a critical component in this process and requires a detailed
understanding of the dynamic changes and rebound in electrolyte concentrations that occur as
a result of HD treatments. This is particularly important, since emerging data implicates the
dialysis electrolyte prescription, and both lower and higher serum electrolyte concentrations, as
important factors associated with the high incidence of sudden death in patients on
maintenance HD4.
Over the course of the last few decades, several technological advances and changes in clinical
practice have been implemented for HD therapy, including the use of higher-efficiency and
higher-flux membranes, avoidance of membrane re-use, and shorter treatment times2. These
may have important implications for the expected peri-dialytic changes in serum electrolytes in
modern HD practice. Despite this, a relative paucity of data exists in contemporary practice
related to pre-post HD electrolyte changes, shifts in electrolytes during the post-dialysis period,
and the influence of the dialysis prescription on such changes.
The aim of the present study was two-fold: 1) to describe the post-dialytic changes in standardly
assessed serum electrolyte and biochemical parameters; and 2) to determine the association of
the dialysate prescription with electrolyte changes. The present analyses harness the wealth of
pre- and post-HD laboratory data from the Monitoring in Dialysis Study (MiD) study, a
prospective, multicenter cohort study that used implantable loop recorders to determine the
frequency of cardiac arrhythmias over a 6-month period.
4Methods
Study design and population
This study is a secondary analysis of the Monitoring in Dialysis (MiD) study5. MiD was a
prospective cohort study that enrolled 66 maintenance HD patients (n=43 from the United
States; n=23 from India) from 10 centers and used implantable loop recorders to record
continuous electrocardiographic readings over a 6-month primary observation period. Subjects
were enrolled from January 2013 to January 2014 in the US and from March 2014 to December
2015 in India. The primary eligibility criteria were age 21 or older, thrice-weekly in-center HD or
eGFR < 15ml/min/1.73 m2 with expected HD initiation within two months, though no patients
were enrolled before their HD initiation. Key exclusion criteria were unsuitability for implantation,
expected survival less than 6 months, left-sided HD catheter interfering with implantation,
thoracic surgery within 6 months, bacteremia within 60 days or non-bacteremic infection within
14 days, hemoglobinminutes post-HD, and 30-minutes post-HD, compared with the immediately post-HD
measurements.
Laboratory analysis
In MiD, per the pre-specified protocol5, blood samples were obtained before and after dialysis
twice weekly for the first 4 weeks and then once weekly through the remaining 5 months. Per
protocol, additional samples were obtained at 15- and 30-minutes after dialysis on the first
session after implantable loop recorder placement in a sub-group of the US participants (n=40).
Blood samples were collected at study sites by trained personnel, centrifuged, refrigerated and
then shipped to a certified Central Laboratory (DaVita Total Renal Laboratories Inc in the US
and a central lab in India) for measurement, using standard techniques.
Statistical analysis
Continuous variables were examined graphically and recorded as means (± standard deviation)
for normally distributed data, or medians (25th-75th percentile) for non-normally distributed data.
Categorical variables were examined by frequency distribution and recorded as proportions.
Pre-HD and post-HD electrolyte and laboratory assessments were described as means (±
standard error), accounting for repeated measures across subjects via the use of mixed models
with random intercept. The mean differences between post-HD and: 1) pre-HD measurements,
2) 15-minute post-HD, and 3) 30-minute post-HD were estimated and compared using mixed
effects regression models. Additionally, as the differences between the pre-dialysis serum and
dialysate concentration may influence the post-dialysis serum concentration of any given
electrolyte, unadjusted and adjusted models were fit to determine the association of
corresponding dialysate prescriptions with change (pre-HD to post-HD) in serum electrolyte
concentrations. Model 1 adjusted for the corresponding pre-HD serum electrolyte
concentrations; Model 2 additionally adjusted for the dialysis session length. Further, using the
linear mixed effect regression models described previously, we predict (and plot) the change
6(pre-HD to post-HD) in serum electrolyte concentration, according to the pre-HD serum and dialysate concentrations of the electrolyte of interest. These analyses were carried out for serum sodium, potassium, bicarbonate, and calcium separately. Sub-group analyses were also performed according to country of origin for these plots. Missing data was not imputed. Overall, there was less than 4% missing for any parameter. All analyses were carried out using the statistical software package SAS version 9.4 (Cary, NC). Two-sided P-values of
dialysate flow rates, and tended to have a narrower range of dialysate prescriptions than those

from India (Supplementary Table 2).

       Changes in electrolyte concentrations and other biochemical parameters from

pre- to post-HD – descriptive outcomes

The median (25th-75th percentile) number of pre-HD and post-HD sessions analyzed per patient

was 28 (25-29) and 27 (24-29), respectively. Compared with pre-dialysis concentrations, serum

bicarbonate, calcium, and albumin increased immediately post-HD (mean increase 4.9±0.3

mEq/L, 0.7±0.1 mg/d/L, and 0.4±0.03 g/dL, respectively; Table 3, Figure 1). Conversely, serum

potassium, magnesium, and phosphorus decreased immediately following dialysis (mean

decrease -1.2±0.1 mEq/L, -0.3±0.03 mg/d/L, and -3.0±0.2 mg/dL respectively). As expected,

BUN and creatinine also declined, with mean decline of -39.9±1.2 mg/dL for BUN and -6.3±0.3

mg/dL for serum creatinine (Table 3, Figure 1). Post-HD values were frequently abnormal with

311/1,685 (18.5%) having a post-HD sodium 10.4 mg/dL, 162/1,690 (9.6%) with post-HD magnesium
calcium (-0.3±0.1 mg/dL), and albumin (-0.2±0.1 g/dL; Table 4; Figure 1). The proportion of
sessions with abnormal serum electrolyte values at 30-minutes post-HD is presented in Table 5.
Association of dialysate prescriptions with changes in pre-to-post HD electrolyte
concentrations
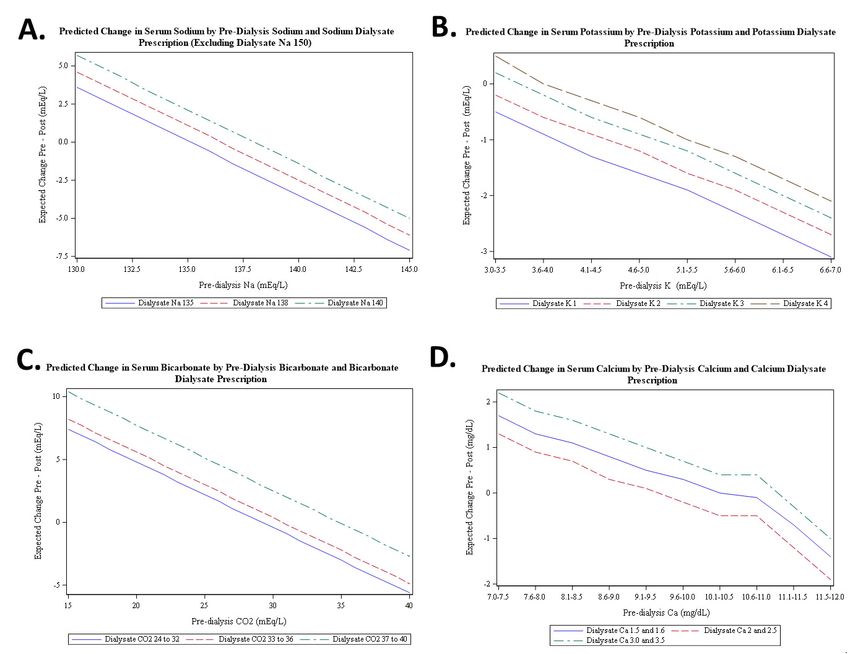
The dialysate sodium prescription was significantly associated with the change in serum sodium
concentration from pre-HD to immediately post-HD. For example, adjusted for the pre-HD
serum sodium, a dialysate sodium prescription of 135 mEq/L was associated with a post-HD
decline of 1.4 mEq/L in serum sodium, while a dialysate sodium concentration of 140 mEq/L
was associated with a post-HD increase of 0.6 mEq/L. As expected, lower dialysate potassium
prescriptions were associated with greater decrease in post-HD serum potassium, while higher
dialysate bicarbonate and calcium prescriptions were associated with higher post-HD serum
bicarbonate and calcium concentrations, respectively. Results were qualitatively unchanged
when further adjusted for dialysis session duration (Table 6). Analogous models are presented
in sub-group analyses according to the country of origin (Supplementary table 3). While there
are some qualitative and quantitative differences, the precision and stability of these estimates
are limited by the small sample size and low variability across dialysate prescriptions among the
patients from India.
We developed predictive models to estimate the immediate post-HD serum electrolyte
concentration, according to the pre-HD serum concentration and dialysate prescription. In these
models, dialysate sodium, potassium, bicarbonate, and calcium were significantly associated
with pre- to post-HD changes in the serum concentration of the corresponding electrolyte
(Figure 2 and Supplementary Tables 4-8). Sub-group analyses according to country of origin
are presented in Supplementary Figure 1.
Discussion
9Our secondary analysis of the MiD study describes the immediate and post-HD changes in standardly assessed electrolytes, analyzes the association of dialysate prescription with such changes, and develops initial predictive models to estimate the pre- to post-HD change in serum electrolytes. We observed significant increases in serum bicarbonate, calcium, and albumin and significant decreases in serum potassium, magnesium, and phosphorus immediately following contemporary HD sessions. As post-HD measurements are infrequently performed in clinical practice, our results provide important information on temporal changes and highlight that a significant proportion of values fall outside standard laboratory reference ranges. Maintenance HD provides a life-saving therapy that has become increasingly available to patients with ESRD across the world. Despite familiarity with this process from over 50 years of clinical use, descriptions of the magnitude of change in serum electrolytes with contemporary practice remain necessary to augment current clinical understanding of the biochemical changes during HD on the one hand, while providing important data for dialysate prescription research on the other. Dialysate potassium is typically prescribed with the goal of lowering serum (and total body) potassium concentrations that have risen in the inter-dialytic period. Recent research has called particular attention to the observation that post-HD hypokalemia, especially in the setting of pre- HD hypokalemia, is associated with higher all-cause mortality7. While the use of dialysate potassium concentrations
significant arrhythmia in the primary analyses of the MiD study6,9. Our findings demonstrate that

post-HD hypokalemia is common. While prior research demonstrates that rebound in serum

potassium continues to occur beyond the post-HD timepoints assessed in our study, more

proximal post-HD hypokalemia may partially explain the increased risk of arrhythmia in the

immediate post-HD period.

In maintenance HD patients, the intra-dialytic delivery of bicarbonate facilitates buffering of

acidic by-products of metabolism, which occurs in the inter-dialytic period. However, this may

come at the expense of rapid increases in serum bicarbonate during HD. It has thus been

proposed that the optimal dialysate bicarbonate concentration is one that prevents both acidosis

between sessions and alkalosis during a HD session10. As expected, our results demonstrate a

substantial increase in serum bicarbonate concentrations during HD sessions and are

consistent with other reports that describe higher post-HD serum concentrations with the use of

higher dialysate bicarbonate baths. Interestingly, our data suggest a rebound decrease in serum

bicarbonate in the 30-minutes post-HD, which may reflect some element of redistribution. As it

is known that HD patients are 1.7-fold more likely to develop sudden death in the 12 hours

following HD11, more data are required to fully understand the changes in acid-base parameters

and associated changes in electrolytes that occur during and between HD sessions.

In the present analyses, on average, serum calcium appeared to increase during HD sessions,

with higher post-HD serum concentrations noted with use of higher dialysate calcium baths. In

recent years, there has been a movement toward the use of lower dialysate calcium

concentrations, based on KDIGO guidelines, in an attempt to minimize vascular calcification12.

As with serum bicarbonate, there seems to be a rebound decease in serum calcium

concentrations in the 30-minutes post-HD. Conversely, serum calcium and phosphorus exist in

biochemical equilibrium. Phosphorus levels tended to decrease dramatically during HD and, on

the basis of our data, we are unable to fully determine the extent to which changes in serum

                                                 11
calcium reflect the influence of dialysate calcium concentration, compared with reduction in
serum phosphorus. Additionally, we observed changes in serum albumin, suggesting that the
corrected calcium may not change significantly. The saw-tooth pattern of changes in serum
albumin and calcium in the post-dialytic period is unusual – whether this reflects true changes or
artefact in these samples is unclear, and requires further investigation. Measurement of ionized
calcium concentrations would likely provide a better physiological measurement for future
studies in this regard.
The development of hyperphosphatemia is a common manifestation of progressive chronic
kidney disease and is associated with several adverse outcomes in patients with ESRD on
HD13-15. However, it is less well appreciated that serum phosphorus is rather efficiently removed
by HD, leading to rapid decline in serum concentrations at the end of a HD session. It is notable
that the most rapid decline in serum phosphorus occurs early in a HD session16, which
corresponds to the timing of the largest decline in cardiac output and blood pressure17.
Additionally, hypophosphatemia is associated with the development of ventricular arrhythmias18.
Though phosphorus-enriched dialysate baths have been employed in the setting of
hypophosphatemia19, to our knowledge no research has assessed this association of this
practice with outcomes, such as arrhythmia and mortality20. Our data clearly show significant
decreases in phosphorus levels during HD, with an average decline in serum phosphorus of 3
mg/dL, while 67.1% of immediate post-HD values were below the lower reference limit. Whether
this phenomenon predisposes to arrhythmia or other adverse effects during HD, and further,
whether the addition of phosphorus to the dialysate may mitigate this rapid change, is uncertain,
but clearly warrants further study. Our data also confirm the presence of a previously reported
rebound increase in phosphorus concentrations in the post-HD period21,22. This rebound is of
course expected, as phosphorus is a largely intracellular cation23, with the rebound likely
occurring as a result of redistribution from the intracellular stores.
12Lastly, our data highlight that serum magnesium is lowered during HD but does not appear to have the same degree of rebound toward pre-HD concentrations observed for some other electrolytes. Though perhaps less-appreciated in the HD population, it has been shown that both extremes of higher (>2.1mg/dL) and lower (
models with the goal of providing personalized HD prescriptions that will minimize adverse

cardiovascular outcomes and mortality.

There are several strengths to our analyses. The present study uses data from the MiD study, a

multicenter prospective cohort with detailed session-level information on pre- and post-HD

serum chemistries that were measured at a central laboratory and mandated by protocol.

Though prior research has described changes in electrolyte concentrations post-dialysis, the

relatively large number of samples in our study allowed prediction models to be developed.

Additionally, 15- and 30-minute post-HD measurements were available for a subset of patients,

allowing analysis of delayed changes. However, some limitations deserve consideration. The

modest sample size and concerns of model over-fitting precluded extensive adjustment for other

variables, such as body weight and UF volume. In this respect, although our overall goal was to

provide primarily descriptive analyses, the possibility of residual confounding remains, and our

results may be underpowered and should be considered with caution. Another limitation is the

lack of intra-dialytic measurements and short duration of post-HD lab follow up (labs only

obtained at the 15- and 30-minute post-HD time points, in comparison to other studies which

drew levels up to the 6-hour post-HD time point)8. Future studies should assess electrolyte

changes during HD and for a longer duration following HD and should also assess the

associations of these electrolyte changes with intra- and post-HD arrhythmia for a longer post-

HD time interval. Data regarding the association of intra- and post-HD electrolytes with clinical

outcomes will be necessary for understanding the implications of abnormal electrolytes specific

to the HD patient population. Neither ionized calcium nor dialysate magnesium were recorded or

measured in MiD, precluding further analyses of these parameters. Further, dialysis baths

reflected ordered, rather than measured, concentrations of electrolytes. In a typical “three-

stream” dialysis system, manipulation of dialysate bicarbonate, for example may affect dialysate

sodium slightly. However, this would not be expected to induce a clinically relevant difference in

                                                14
the sodium concentration delivered. While it is unlikely that the relationship between pre-dialysis
values and dialysate chemistry varies widely, our cohort included a modest number of patients
from a few centers in the USA and India that may not fully represent the broad range of pre-
dialysis concentrations or prescription choices utilized throughout the world. Furthermore, the
inclusion and exclusion criteria in this study may have selected potentially ‘healthier’ patients,
further limiting the generalizability of our findings to those with more extreme pre-HD electrolyte
abnormalities.
In conclusion, this secondary analysis of the MiD study provides a detailed assessment of the
changes in electrolytes from pre- to post-HD with contemporary HD treatments. Though the
sample size is modest, this data provides information for practicing clinicians who wish to better
understand the implications of differing dialysate prescriptions on the changes in serum
electrolytes from pre- to immediately post-HD; however, prospective validation of these findings
is required. This study highlights several areas of unmet need, which are ripe for development
of future interventional studies involving the dialysate prescription.
15Disclosures
All of the authors, with the exception of Dr. Correa, Dr. Scovner, and Dr. Mc Causland, received
significant research support and/or consulting fees from Medtronic in relation to the design and
conduct of the study. The MiD study was conducted by the MiD Investigators and funded by
Medtronic. Dr. Charytan participated in the MiD Study as investigator and Advisory committee
member.
David M. Charytan-Expert witness fees related to dialysate composition-Fresenius, Research
Support-Medtronic and Amgen. Research Support and Consulting Fees related to services as
national investigator, trial steering committee or Data Monitoring Committee-Zoll Medical, Allena
Pharmaceuticals, Astra Zeneca (modest), Janssen Pharmaceuticals, Gilead Pharmaceuticals,
and Novo Nordisk. Consulting fees and Travel Support-Medtronic/Covidien, Daichi Sankyo,
Fresenius (modest), Amgen, AstraZeneca, Glaxo Smith Kline, and Merck.
James A. Tumlin-None
Don Williamson- COO for American Renal Associates
Alexandru I Costea – speaker’s bureau for Biotronik and Biosense Webster
Vijay Kher – Research Funding – Novartis India, Sanofi Aventis India, Astellas India, Honoraria
– Novartis India, Roche India, Astellas India, Torrent India, Reddy’s India, Scientific Advisor –
Roche India, Novartis India, Torrent, Sanofi Aventis, Reddy’s India, Biocon India, Medtronis,
Speakers Bureau – Novartis India, Roche India, Panacea India, Sanofi Aventis India, Intas
India, Biocon India, Pfizer, Medtronic
Bruce Koplan-Research Funding-No other conflicts
Saurabh Pokhariyal-No other conflicts.
16Prabir Roy-Chaudhury. Consultant or Advisory Board for: Medtronic, BD-Bard, WL Gore,
Cormedix, Humacyte, Akebia, Bayer, Vifor-Relypsa
Funding
The MiD study was funded by Medtronic and designed by Medtronic in collaboration with an
advisory committee that included the authors. Medtronic was responsible for design of the study
database, the data collection instruments, and funding the statistical analysis. The authors were
responsible for data interpretation and writing the manuscript.
Author Contributions
S.C, D.M.C and F.M.C designed the study; D.M.C acquired the study data; K.M.C conducted
statistical analyses; S.C and K.M.S drafted the manuscript; all authors analyzed and interpreted
the results; D.M.C and F.M.C provided supervision or mentorship. Each author contributed
important intellectual content during manuscript drafting or revision and accepts accountability
for the overall work by ensuring that questions pertaining to the accuracy or integrity of any
portion of the work are appropriately investigated and resolved.
Acknowledgements
The authors would like to thank Ven Manda, John Burnes, and Amy Roettger from Medtronic for
support and collaboration on MiD and Candace McClure from North American Science
Associates (NAMSA) for statistical support. Dr. Scovner is supported by the American Society of
Nephrology Ben J. Lipps Research Fellowship grant. Dr. Mc Causland was supported by NIH
grant K23DK102511.
MiD Investigators and Committees.
Nephrology Investigators—Don Williamson, MD (Southeastern Clinical Research Institute,
Augusta, GA, Augusta, GA), Prabir Roy-Chaudhury, MD, (University of Cincinnati Medical
Center Cincinnati, OH now at the University of Arizona Tuscon, AZ), James Tumlin, MD
17(Nephronet Clinical Research Institute, Atlanta, GA), Vijay Kher, MD (Medanta - The Medicity-
Kidney & Urology Institute, Gurgaon, India), Vikranth Reddy, MD (CARE Hospital Hyderabad,
India), Kowdle Chandrasekhar Prakash, MD, (Apollo Hospitals –Chennai, India), David
Charytan, MD MSc (Brigham & Women’s Hospital, Boston, MA), Suresh Chandra Tiwari, MD
(Fortis Vasant Kunj Hospital Delhi, India), Saurabh Pokhariyal, MD (Fortis Memorial Research
Institute Gurgaon, India), Amber Podoll, MD (University of Texas-Houston, Houston, TX),
Sanjeev Jasuja, MD (Apollo Hospitals – Delhi, Delhi, India).
Cardiology Investigators—G. Leslie Walters, MD (Augusta Cardiology Clinic, Augusta, GA),
Kraig Wangsnes, MD (Cardiovascular Associates, Augusta, GA), Alexandru Costea, MD
(University of Cincinnati Medical Center, Cincinnati, OH), Selcuk Tombul, MD (Diagnostic
Cardiology Group, Chattanooga, TN), Balbir Singh, MD (Medanta - The Medicity- Heart Institute,
Gurgaon, India), Brajesh Mishra, MD (Medanta - The Medicity- Heart Institute, Gurgaon, India),
Sachin Yalagudri, MD (CARE Hospital, Hyderabad, India), Abhijeet Shelke, MD (CARE Hospital
Hyderabad, India), Calambur Narasimhan, MD (CARE Hospital, Hyderabad, India), A.M.
Karthigesan, MD (Apollo Hospitals – Chennai, Chennai, India), Abraham Oomman, MD (Apollo
Hospitals – Chennai, Chennai, India), K P Pramod Kumar, MD (Apollo Hospitals – Chennai,
Chennai, India), Bruce Koplan, MD (Brigham & Women’s Hospital, Boston, MA), Upendra Kaul,
MD (Fortis Vasant Kunj Hospital, Delhi, India), Tapan Ghose, MD (Fortis Vasant Kunj Hospital,
Delhi, India), Ripen Gupta, MD (Fortis Vasant Kunj Hospital, Delhi, India), Arvind Sethi, MD
(Fortis Escorts Hospital, Delhi, India), Nikhil Kumar, MD (Fortis Memorial Research Institute,
Gurgaon, India), Ramesh Hariharan, MD, (University of Texas-Houston, Houston, TX), Rajnish
Sardana, MD (Apollo Hospitals – Delhi, Delhi, India), Arif Wahab, MD (Apollo Hospitals – Delhi,
Delhi, India) N.N Khanna, MD (Apollo Hospitals – Delhi, Delhi, India)
Nephrology Co-investigators— Mark Smith, MD (Southeastern Clinical Research Institute,
Augusta, GA), Suresh Kamath, MD (University of Cincinnati Medical Center, Cincinnati, OH),
18Claude Galphin, MD (South East Renal Research Institution (SERRI), Chattanooga, TN),
Puneet Sodhi, MD (Medanta - The Medicity- Heart Institute, Gurgaon, India), Rajsekara
Chakravarthy, MD (CARE Hospital, Hyderabad, India), Subba Rao Budithi, MD (Apollo
Hospitals – Chennai, Chennai, India), Finnian McCausland, MB, MMSc (Brigham & Women’s
Hospital, Boston, MA), Sanjeev Gulati, MD (Fortis Vasant Kunj Hospital, Delhi, India), Munawer
Dijoo, MD (Fortis Vasant Kunj Hospital, Delhi, India), Upendra Singh, MD (Fortis Escorts
Hospital, Delhi, India), Salil Jain, MD (Fortis Memorial Research Institute, Gurgaon, India),
Vishal Saxena, MD (Fortis Memorial Research Institute, Gurgaon, India), Gaurav Sagar, MD
(Apollo Hospitals – Delhi
Delhi, India)
Advisory Committee—David Charytan, MD, MSc, (Brigham & Women’s Hospital, Boston, MA),
Rachel Fissell, MD (Vanderbilt University, Nashville, TN), Robert Foley, MD (Hennepin County
Medical Center, Minneapolis, MN), Charles A. Herzog, MD (Hennepin County Medical Center,
University of Minnesota, Minneapolis, MN), Peter McCullough, MD (Baylor University Medical
Center, Baylor Heart and Vascular Institute, Baylor Jack and Jane Hamilton Heart and Vascular
Hospital, Dallas), John D. Rogers, MD (Scripps Clinic-Torrey Pines, La Jolla, CA), James A.
Tumlin, MD (South East Renal Research Institution (SERRI), Chattanooga, TN), Peter
Zimetbaum, MD (Beth Israel Deaconess Medical Center, Boston, MA)
Adverse Events Committee— Manish Assar, MD (Baylor University Medical Center, Dallas, TX),
Mark Kremers, MD (Mid Carolina Cardiology Charlotte, North Carolina), Wolfgang C.
Winkelmayer, MD ScD (Baylor College of Medicine, Houston, TX)
19References
1. United States Renal Data System. End-stage Renal Disease (ESRD) in the United
States, Chapter 1 Incidence, Prevalence, Patient Characteristics, and Treatment
Modalities. In: National Institutes of Health, National Institute of Diabetes and Digestive
and Kidney Diseases, eds. USRDS annual data report: Epidemiology of kidney disease
in the United States. Bethesda, MD: National Institutes of Health, National Institute of
Diabetes and Digestive and Kidney Health; 2017.
2. National Kidney F. KDOQI Clinical Practice Guideline for Hemodialysis Adequacy: 2015
update. Am J Kidney Dis. 2015;66(5):884-930.
3. Richard J. Johnson JF, Jurgen Floege, Marcello Tonelli. Hemodialysis: Principles and
Techniques. In: Peter Kotanko MKK, Christopher Chan, Nathan W. Levin, ed.
Comprehensive Clinical Nephrology. 6 ed.: Elsevier; 2019.
4. Rhee CM, Chou JA, Kalantar-Zadeh K. Dialysis Prescription and Sudden Death.
Seminars in nephrology. 2018;38(6):570-581.
5. Charytan DM, Foley R, McCullough PA, et al. Arrhythmia and Sudden Death in
Hemodialysis Patients: Protocol and Baseline Characteristics of the Monitoring in
Dialysis Study. Clinical journal of the American Society of Nephrology : CJASN.
2016;11(4):721-734.
6. Roy-Chaudhury P, Tumlin JA, Koplan BA, et al. Primary outcomes of the Monitoring in
Dialysis Study indicate that clinically significant arrhythmias are common in hemodialysis
patients and related to dialytic cycle. Kidney Int. 2018;93(4):941-951.
7. Ohnishi T, Kimachi M, Fukuma S, Akizawa T, Fukuhara S. Postdialysis Hypokalemia
and All-Cause Mortality in Patients Undergoing Maintenance Hemodialysis. Clinical
journal of the American Society of Nephrology : CJASN. 2019;14(6):873-881.
208. Blumberg A, Roser HW, Zehnder C, Müller-Brand J. Plasma potassium in patients with
terminal renal failure during and after haemodialysis; relationship with dialytic potassium
removal and total body potassium. Nephrol Dial Transplant. 1997;12(8):1629-1634.
9. Tumlin JA, Roy-Chaudhury P, Koplan BA, et al. Relationship between dialytic
parameters and reviewer confirmed arrhythmias in hemodialysis patients in the
monitoring in dialysis study. BMC Nephrol. 2019;20(1):80.
10. John Gennari F. Very low and high predialysis serum bicarbonate levels are risk factors
for mortality: what are the Appropriate Interventions? Seminars in dialysis.
2010;23(3):253-257.
11. Bleyer AJ, Hartman J, Brannon PC, Reeves-Daniel A, Satko SG, Russell G.
Characteristics of sudden death in hemodialysis patients. Kidney Int. 2006;69(12):2268-
2273.
12. Uhlig K, Berns JS, Kestenbaum B, et al. KDOQI US commentary on the 2009 KDIGO
Clinical Practice Guideline for the Diagnosis, Evaluation, and Treatment of CKD-Mineral
and Bone Disorder (CKD-MBD). American journal of kidney diseases : the official journal
of the National Kidney Foundation. 2010;55(5):773-799.
13. Krasniak A, Drozdz M, Pasowicz M, et al. Factors involved in vascular calcification and
atherosclerosis in maintenance haemodialysis patients. Nephrology, dialysis,
transplantation : official publication of the European Dialysis and Transplant Association
- European Renal Association. 2007;22(2):515-521.
14. Young EW, Albert JM, Satayathum S, et al. Predictors and consequences of altered
mineral metabolism: the Dialysis Outcomes and Practice Patterns Study. Kidney
international. 2005;67(3):1179-1187.
15. Slinin Y, Foley RN, Collins AJ. Calcium, phosphorus, parathyroid hormone, and
cardiovascular disease in hemodialysis patients: the USRDS waves 1, 3, and 4 study.
Journal of the American Society of Nephrology : JASN. 2005;16(6):1788-1793.
2116. DeSoi CA, Umans JG. Phosphate kinetics during high-flux hemodialysis. Journal of the
American Society of Nephrology : JASN. 1993;4(5):1214-1218.
17. Buchanan C, Mohammed A, Cox E, et al. Intradialytic Cardiac Magnetic Resonance
Imaging to Assess Cardiovascular Responses in a Short-Term Trial of Hemodiafiltration
and Hemodialysis. Journal of the American Society of Nephrology : JASN.
2017;28(4):1269-1277.
18. Christopoulou EC, Filippatos TD, Megapanou E, Elisaf MS, Liamis G. Phosphate
imbalance in patients with heart failure. Heart failure reviews. 2017;22(3):349-356.
19. Ing TS, Chebrolu SB, Cheng YL, Yu AW, Choi P, Kjellstrand CM. Phosphorus-enriched
hemodialysates: formulations and clinical use. Hemodialysis international International
Symposium on Home Hemodialysis. 2003;7(2):148-155.
20. Ayus JC, Achinger SG, Mizani MR, et al. Phosphorus balance and mineral metabolism
with 3 h daily hemodialysis. Kidney international. 2007;71(4):336-342.
21. Haas T, Hillion D, Dongradi G. Phosphate kinetics in dialysis patients. Nephrology,
dialysis, transplantation : official publication of the European Dialysis and Transplant
Association - European Renal Association. 1991;6 Suppl 2:108-113.
22. Mucsi I, Hercz G. Control of serum phosphate in patients with renal failure--new
approaches. Nephrology, dialysis, transplantation : official publication of the European
Dialysis and Transplant Association - European Renal Association. 1998;13(10):2457-
2460.
23. Kemp GJ, Meyerspeer M, Moser E. Absolute quantification of phosphorus metabolite
concentrations in human muscle in vivo by 31P MRS: a quantitative review. NMR in
biomedicine. 2007;20(6):555-565.
24. Cheungpasitporn W, Thongprayoon C, Qian Q. Dysmagnesemia in Hospitalized Patients:
Prevalence and Prognostic Importance. Mayo Clinic proceedings. 2015;90(8):1001-1010.
2225. Ishimura E, Okuno S, Yamakawa T, Inaba M, Nishizawa Y. Serum magnesium
concentration is a significant predictor of mortality in maintenance hemodialysis patients.
Magnesium research. 2007;20(4):237-244.
26. Alhosaini M, Leehey DJ. Magnesium and Dialysis: The Neglected Cation. American
journal of kidney diseases : the official journal of the National Kidney Foundation.
2015;66(3):523-531.
27. Turgut F, Kanbay M, Metin MR, Uz E, Akcay A, Covic A. Magnesium supplementation
helps to improve carotid intima media thickness in patients on hemodialysis.
International urology and nephrology. 2008;40(4):1075-1082.
28. Tzanakis I, Virvidakis K, Tsomi A, et al. Intra- and extracellular magnesium levels and
atheromatosis in haemodialysis patients. Magnesium research. 2004;17(2):102-108.
29. Agar BU, Akonur A, Lo YC, Cheung AK, Leypoldt JK. Kinetic model of phosphorus
mobilization during and after short and conventional hemodialysis. Clinical journal of the
American Society of Nephrology : CJASN. 2011;6(12):2854-2860.
30. Rudnicki M, Frølich A, Haaber A, Tvedegaard E, Thode J. Serum ionized calcium,
parathyroid hormone and phosphate in uremic patients during and between
hemodialysis. Clinical nephrology. 1993;40(4):225-229.
23Table 1. Characteristics of the participants at baseline
All subjects
Baseline Characteristics
(n=66)
Age, years 56 ± 12
Male, n (%) 46 (70)
Race, n (%)
Asian 23 (35)
Black 35 (53)
White 7 (11)
Other 1 (1)
ESRD vintage, years 2.4 [1.2, 5.3]
Vascular access, n (%)
AV fistula 46 (71)
AV graft 16 (25)
Catheter 3 (5)
Comorbid conditions, n (%)
Diabetes mellitus 28 (43)
Hyperlipidemia 40 (61)
Hypertension 56 (85)
Ischemic heart disease 32 (48)
Congestive heart failure 17 (26)
Arrhythmia 21 (32)
Atrial fibrillation 7 (11)
Systolic blood pressure, mmHg 141 ± 23
Diastolic blood pressure, mmHg 77 ± 13
Medication use, n (%)
Aspirin 30 (45)
Statin 32 (48)
ACEI or ARB 22 (33)
Beta-blockers 36 (55)
Pre-dialysis serum laboratory values
Blood urea nitrogen, mg/dL 60 ± 18
Creatinine, mg/dL 10.0 ± 3.4
Sodium, mEq/L 137 ± 4
Potassium, mEq/L 5.0 ± 1.0
Calcium, mg/dL 8.7 ± 0.8
Bicarbonate, mEq/L 22 ± 4
Magnesium, mg/dL 2.4 ± 0.5
Phosphorus, mg/dL 5.5 ± 2.0
Hemoglobin, g/dL 11 ± 1
Serum albumin, g/dL 3.9 ± 0.3
Continuous variables are presented as means ± standard deviation or median [25th, 75th
percentiles].
Abbreviations: ESRD, end-stage renal disease; AV, arteriovenous; ACEI, angiotensin converting
enzyme inhibitor; ARB, angiotensin receptor blocker.
24Table 2. Characteristics of the dialysis prescription at baseline
All subjects
Baseline Characteristics
(n=66)
Duration of hemodialysis, hours 4.0 [3.0, 6.0]
spKt/V 1.5 ± 0.4
Pre-dialysis weight, kg 86.7 ± 28.8
Kg over dry weight target before
4.2 [-0.4, 12.0]
dialysis
UFR, ml/kg/h 10 ± 4
Dialysate Flow, mL/min 600 [500, 800]
Blood Flow, mL/min 390 [324, 461]
High-flux dialyzer, n (%) 42 (64)
Membrane reuse, n (%) 18 (27)
Cellulose membrane, n (%) 5 (8)
Dialysate temperature, n (%)
35.5 Celsius 1 (2)
36.0 Celsius 3 (5)
36.5 Celsius 5 (8)
37.0 Celsius 57 (86)
Dialysate potassium, n (%)
1.0 mEq/L 1 (2)
2.0 mEq/L 53 (80)
3.0 mEq/L 11 (17)
4.0 mEq/L 1 (2)
Dialysate calcium, n (%)
1.5 and 1.6 mEq/L 13 (20)
2.0 and 2.5 mEq/L 39 (59)
3.0 and 3.5 mEq/L 14 (21)
Dialysate sodium, n (%)
135 mEq/L 6 (10)
138 mEq/L 6 (10)
140 mEq/L 49 (80)
Dialysate Bicarbonate, n (%)
24 - 32 mEq/L 16 (24)
33 - 36 mEq/L 34 (52)
37 – 40 mEq/L 16 (24)
Continuous variables are presented as means ± standard deviation or median [25th, 75th
percentiles].
Abbreviations: spKt/V, single-pool Kt/V; UFR, ultrafiltration rate
25Table 3. Electrolyte and laboratory values pre- and immediately post-HD
Frequency of Frequency of
Delta (Post-HD
Pre-HD value Post-HD value post-HD post-HD
minus Pre-HD) P-value
Laboratory mean (SE) mean (SE) concentrations concentrations
mean (SE) (Post vs. LLN ULN
Parameter N subjects N subjects below the LLN above the ULN
N subjects Pre-HD)
N HD sessions N HD sessions N subjects N subjects
N HD sessions
N HD sessions N HD sessions
136.9 (0.5) 137.3 (0.3) 0.5 (0.4)
Sodium 38 (57.6%) >145 2 (3.0%)
66 66 66 0.20Table 4. Electrolyte and laboratory changes 15- and 30-minute post-HD
mean (SE) mean (SE)
N subjects P-value N subjects
P-value
Laboratory N HD sessions (Post vs. N HD sessions
(Post vs. 30
Parameter Delta (15 15 mins Delta (30
15 mins 30 mins mins post)
Pre-HD Post-HD mins post post) mins post
post-HD post-HD
minus post) minus post)
136.9 (0.5) 137.3 (0.3) 139.2 (0.4) 0.5 (0.3) 138.7 (0.5) -0.1 (0.3)
Sodium
66 66 40 40 0.10 38 38 0.80
(mEq/L)
1708 1685 40 40 38 38
Potassium 4.9 (0.1) 3.6 (0.1) 3.6 (0.1) -0.1 (0.1) 3.8 (0.1) 0.2 (0.1)
(mEq/L) 66 66 40 40 0.26 38 38 0.03
1699 1689 40 40 38 38
22.3 (0.4) 27.1 (0.4) 27.0 (0.7) -1.1 (0.5) 27.5 (0.5) -0.7 (0.2)
Bicarbonate
66 66 40 40 0.02 38 38Table 5. Proportion of patients with abnormal serum electrolyte values at 30-minutes post-HD.
Frequency of Frequency of
Laboratory post-HD post-HD
LLN ULN
Parameter concentrations concentrations
below the LLN above the ULN
Sodium (mEq/L) 145 0 (0%)
Potassium (mEq/L) 5.0 1 (2.6%)
Bicarbonate (mEq/L) 28 13 (34.2%)
Calcium (mg/dL) 10.4 1 (2.6%)
Magnesium (mg/dL) 2.4 0 (0%)
Phosphorus (mg/dL) 4.5 1 (2.6%)
Abbreviations: LLN, lower limit normal; ULN, upper limit normal; HD, hemodialysis. A total of 38
sessions from 38 patients had 30-minute post-HD measurements
28Table 6. Unadjusted and adjusted changes in pre-HD to post-HD serum electrolytes according
to different dialysate prescriptions
Change in serum electrolyte (post-HD minus pre-HD) in mEq/L or
mg/dL*
Mean (SE)
Dialysate Sodium
Unadjusted P-value Model 1 P-value Model 2 P-value
n/N (%)
135 (mEq/L)
-0.6 (0.6) -1.4 (0.5) -1.5 (0.5)
191/1511 (13%)
138 (mEq/L)
-0.7 (1.2) -0.4 (0.9) -0.4 (0.9)
146/1511 (10%)
140 (mEq/L)
0.5 (0.4) 0.6 (0.3) 0.6 (0.3)
1174/1511 (78%)
0.10Figure legends
Fig 1. Serum electrolyte and laboratory parameter changes over time.
Abbreviations. HD, hemodialysis; min, minute.
Fig 2. Predicted change in A) serum sodium, B) serum potassium, C) serum bicarbonate and D)
serum calcium according to baseline serum electrolyte and dialysate prescription (mEq/L).
Each graph is based on a model that adjusted for the pre-HD concentration of the electrolyte of
interest. For instance, the predictive graph for serum sodium is adjusted for pre-HD serum
sodium.
31Figure 1
Figure 2
You can also read