Spatially and Temporally Resolved Monitoring of Glacial Lake Changes in Alps During the Recent Two Decades
←
→
Page content transcription
If your browser does not render page correctly, please read the page content below
ORIGINAL RESEARCH
                                                                                                                                               published: 30 August 2021
                                                                                                                                          doi: 10.3389/feart.2021.723386

                                            Spatially and Temporally Resolved
                                            Monitoring of Glacial Lake Changes in
                                            Alps During the Recent Two Decades
                                            Jingsong Ma 1,2, Chunqiao Song 2* and Yanjun Wang 1
                                            1
                                              School of Geographical Sciences, Nanjing University of Information Science and Technology, Nanjing, China, 2Key Laboratory of
                                            Watershed Geographic Sciences, Nanjing Institute of Geography and Limnology, Chinese Academy of Sciences, Nanjing, China

                                            Climate warming is intensifying the melting of glaciers and the growth of glacial lakes in the
                                            Alps, which has a profound impact on the management of water resources and high-
                                            mountain hydropower in this region. However, the research on the spatial distribution and
                                            temporal evolution of the Alps glacial lakes of various types still lacks a holistic view. In this
                                            study, we developed an inventory of Alps glacial lakes of different types and then obtained
                                            the annual areas of these lakes from 2000 to 2019 using JRC Global Surface Water and
                                            Global Land Analysis and Discovery data at a resolution of 30 m. A total of 498 glacial
                                            lakes (>0.01 km2) with the net area of 33.77 ± 6.94 km2 were identified in the Alps in 2019
                                            and are mainly distributed in the western and central Alps. These Alps glacial lakes, with the
                          Edited by:        area ranging 0.01–1.59 km2, are generally dominated by small-sized ones. The
                          Hongjie Xie,
  University of Texas at San Antonio,
                                            comparison of lakes of different types indicated that ice-uncontacted lakes are
                        United States       dominant in number and area, accounting for 59.4 and 58.4%, respectively. In terms
                         Reviewed by:       of the elevation distribution, almost half of the lakes are concentrated at the altitude of
                           Riddhi Singh,
                                            2,250–2,750 m (a.s.l.). Meanwhile, the mean altitude of small glacial lakes is higher than
         Indian Institute of Technology
                          Bombay, India     that of large lakes. The distribution of ice-contacted lakes and supraglacial lakes were more
                             Weili Duan,    concentrated, and the mean altitude was higher. During the study period, the number,
      Xinjiang Institute of Ecology and
               Geography CAS, China
                                            area, and water volume of glacial lakes were increasing, but the expansion varied between
                                            different periods. The changing trends of the glacial lake area and volume were consistent
                  *Correspondence:
                     Chunqiao Song
                                            and presents in three stages, as the glacial lake expanded rapidly in the first 5 years and in
                 cqsong@niglas.ac.cn        the last 7 years and remained relatively stable between 2005 and 2012. The number and
                                            area of glacier-fed lakes increased rapidly, while the non-glacier-fed lakes were relatively
                    Specialty section:
                                            stable. The area change rate of supraglacial lakes was the largest (+47%). This study
         This article was submitted to
                         Hydrosphere,       provides a spatially-complete and temporally-consecutive picture of glacial lake changes in
               a section of the journal     the Alps and can be greatly helpful for future research on climate-glacier-lake interactions,
            Frontiers in Earth Science
                                            glacial lake outburst floods, and freshwater resources in this region.
           Received: 10 June 2021
         Accepted: 16 August 2021           Keywords: glacial lake, ALPS, glacier, climate change, remote sensing, landsat
         Published: 30 August 2021
                              Citation:
   Ma J, Song C and Wang Y (2021)
                                            INTRODUCTION
   Spatially and Temporally Resolved
Monitoring of Glacial Lake Changes in
                                            With global warming, the temperature rising is particularly obvious in high-altitude regions, and
Alps During the Recent Two Decades.         glaciers show accelerated retreat or thinning (Zemp et al., 2006; Fischer et al., 2015; Zemp et al.,
           Front. Earth Sci. 9:723386.      2019). Persistently glacier retreat and meltwater supply promotes the circulation of surface water and
      doi: 10.3389/feart.2021.723386        increases the abundance of glacial lake (Yao et al., 2018). As the source of precious water resources

Frontiers in Earth Science | www.frontiersin.org                                    1                                            August 2021 | Volume 9 | Article 723386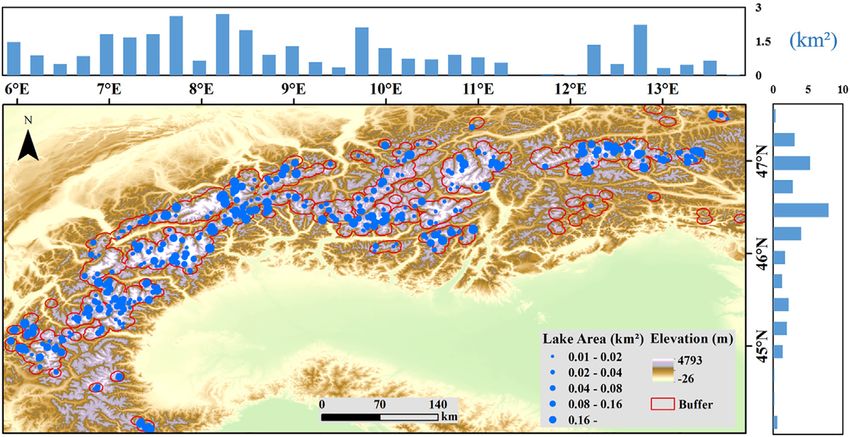
Ma et al.                                                                                                                     Glacial Lakes in the Alps

and mountain flood in high mountain regions, glacial lakes are                 series in the Alps region over the past 20 years to fill the gap in a
not only the carrier of environmental information, but also the               complete glacial lake inventory of the entire region; 2) to reveal
indicator of climate change (Che et al., 2014). At the same time,             the heterogeneous changes of glacial lakes of different types,
glacial lakes promote the melting of alpine glaciers and landscape            scales, and elevation distributions in the Alps; 3) to provide open
evolution and acts vital role in surface water cycle and glacier              access to the resulting inventory data set so as to offer geographic
disaster evolution effect (Song et al., 2016; Song et al., 2017). On          information on glacial lakes and improve awareness of the Alps
the one hand, the glacial lake retains considerable glacier                   glacial lakes.
meltwater, a feature which plays a temporary role in storing
freshwater resources and maintaining sea level (Wang et al.,
2020). On the other hand, in view of the global expansion of                  STUDY AREA AND DATA
glacial lakes and the instability of many glacial lakes (Shugar et al.,
2020), their unexpected outburst will lead to catastrophic floods              Study Area
which seriously threaten downstream residents, infrastructure,                The Alps is the highest mountain range in Europe and is located
and regional ecological environment security. Therefore, the                  in southern Europe and known as the “European water tower”
consecutive monitoring of glacial lake changes is particularly                (Figure 1). The Alps accounts for only 11% of Europe’s total area,
important and urgently needed (Allen et al., 2019; Dubey and                  but provides more than 90% of the water supply of Europe,
Goyal, 2020; Veh et al., 2020).                                               especially in arid regions and in summer (Vanham, 2012). The
    Given the rapid development of remote sensing technology,                 mountain ranges arc in shape and extend from west to east,
varieties of high-resolution satellites and sensors have shown                starting from the Mediterranean coast near Nice in southeast
outstanding performance for the identification, extraction, and                France in the West and ending in the Vienna basin in Austria in
monitoring of glacial lakes (Petrov et al., 2017; Begam and Sen,              the East (Paul et al., 2020). The mountain ranges are 1,200 km
2019). For example, the near five-decade Landsat archive                       long and 130–260 km wide, with a mean altitude of
launched by NASA has become the main data source for                          approximately 3,000 m and a total area of up to 220000 km2
monitoring glacial lake dynamics. On the basis of remote                      (Auer et al., 2007; Zemp et al., 2015). The highest peak is Mont
sensing data, many scholars or institutions have combined                     Blanc (4,808 m).
research needs to perform glacial lake cataloging, especially for                 Located between temperate and subtropical latitudes, the Alps
High Mountain Asia (HMA) (Chen et al., 2020; Wang et al.,                     is the boundary between the temperate continental humid climate
2020). For example, remote sensing imagery has been employed                  of central Europe and the summer dry climate of the subtropical
to map glacial lake inventories for regions of Bhutan (Veettil et al.,        southern Europe. The peak is cold all year round, and the annual
2016), Nepal (Khadka et al., 2018), China (Nie et al., 2017), and             mean temperature is 0°C at the elevation of 2000 m, and the
Patagonia (Wilson et al., 2018) and provides an effective way to              annual precipitation is up to 1,200–2000 mm (Frei et al., 2003).
reveal the characteristics of glacial lake temporal and spatial               The annual precipitation in the edge area varies significantly from
changes and understand the response of glacial lakes to                       that in the interior of the mountains. The elevation of 3,000 m is
climate change, as well as offer a data source for subsequent                 the maximum precipitation zone, and the annual precipitation in
glacial lake water volume estimation and outburst floods research.             the high mountains exceeds 2,500 mm (Vanham, 2012; Ács et al.,
    So far, the researches on Alps glacial lakes are sporadic and             2018). The area is home to more than 1,000 modern glaciers
regional (Buckel et al., 2018), few studies explore the spatial               covering a total area of 3,600 km2. These glaciers were mostly
distribution and dense time-series changes of glacial lakes for the           shrinking and thinning rapidly, and substantial glacial meltwater
entire Alps area, and this shortage leads to the lack of detailed             provide continuous supply for the development of glacial lakes
understanding of the changes of glacial lakes in this region.                 (Paul et al., 2020).
Recent glacier studies indicate a rapid retreat of Alps glaciers
(–39 km2 a−1) and ice thickness variations (–0.5 m a−1 to                     Data Source
–0.9 m a−1) (Huss, 2012; Zekollari et al., 2018; Sommer et al.,               We developed our glacial lake inventory of the Alps according to
2020). Rapidly melt of Alps glaciers may cause substantial                    the JRC Global Surface Water (GSW) and the Global Land
changes in glacial lakes during the past several decades.                     Analysis & Discovery (GLAD) data stored in the Google Earth
Besides, lakes connected to glaciers provide positively feedback              Engine (GEE, https://earthengine.google.com/) cloud computing
on the glacier system, resulting in changes in mass balance, and              platform for free to global users. The GSW is a spatial and
enhanced melting (Song et al., 2017). In order to deepen the                  temporal distribution map of the global surface water
understanding of the impact of glacial lakes on mountain                      generated by Pekel et al. (2016) using 4,185,439 scenes of
environment and the response to glacier change, detailed data                 Landsat images acquired between 1984 and 2019 and provides
on glacial lake evolution and their spatially and temporally                  spatial raster data on the water extent and variations. Similar to
heterogeneous changing characteristics are needed. Here, we                   the GSW data set, the GLAD data (https://www.glad.umd.edu/
aim to develop an inventory of Alps glacial lakes with the                    dataset/global-surface-water-dynamics) is generated by Pickens
maximum inundation distribution at 30 m resolution and                        et al. (2020) using a classification tree to categorize the land and
further characterize the annual variations of glacial lakes from              water in all Landsat scenes from 1999 to 2020 and perform a time-
2000 to 2019. The specific objectives of this research are as                  series analysis to produce maps that characterize inter-annual
follows: 1) to map the glacial lake inventory of annual time                  and intra-annual open surface water dynamics. The spatial

Frontiers in Earth Science | www.frontiersin.org                          2                                    August 2021 | Volume 9 | Article 723386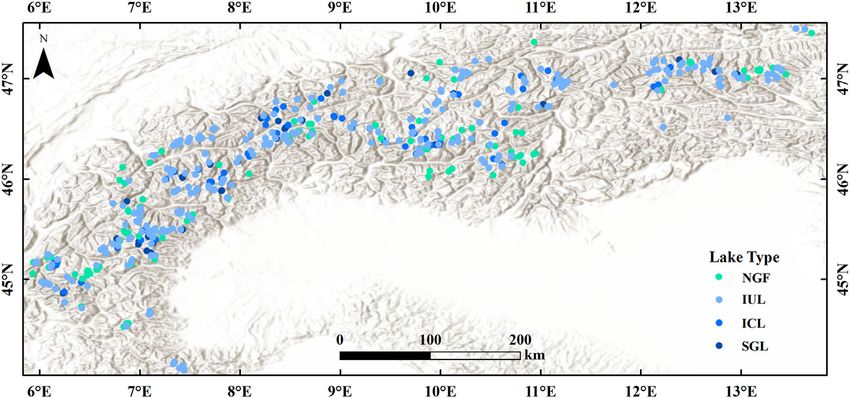
Ma et al.                                                                                                                                                Glacial Lakes in the Alps

  FIGURE 1 | Spatial distribution of Alps glacial lakes in 2019. The upper and right panels show the statistics of and glacial lake area within the 5 km buffer of glacier
  terminus at 0.25° latitude/longitude summaries.

resolution of both datasets is 30 m. In this study, the annual data                          standards of glacial lake categorization is yet to be reached.
layers of the GSW (JRC Yearly Water Classification History, v1.2)                             Researchers typically combine their research purposes and the
as the primary data source were used to map the annual areas of                              geographical conditions of the study area to establish some
glacial lakes in the Alps. To ensure the accuracy of the glacial lake                        thresholds to differentiate the glacial lakes from other natural or
inventory, we use GLAD annual data as supplementary                                          artificial lakes (Li et al., 2020). Prior studies emphasize the
information for manually inspecting and editing the mapping                                  relationship between glacial lakes and glaciers and suggest that
results from the GSW.                                                                        lakes within 3, 5, or 10 km from the margin of glaciers are regarded
   In addition, the Shuttle Radar Topography Mission (SRTM                                   as glacial lakes (Wang et al., 2013b; Worni et al., 2013; Veh et al.,
V3) digital elevation data provided by NASA JPL (http://gdex.cr.                             2018). Others define glacial lakes by setting altitude thresholds and
usgs.gov/gdex/) with a spatial resolution of up to 1 arc-second are                          other parameters (Raj and Kumar, 2016; Wang et al., 2017). The
used to extract the elevation of the glacial lakes. RGI 6.0 glacier                          extraction of glacial lakes based on altitude threshold is not
data (https://www.glims.org/RGI/) are utilized to determine the                              universal, and the approach of establishing distance buffer is
buffer range of glacial lake data distribution.                                              still a common method to extract and assist glacial lake
                                                                                             recognition. According to the visual judgement of numerous
                                                                                             glacial lake cases on the geographical location of Alps glaciers
METHODS                                                                                      and surrounding lakes, we determine that it is reasonable to map
                                                                                             glacial lakes within the distance of 5 km from the glacier termini.
Glacial Lake Area Extraction                                                                 We also conducted a procedure of quality control on the mistaken
At present, the extraction methods of glacial lakes are mainly                               or missed glacial lakes around the buffering distance by manual
divided into two categories: automatic mapping and manual                                    inspection. In addition, the glacial lake inventory aims to provide
visual interpretation. Automatic extraction algorithms have the                              basic data for the management of freshwater resources in alpine
advantages of being relatively efficient and less labor-consuming,                            regions and the research of glacial lake outburst flood (GLOFs),
but manual visual interpretation has higher accuracy and ease of                             glacial lakes with an area of more than 0.01 km2 are considered to
implementation (Huang et al., 2018); moreover, the latter is                                 be a kind of lakes that pose a threat to downstream facilities when
widely used in different regions for delineating the extent of                               dam break occurs (Worni et al., 2013; Veh et al., 2020)). Hence, we
glacial lakes (Wang et al., 2013a; Zhang et al., 2015; Wang et al.,                          established a 5-km buffer of distance to upstream glaciers and set a
2020). The public release of the GSW and GLAD data provide a                                 threshold of 0.01 km2 as the minimum area of Alps glacial lakes to
great convenience for extracting information on glacial lakes.                               exclude other water bodies in the region. In other words, we
However, the dataset maps all surface water bodies of different                              defined glacial lake as natural lake formed by glaciation, with an
types, e.g., lakes, rivers, floodplains, and paddy water bodies.                              area of greater than 0.01 km2 within 5 km from the terminal of the
Therefore, many non-lake water bodies were excluded from                                     glacier and then employ the high-resolution Google Earth imagery
glacial lakes in the study area. Manual inspection can also                                  to assist in the manual identification for improved accuracy of the
largely reduce influences of mountain shadows and exclude                                     glacial lake inventory.
other types of water bodies (such as rivers, and tectonic lakes).                                To estimate the long-term change rates of area time series, a
   The research on glacial lake has been carried out over a long                             simple and robust strategy is to calculate the annual change rate
period, but a consensus on the remote sensing-based specific                                  by referring to the observed values in starting year and ending

Frontiers in Earth Science | www.frontiersin.org                                         3                                              August 2021 | Volume 9 | Article 723386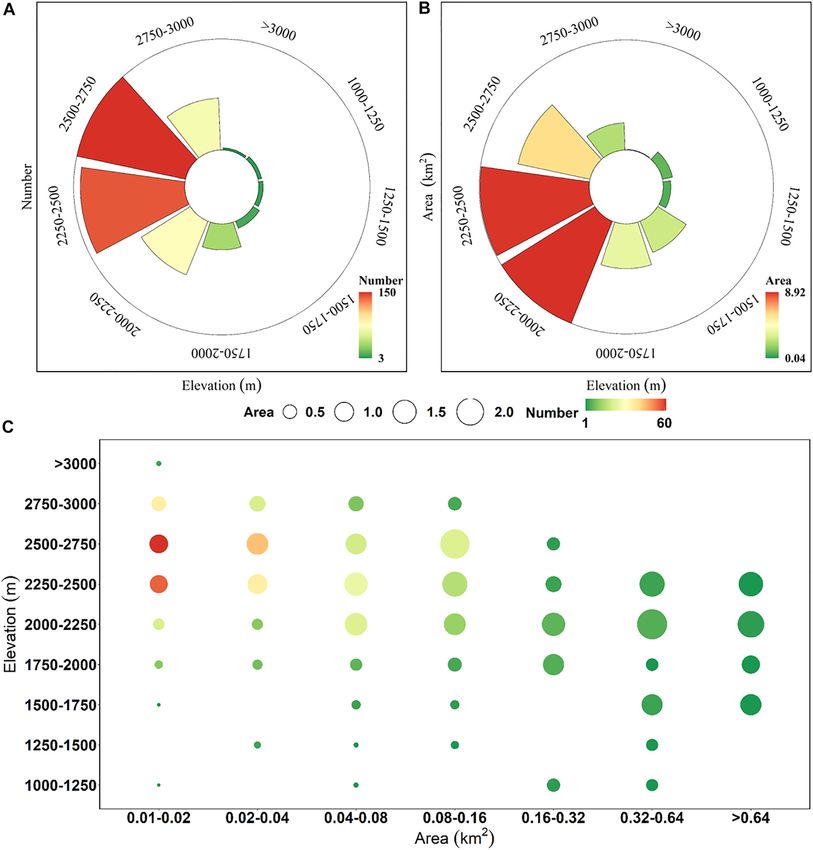
Ma et al.                                                                                                                           Glacial Lakes in the Alps

year. Specifically, the area change rate of the glacial lake in each          TABLE 1 | Uncertainty of different area scales.
period is obtained via the difference between the starting and               Lake scale (km2)                                              Uncertainty (%)
ending lake area divided by the number of years between them,
and the corresponding standard error is obtained by combining                0.01–0.02                                                           48.3
                                                                             0.02–0.04                                                           35.8
the annual glacial lake area with the multi-year average area.
                                                                             0.04–0.08                                                           26.3
                                                                             0.08–0.16                                                           19.7
Glacial Lake Classification                                                   0.16–0.32                                                           13.4
Prior studies categorize glacial lakes according to their physical           0.32–0.64                                                           11.6
characteristics, including the glacial lake size, the geometrical            >0.64                                                                7.9

relationship with modern glaciers, the geographical location of
the lake, and whether or not the lake is being fed by glacial
meltwater (Lizong et al., 2011; Song and Sheng, 2016; Yao et al.,            of ground objects in a pixel, mainly at the boundary of ground
2018). Different researchers classify glacial lakes according to             types. The existence of mixed pixels is one of the main factors
their research aims or focuses. The common approaches can be                 affecting the recognition and classification accuracy) (Hanshaw
summarized as two systems. One method is implemented on the                  and Bookhagen, 2014). In other words, the error is mainly caused
basis of the relationship between the glacial lake and glacier. For          by the spatial resolution of the image (Wang et al., 2020). Using
example, to examine the inter-annual variation characteristics of            the buffer zone of a half-pixel distance outside the boundary is
glacial lakes in HMA, Chen et al. (2020) classified glacial lakes             optimal to evaluate the uncertainty (Fujita et al., 2009; Salerno
into four categories: 1) pro-glacial lake, 2) supraglacial lake, 3)          et al., 2012). Therefore, the uncertainty of a single lake area within
unconnected glacial lake, and 4) ice-marginal lake. The other                1 standard deviation (1σ) can be expressed as (Hanshaw and
method is in accordance with the formation mechanism of glacial              Bookhagen, 2014):
lakes (Wilson et al., 2018), which enables them to be divided into
                                                                                                                 P G2
1) glacial erosion lakes, 2) moraine-dammed lakes, and 3) ice-                                    Error(1σ)       ×    × 0.6872                         (1)
blocked lake, among others. Evaluating the formation mechanism                                                   G 2
                                                                                                                 Error(1σ)
of glacial lakes on the basis of remote sensing images only is                                               R            × 100%                        (2)
generally difficult. The classification system of glacial lakes used                                                   A
in this study is developed according to the relationship between             where Error is the area error of each lake, G is the image spatial
glacial lakes and glaciers, as this mechanism reflects the important          resolution (the resolution of the dataset is 30 m), P (m) is the
role that glaciers play in the formation of glacial lakes. Wang et al.       perimeter of each lake, 0.6872 is the revised coefficient under 1σ
(2020) provides a practical reference for our classification.                 (i.e., approximately 69% of pixels conform to the error
   In this research, we divided glacial lakes into four categories: 1)       distribution), R is the uncertainty of the lake area, and A is
glacier-fed lakes (GFL, lakes fed by modern glacier meltwater)               the lake area. Table 1 shows that the uncertainty of the glacial lake
which were further divided into 1) ice-uncontacted lakes (IUL,               inventory is inversely proportional to the area size: as the size
lakes not in contact with glaciers but fed by glacier meltwater), 2)         increases, the uncertainty gradually decreases. In addition, the
ice-contacted lakes (ICL, lakes that are in close contact with a             uncertainty of the glacial lake area extraction is approximately
glacier terminal), and 3) supraglacial lakes (SGL, lakes developed           50% when the lake area is 0.01 km2. Therefore, the minimum area
on glacier surfaces); and 2) non-glacier-fed lakes (NGFL, lakes are          of 0.01 km2 was set as the threshold in this work, and this
formed due to the historical glacial movements and are not fed by            approach improved the accuracy of the inventory to a certain
modern glacial meltwater). To obtain reliable classification                  extent. Overall, the mean uncertainty of the inventory in the Alps
results, the glacial lakes are manually distinguished by using               is approximately 20.5% (The uncertainty in the study region is
high-resolution imagery from Google and Bing and the glacier                 dominated by small lakes, yet the result is acceptable).
data of RGI 6.0 (Pfeffer et al., 2014).

Uncertainty Estimation                                                       RESULTS AND DISCUSSIONS
Given the impact of remote sensing image quality (such as spatial
resolution, mountain shadow, cloud cover, and water extraction               Characteristics of the Spatial Distribution of
algorithm, etc.,), the interpreters’ prior knowledge, and the                Glacial Lakes in the Alps
definition of glacial lake, errors inevitably occur when                      A total of 498 glacial lakes (>0.01 km2) were identified in 2019 by
extracting glacial lake information (Zhang et al., 2015; Li et al.,          using remote sensing data products and cover a net area of
2020). In this study, we used a semiautomatic method to map the              33.77 ± 6.94 km2. Glacial lakes are widely distributed across
glacial lake inventory, and every lake was manually validated and            the Alps, and several of the largest glacial lakes (>1 km2) in
edited. However, no appropriate and quantifiable uncertainty                  the study area are mainly concentrated in the western and central
estimation exists for the error caused by artificial correction               regions (Figure 1). On the whole, the Alps are dominated by
process and the definition of glacial lake. To improve the                    small glacial lakes, and all glacial lakes are in the size range of
credibility of the inventory, recheck it is necessary. Previous              0.01–1.59 km2. Glacial lakes less than 0.1 km2 account for 86.3%
studies have shown that the mixed pixel is the key factor of                 of all the glacial lakes of the inventory in number, but their area is
error sources (Mixed pixel refers to the existence of different types        only 41.8% of the total. Only 68 glacial lakes exceed 0.1 km2, yet

Frontiers in Earth Science | www.frontiersin.org                         4                                           August 2021 | Volume 9 | Article 723386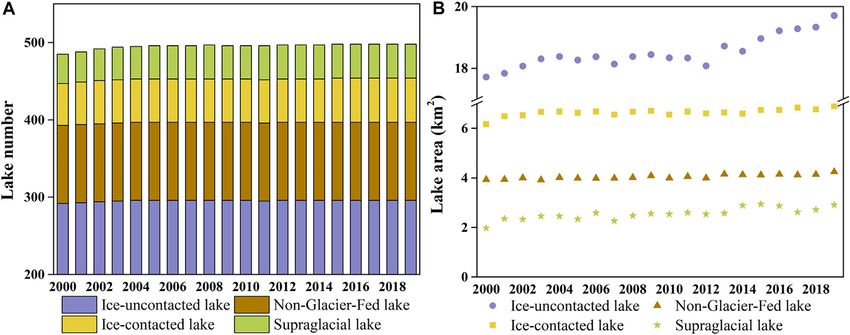
Ma et al.                                                                                                                    Glacial Lakes in the Alps

  FIGURE 2 | Spatial distribution of four types of glacial lakes.

they account for 58.2% of the total area. Therefore, although               approximately 2,600 m a.s.l. However, IUL and NGFL have more
many small glacial lakes exist in the Alps, the total area of glacial       discrete elevation distributions, with lower mean elevations
lakes in the region is still dominated by relatively large lakes.           (2,400 m and 2,100 m, respectively). NGFL are particularly
   Figure 2 presents the spatial distribution of glacial lakes of           prominent as products of pre-glacial movement.
different types. GFL are dominant in number and area, and
NGFL are in the minority. Specifically, the number of IUL take
the leading position, accounting for approximately 59.4%.                   Number and Area Changes of Glacial Lakes
NGFL, ICL and SGL account for 20.4, 11.4 and 8.8%,                          in the Alps
respectively. In terms of area, the four types (IUL, NGFL,                  We further obtained the annual glacial lake areas (>0.01 km2)
ICL, and SGL) of glacial lakes account for 58.4, 12.6, 20.4,                in the Alps from 2000 to 2019. During that period, the number
8.6, and 12.6%, respectively. Compared with other lakes, ICL                and area of glacial lakes present an ascending tendency
have larger sizes, probably because they are connected with the             (Figure 5), yet the increasing rates varied between different
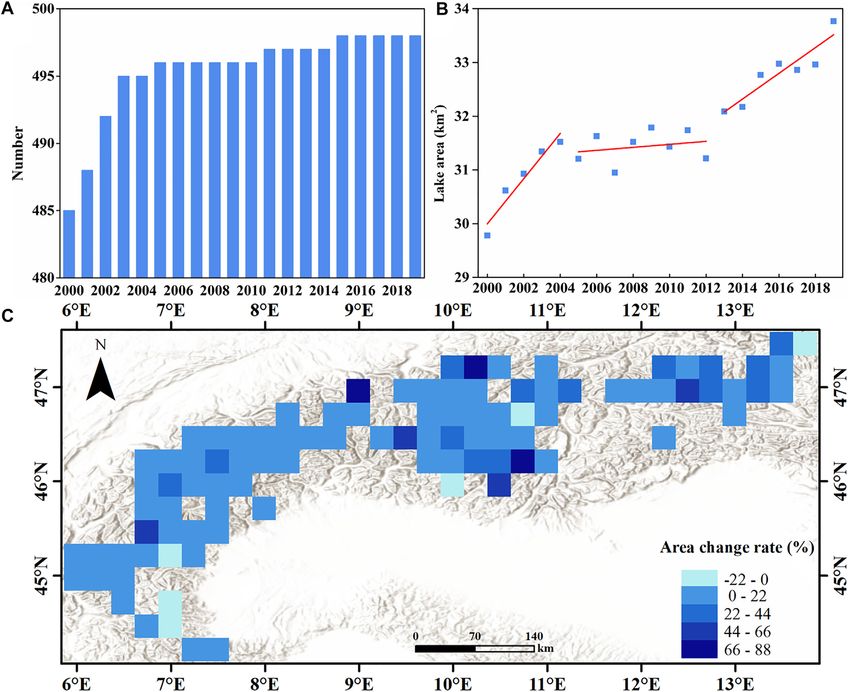
glacier termini and can evolve with the retreating of glaciers.             periods. There were 485 and 498 glacial lakes in 2000 and 2019,
Compared with ICL, SGL do not exist all year round and their                respectively. The total area of the glacial lakes in the study
area fluctuation is evident.                                                 region increased from 29.78 ± 6.48 km2 in 2000 to 33.77 ±
   The elevation bins by the step of 250 m were defined to analyze           6.94 km2 in 2019 and expanded by approximately 3.99 ±
the dependence of glacial lake distribution on elevation. Figure 3          0.46 km2 (by 13%). During the sub-period of 2000–2004,
shows the distribution of the Alps’ glacial lakes in different              the quantity and total area of glacial lakes presented
elevation zones. As the altitude increases, the quantity and                relatively more rapid increases, with an increase of 1.74 ±
area of glacial lakes are approximately normally distributed.               0.21 km2 (5.8%) and an annual growth rate of 0.44 ±
The altitudes of all glacial lakes mapped in 2019 ranged from               0.07 km2 a−1. During 2005–2012, the number and area of
1,060 m a.s.l. (above sea level) to 3,133 m a.s.l., of which 72% are        glacial lakes were relatively stable. From 2013 to 2019, the
distributed at the altitude belt of 2,250–2,750 m a.s.l., with a mean       number of glacial lakes changed gradually and the area
of 2,410 m. The lakes between 2000 and 2,500 m also have the                increased rapidly, increasing by 1.68 ± 0.20 km2 (5.2%) with
largest proportion in area, accounting for 70.3%. Further analysis          an annual growth rate of 0.28 ± 0.05 km2 a−1.
reveals that in different elevation bins, the distribution of glacial          Overall, the majority of glacial regions experienced glacial lake
lakes at different sizes is also uneven and vary greatly (Figure 3C).       growth during the study period (Shugar et al., 2020), particularly
Glacial lakes predominantly range from 2000 m to 2,750 m, and               in the central Alps. However, some separate districts recorded a
most are small lakes (≤0.04 km2), with the larger lakes distributed         decrease in glacial lake area (light-blue grid cell in Figure 5C) and
in relatively low altitude regions (Song and Sheng, 2016) mainly            were mainly affected by some large NGFL.
because the land is flat in the area with low altitude, thereby                 Globally, the number of available lake inventories has
providing a good water storage environment for some large                   gradually increased recently, the glacial lake inventory from
NGFL and a few IUL.                                                         individual basin (Kumar et al., 2020) to long-time series and
   In addition, the distribution of glacial lakes varies with the           global scale (Shugar et al., 2020) deepens the understanding of the
types of glacial lakes given the influence of glacial movement and           evolution differences of glacial lakes in different regions, so as to
action (Figure 4). Among the lakes, ICL and SGL are closely                 better constrain and simulate the hydrological response of
related to glaciers and therefore have a higher and more                    glaciers to climate change (Wood et al., 2021). we discover
concentrated elevation distribution, with a mean elevation of               that, compared with those of other regions with glacial lake

Frontiers in Earth Science | www.frontiersin.org                        5                                     August 2021 | Volume 9 | Article 723386
Ma et al.                                                                                                                                          Glacial Lakes in the Alps

  FIGURE 3 | Number (A) and area (B) of glacial lakes grouped into different elevation bins, (C) the distribution of glacial lakes at different scales in 2019.

distributions such as the Andes (the total area of glacial lake                          identification and statistical years, the actual results may be a
increased by 14% from 2000 to 2016, excluding Lake Argentino,                            little biased.).
Lake Viedma, Lake O’Higgins/San Martín) (Wilson et al., 2018)
and Nepal (increased by approximately 17% from 1997 to 2017)
(Haritashya et al., 2018), the change rate of Alps’ glacial lakes in                     Changes in the Water Volume of Glacial
the recent years seems to be relatively slow. However, compared                          Lakes
with Alaska (Shugar et al., 2020) and Himalayas (increased by                            The “real” water volume of a glacial lake can be calculated by
5% from 2000 to 2015) (Nie et al., 2017), the change rate seems                          combining the water level and shoreline data and accurate lake
to be relatively fast (Due to the difference of glacial lake                             bathymetry. However, most glacial lakes are located in harsh

Frontiers in Earth Science | www.frontiersin.org                                     6                                            August 2021 | Volume 9 | Article 723386
Ma et al.                                                                                                                                           Glacial Lakes in the Alps

                                                                                          environments and remote areas, making the field
                                                                                          measurements of glacial lake depths difficult and
                                                                                          infeasible. Therefore, the empirical model fitted by the
                                                                                          relationship of glacial lake area-depth-volume is a
                                                                                          commonly-used method for estimating the glacial lake water
                                                                                          volume on regional scale. The water volume estimation model
                                                                                          (Eq. 3) of glacial lakes proposed by Cook and Quincey, (2015) has
                                                                                          strong applicability to the Alps.
                                                                                                                     V  0.1217 p A1.4129                                (3)
                                                                                          Where V and A represent the water volume and area of each lake,
                                                                                          respectively. Substantial retreat and downwasting of glaciers have
                                                                                          occurred in the Alps since the Little Ice Age due to global
                                                                                          warming and is expected to exacerbate. Accelerated glacier
                                                                                          shrinkage has been reported over the past few decades. In the
                                                                                          first 5 years of the 21st Century, the mass-change rate was close to
  FIGURE 4 | Glacial lake elevation by type in 2019. The dots represent the
                                                                                          −1 m w.e.a−1 (Huss, 2012); from 2000 to 2012, it was
  mean value.
                                                                                          –0.71 m w.e.a−1 (Sommer et al., 2020). The glacier mass

  FIGURE 5 | Changes in the number (A) and area (B) of glacial lakes in the Alps from 2000 to 2019 and percent area change, (C) per 2.5° latitude and longitude bins
  with 2.5° latitude/longitude summaries.

Frontiers in Earth Science | www.frontiersin.org                                      7                                            August 2021 | Volume 9 | Article 723386
Ma et al. Glacial Lakes in the Alps
Heterogeneous Changes of Glacial Lakes
by Different Types
Differences in the area changes of the four types of glacial lakes
were further examined as illustrated in Figure 7. During the study
period, the number and area of GFL increased rapidly because of
the influence of glacier retreating and glacial meltwater supply,
while that of NGFL were relatively stable (Figure 7). The number
of GFL increased from 384 in 2000 to 397 in 2019, and their area
expanded from 25.85 ± 5.39 km2 in 2000 to 29.52 ± 5.81 km2 in
2019, with an increase of 3.67 km2 (+14.2%). By contrast, the
differences in the numbers (+0) and area (+0.32 km2, +8%) of
NGFL during 2000–2019 varied slightly given the absence of the
influence of modern glaciation.
For the past 2 decades, SGL were closely related to glacier
changes and were vulnerable to glacier ablation and precipitation
given their small sizes. As a result, they have the highest rate of
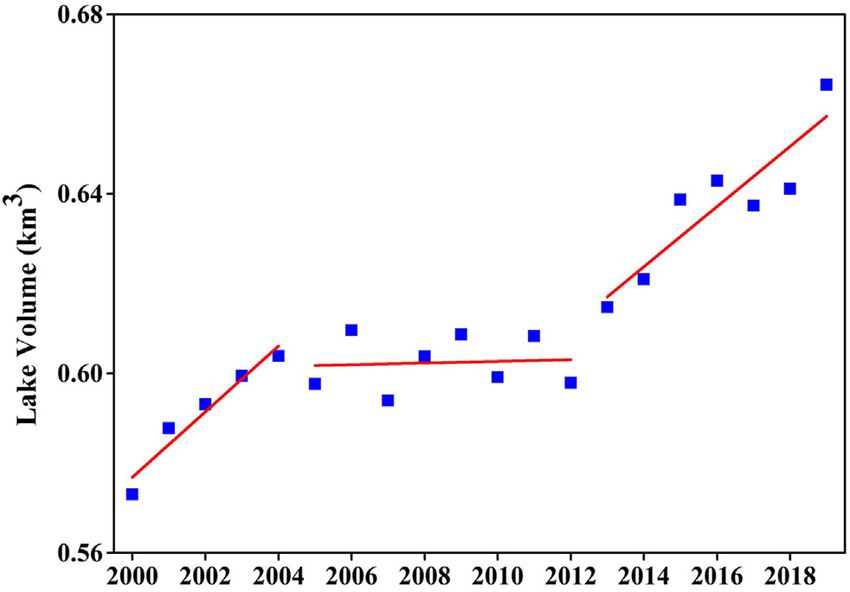
FIGURE 6 | Changes in glacial lake water volume from 2000 to 2019.
change in area (+47%), as well as large inter-annual fluctuations in
area. Except for the case with SGL, the glacier terminus retreats
faster and the glacial meltwater increases due to the rising
change rate decreased to –0.5 m w.e.a−1 from 2006 to 2016 temperature, thereby providing a favorable condition for the
(Zemp et al., 2019). Then, the glacier mass entered a period expansions of IUL and ICL (their area growth percentages were
of rapid retreat (Zekollari et al., 2018; Carrivick et al., 2020), this 11 and 12%, respectively). A feedback relationship also occurs
outcome is consistent with research findings which show several between glacial lakes and glaciers. First, as the product of glacier
years of record-breaking volume loss and glacier retreat after movement, glacial lakes receive energy and materials transported by
2012 (2015 and 2018) (Zekollari et al., 2020). Referring to the glaciers and can highly respond to the changes of glaciers. Second,
glacier mass changes reported recently suggest that the changing the expansion of glacial lakes connected with glaciers accelerated the
tendency of glacial lakes in the Alps is generally consistent with melting of glaciers while also indirectly promoting the appearance
the temporal patterns of negative glacier mass balance. The of new and higher elevation glacial lakes (mainly ICL) at the end of
volume change of a glacial lake was similar to its area change and the glacier and the conversion between glacial lakes (transformation
generally behaves in a three-stage evolution trajectory from SGL to ICL or ICL to IUL).
(Figure 6). During the study period, lake volumes increased
from 0.57 to 0.66 km3 mainly in the two sub-periods of Comparison of Inventoried Glacial Lakes With
2000–2004 and 2013–2019, with growth rates of 5 and 8%, Previous Study
respectively. From 2005 to 2012, the total water volume of We compared our glacial lake inventory with that of Buckel
glacial lakes was relatively stable. et al. (2018) for the same period over the approximately same
FIGURE 7 | Number (A) and area (B) change of four types glacial lakes.
Frontiers in Earth Science | www.frontiersin.org 8 August 2021 | Volume 9 | Article 723386Ma et al. Glacial Lakes in the Alps
extent. Our inventory includes 84 glacial lakes (≥0.02 km2) mass balance. Glacier retreating and additional meltwater supply
with a total area of 6.33 ± 1.28 km2, while the artificially could play a leading role in the area expansion of most glacial
interpreted inventory of Buckel et al. (2018) contains 105 lakes. During the study period, the quantity and area of glacial
glacial lakes (≥0.02 km2) with a total area of 6.26 km2. The lakes show an increasing tendency, while the expansion varied
differences of glacial lakes between these two inventories are 21 between different periods. The area shows a three-stage trend
and 0.07 km2 in the total number and area, respectively. Some whereby the glacial lake expansion is fast in the first 5 years and
of reasons for the missed glacial lakes in our inventory are the the last 7 years (with an annual growth rate of 0.44 ±
interference of some not-so-great observations (shade or 0.07 km2 a−1 and 0.28 ± 0.05 km2 a−1) and remained relatively
snow), identification criteria for glacial lakes, and a few stable between 2005 and 2012. The water volume and area of the
glacial lakes that have dried up. The major reason for the glacial lake in the region are similar and reveal a consistent trend
shortage of glacial lake inventory is the difference of extraction of change.
methods. Different from our glacial lake inventory, Buckel The number and area of glacier-fed lakes increased rapidly
mapped Austria glacial lakes by manual digitization using during the study period because of the influence of glacier retreat
multi- source remote sensing image, such as Google Earth, and glacial meltwater supply, while those of non-glacier-fed lakes
Esri World Imagery, and Orthofoto Österreich. were relatively stable. For the past 2 decades, the area change rate
In short, the semi-automatic method shows unprecedented of supraglacial lakes is the largest percentage (+47%). Given the
advantages in glacial lake extraction efficiency. However, in rapid melting of glaciers, several glacial lakes are undergoing
terms of extraction accuracy, it is slightly insufficient compared irreversible changes.
with the manual digitization method. It cannot be ignored that In summary, this study attempted to produce a complete
the integrity and availability of data sources fundamentally glacial lake inventory in the Alps and examined the dense
affect the extraction of glacial lakes. Lake mapping using time-series of lake area changes linked to glacier retreating
satellite images and orthophotos from multiple sources from through detailed classification of glacial lakes. This work is
different years is also a vital channel to map a complete glacial expected to provide basic data and information for cryospheric
lake inventory. hydrology research, water resource utilization and management,
and glacier hazard assessment in the Alps.
CONCLUSION
DATA AVAILABILITY STATEMENT
Glacial lakes in the alpine regions are highly sensitive to glacier mass
evolution and climate change. However, the research on the spatial The original contributions presented in the study are included in
distribution and temporal evolution of various types of glacial lakes the article/Supplementary Material, further inquiries can be
in the Alps still lacks a holistic view. Through a semi-automatic directed to the corresponding author.
approach, we used remote sensing products (the GSW and GLAD)
to map annual glacial lakes and compiled an inventory of these
lakes in the Alps. Our results show that 498 glacial lakes AUTHOR CONTRIBUTIONS
(>0.01 km2) were identified in 2019 using remote sensing data
within the study area, covering a total area of 33.77 ± 6.94 km2. The JM and CS led the writing of the manuscript. YW made valuable
glacial lakes are widely distributed and concentrated mainly in the comments on the manuscript. All co-authors contributed to the
western and central regions of the Alps. On the whole, the Alps are manuscript.
dominated by small glacial lakes in number, with all glacial lakes in
the size range of 0.01–1.59 km2. The differences among different
types of glacial lakes are also significant. Glacier-fed lakes are FUNDING
dominant in both number and total area, and non-glacier-fed lakes
are in the minority. Among all the lakes, ice-uncontacted lakes This work was partly funded by the Second Tibetan Plateau Scientific
occupy the leading position in number and area, accounting for Expedition and Research (2019QZKK0202), the National Key Research
59.4 and 58.4%, respectively. In terms of the elevation distribution, and Development Program of China (Grant No. 2019YFA0607101,
almost half of the lakes are concentrated between 2,250 and 2018YFD0900804, 2018YFD1100101), the Thousand Young Talents
2,750 m above sea level. Meanwhile, the mean elevation of the Program in China (Grant No. Y7QR011001), the Strategic Priority
small glacial lakes is higher, and the larger lakes are distributed in Research Program of the Chinese Academy of Sciences (Grant No.
relatively low altitude regions. The distributions of ice-contacted XDA23100102), and the National Natural Science Foundation of China
lakes and supraglacial lakes were more concentrated, and their (No. 41971403, 41801321).
mean elevations were higher. However, ice-uncontacted lakes and
non-glacier-fed lakes have more discrete altitude distributions with
lower mean elevations. ACKNOWLEDGMENTS
Referring to the glacier mass changes reported recently
indicate that the changing tendency of glacial lakes in Alps is We are grateful to the satellite data providers: USGS for
generally consistent with the temporal patterns of negative glacier Landsat, JPL/NASA for SRTM, and EARTHDATA for
Frontiers in Earth Science | www.frontiersin.org 9 August 2021 | Volume 9 | Article 723386Ma et al. Glacial Lakes in the Alps
RGI. We are also grateful to YW for numerous fruitful SUPPLEMENTARY MATERIAL
discussions, advice, and comments on the present article.
Finally, we are grateful to the scientific editor and the The Supplementary Material for this article can be found online at:
reviewers for their careful review of the article used to https://www.frontiersin.org/articles/10.3389/feart.2021.723386/
improve the study. full#supplementary-material
Khadka, N., Zhang, G., and Thakuri, S. (2018). Glacial Lakes in the Nepal
REFERENCES Himalaya: Inventory and Decadal Dynamics (1977-2017). Remote Sensing.
10, 1913. doi:10.3390/rs10121913
Ács, F., Takács, D., Breuer, H., and Skarbit, N. (2018). Climate and Climate Change Kumar, R., Bahuguna, I. M., Ali, S. N., and Singh, R. (2020). Lake Inventory and
in the Austrian-Swiss Region of the European Alps During the Twentieth Evolution of Glacial Lakes in the Nubra-Shyok Basin of Karakoram Range.
Century According to Feddema. Theor. Appl. Climatol. 133, 899–910. Earth Syst. Environ. 4, 57–70. doi:10.1007/s41748-019-00129-6
doi:10.1007/s00704-017-2230-6 Li, D., Shangguan, D., and Anjum, M. N. (2020). Glacial Lake Inventory Derived
Allen, S. K., Zhang, G., Wang, W., Yao, T., and Bolch, T. (2019). Potentially From Landsat 8 OLI in 2016-2018 in China-Pakistan Economic Corridor. Inter.
Dangerous Glacial Lakes Across the Tibetan Plateau Revealed Using a Large- J. Geo-Info. 9, 294. doi:10.3390/ijgi9050294
Scale Automated Assessment Approach. Sci. Bull. 64, 435–445. doi:10.1016/ Lizong, W., Xin, L., Shiyin, L., Mool, P. K., Joshi, S., and Bajracharya, S. (2011).
j.scib.2019.03.011 “Remote Sensing Based Glacial Lake Inventory in the Hindu Kush-Himalaya
Auer, I., Böhm, R., Jurkovic, A., Lipa, W., Orlik, A., Potzmann, R., et al. (2007). Region,” in Paper presented at the 2011 International Conference on Remote
HISTALP-Historical Instrumental Climatological Surface Time Series of the Sensing, Environment and Transportation Engineering.
Greater Alpine Region. Int. J. Climatol. 27, 17–46. doi:10.1002/joc.1377 Nie, Y., Sheng, Y., Liu, Q., Liu, L., Liu, S., Zhang, Y., et al. (2017). A Regional-Scale
Begam, S., and Sen, D. (2019). Mapping of Moraine Dammed Glacial Lakes Assessment of Himalayan Glacial Lake Changes Using Satellite Observations
and Assessment of Their Areal Changes in the Central and Eastern From 1990 to 2015. Remote Sensing Environ. 189, 1–13. doi:10.1016/
Himalayas Using Satellite Data. J. Mt. Sci. 16, 77–94. doi:10.1007/ j.rse.2016.11.008
s11629-018-5023-1 Paul, F., Rastner, P., Azzoni, R. S., Diolaiuti, G., Fugazza, D., Le Bris, R., et al.
Buckel, J., Otto, J. C., Prasicek, G., and Keuschnig, M. (2018). Glacial Lakes in (2020). Glacier Shrinkage in the Alps Continues Unabated as Revealed by a
Austria - Distribution and Formation Since the Little Ice Age. Glob. Planet. New Glacier Inventory From Sentinel-2. Earth Syst. Sci. Data. 12, 1805–1821.
Change. 164, 39–51. doi:10.1016/j.gloplacha.2018.03.003 doi:10.5194/essd-12-1805-2020
Carrivick, J. L., James, W. H. M., Grimes, M., Sutherland, J. L., and Lorrey, A. M. Pekel, J.-F., Cottam, A., Gorelick, N., and Belward, A. S. (2016). High-Resolution
(2020). Ice Thickness and Volume Changes across the Southern Alps, Mapping of Global Surface Water and its Long-Term Changes. Nature. 540,
New Zealand, from the Little Ice Age to Present. Sci. Rep. 10, 13392. 418–422. doi:10.1038/nature20584
doi:10.1038/s41598-020-70276-8 Petrov, M. A., Sabitov, T. Y., Tomashevskaya, I. G., Glazirin, G. E., Chernomorets,
Che, T., Xiao, L., and Liou, Y.-A. (2014). Changes in Glaciers and Glacial Lakes and S. S., Savernyuk, E. A., et al. (2017). Glacial Lake Inventory and Lake Outburst
the Identification of Dangerous Glacial Lakes in the Pumqu River Basin, Xizang Potential in Uzbekistan. Sci. Total Environ. 592, 228–242. doi:10.1016/
(Tibet). Adv. Meteorology. 2014, 1–8. doi:10.1155/2014/903709 j.scitotenv.2017.03.068
Chen, F., Zhang, M., Guo, H., Allen, S., Kargel, J. S., Haritashya, U. K., et al. (2020). Pfeffer, W. T., Arendt, A. A., Arendt, A., Bolch, T., Cogley, J. G., Gardner, A. S.,
Annual 30-Meter Dataset for Glacial Lakes in High Mountain Asia From 2008 et al. (2014). The Randolph Glacier Inventory: a Globally Complete Inventory
to 2017. Earth Syst. Sci. Data. 13, 741–766. doi:10.5194/essd-2020-57 of Glaciers. J. Glaciol. 60, 537–552. doi:10.3189/2014JoG13J176
Cook, S. J., and Quincey, D. J. (2015). Estimating the Volume of Alpine Glacial Pickens, A. H., Hansen, M. C., Hancher, M., Stehman, S. V., Tyukavina, A.,
Lakes. Earth Surf. Dynam. 3, 559–575. doi:10.5194/esurf-3-559-2015 Potapov, P., et al. (2020). Mapping and Sampling to Characterize Global Inland
Dubey, S., and Goyal, M. K. (2020). Glacial Lake Outburst Flood Hazard, Water Dynamics from 1999 to 2018 With Full Landsat Time-Series. Remote
Downstream Impact, and Risk over the Indian Himalayas. Water Resour. Sensing Environ. 243, 111792. doi:10.1016/j.rse.2020.111792
Res. 56, e2019WR026533. doi:10.1029/2019wr026533 Raj, K. B. G., and Kumar, K. V. (2016). Inventory of Glacial Lakes and its Evolution
Fischer, M., Huss, M., and Hoelzle, M. (2015). Surface Elevation and Mass Changes in Uttarakhand Himalaya Using Time Series Satellite Data. J. Indian Soc.
of All Swiss Glaciers 1980-2010. The Cryosphere. 9, 525–540. doi:10.5194/tc-9- Remote Sens. 44, 959–976. doi:10.1007/s12524-016-0560-y
525-2015 Salerno, F., Thakuri, S., D’Agata, C., Smiraglia, C., Manfredi, E. C., Viviano, G.,
Frei, C., Christensen, J. H., Déqué, M., Jacob, D., Jones, R. G., and Vidale, P. L. et al. (2012). Glacial Lake Distribution in the Mount Everest Region:
(2003). Daily Precipitation Statistics in Regional Climate Models: Evaluation Uncertainty of Measurement and Conditions of Formation. Glob. Planet.
and Intercomparison for the European Alps. J. Geophys. Res. 108, a–n. Change. 92-93, 30–39. doi:10.1016/j.gloplacha.2012.04.001
doi:10.1029/2002JD002287 Shugar, D. H., Burr, A., Haritashya, U. K., Kargel, J. S., Watson, C. S., Kennedy, M.
Fujita, K., Sakai, A., Nuimura, T., Yamaguchi, S., and Sharma, R. R. (2009). Recent C., et al. (2020). Rapid WorldWide Growth of Glacial Lakes Since 1990. Nat.
Changes in Imja Glacial Lake and its Damming Moraine in the Nepal Himalaya Clim. Chang. 10, 939–945. doi:10.1038/s41558-020-0855-4
Revealed by In Situ Surveys and Multi-Temporal ASTER Imagery. Environ. Res. Sommer, C., Malz, P., Seehaus, T. C., Lippl, S., Zemp, M., and Braun, M. H.
Lett. 4, 045205. doi:10.1088/1748-9326/4/4/045205 (2020). Rapid Glacier Retreat and Downwasting Throughout the European
Hanshaw, M. N., and Bookhagen, B. (2014). Glacial Areas, lake Areas, and Snow Alps in the Early 21st Century. Nat. Commun. 11, 3209. doi:10.1038/s41467-
Lines From 1975 to 2012: Status of the Cordillera Vilcanota, Including the 020-16818-0
Quelccaya Ice Cap, Northern central Andes, Peru. The Cryosphere. 8, 359–376. Song, C., and Sheng, Y. (2016). Contrasting Evolution Patterns Between Glacier-
doi:10.5194/tc-8-359-2014 Fed and Non-Glacier-fed Lakes in the Tanggula Mountains and Climate Cause
Haritashya, U., Kargel, J., Shugar, D., Leonard, G., Strattman, K., Watson, C., et al. Analysis. Climatic Change. 135, 493–507. doi:10.1007/s10584-015-1578-9
(2018). Evolution and Controls of Large Glacial Lakes in the Nepal Himalaya. Song, C., Sheng, Y., Ke, L., Nie, Y., and Wang, J. (2016). Glacial lake Evolution in
Remote Sensing. 10, 798. doi:10.3390/rs10050798 the Southeastern Tibetan Plateau and the Cause of Rapid Expansion of
Huang, C., Chen, Y., Zhang, S., and Wu, J. (2018). Detecting, Extracting, and Proglacial Lakes Linked to Glacial-Hydrogeomorphic Processes. J. Hydrol.
Monitoring Surface Water From Space Using Optical Sensors: A Review. Rev. 540, 504–514. doi:10.1016/j.jhydrol.2016.06.054
Geophys. 56, 333–360. doi:10.1029/2018rg000598 Song, C., Sheng, Y., Wang, J., Ke, L., Madson, A., and Nie, Y. (2017). Heterogeneous
Huss, M. (2012). Extrapolating Glacier Mass Balance to the Mountain-Range Scale: Glacial lake Changes and Links of lake Expansions to the Rapid Thinning of
the European Alps 1900-2100. The Cryosphere. 6, 713–727. doi:10.5194/tc-6- Adjacent Glacier Termini in the Himalayas. Geomorphology. 280, 30–38.
713-2012 doi:10.1016/j.geomorph.2016.12.002
Frontiers in Earth Science | www.frontiersin.org 10 August 2021 | Volume 9 | Article 723386Ma et al. Glacial Lakes in the Alps Vanham, D. (2012). The Alps Under Climate Change: Implications for Water Yao, X., Liu, S., Han, L., Sun, M., and Zhao, L. (2018). Definition and Classification Management in Europe. J. Water Clim. Change. 3, 197–206. doi:10.2166/ System of Glacial Lake for Inventory and Hazards Study. J. Geogr. Sci. 28, wcc.2012.032 193–205. doi:10.1007/s11442-018-1467-z Veettil, B. K., Bianchini, N., de Andrade, A. M., Bremer, U. F., Simões, J. C., and de Zekollari, H., Huss, M., and Farinotti, D. (2018). Modelling the Future Evolution of Souza Junior, E. (2016). Glacier Changes and Related Glacial lake Expansion in Glaciers in the European Alps Under the EURO-CORDEX RCM Ensemble. the Bhutan Himalaya, 1990-2010. Reg. Environ. Change. 16, 1267–1278. Cryosphere Discuss. 13, 1125–1146. doi:10.5194/tc-13-1125-2019 doi:10.1007/s10113-015-0853-7 Zekollari, H., Huss, M., and Farinotti, D. (2020). On the Imbalance and Response Veh, G., Korup, O., Roessner, S., and Walz, A. (2018). Detecting Himalayan Glacial Time of Glaciers in the European Alps. Geophys. Res. Lett. 47, e2019GL085578. Lake Outburst Floods From Landsat Time Series. Remote Sensing Environ. 207, doi:10.1029/2019GL085578 84–97. doi:10.1016/j.rse.2017.12.025 Zemp, M., Frey, H., Gärtner-Roer, I., Nussbaumer, S. U., Hoelzle, M., Paul, F., et al. Veh, G., Korup, O., and Walz, A. (2020). Hazard From Himalayan Glacier Lake (2015). Historically Unprecedented Global Glacier Decline in the Early 21st Outburst Floods. Proc. Natl. Acad. Sci. USA. 117, 907–912. doi:10.1073/ century. J. Glaciol. 61, 745–762. doi:10.3189/2015JoG15J017 pnas.1914898117 Zemp, M., Haeberli, W., Hoelzle, M., and Paul, F. (2006). Alpine Glaciers to Disappear Wang, X., Chai, K., Liu, S., Wei, J., Jiang, Z., and Liu, Q. (2017). Changes of Glaciers Within Decades? Geophys. Res. Lett. 33, L13504. doi:10.1029/2006gl026319 and Glacial Lakes Implying Corridor-Barrier Effects and Climate Change in the Zemp, M., Huss, M., Huss, E., Eckert, N., McNabb, R., Huber, J., et al. (2019). Hengduan Shan, southeastern Tibetan Plateau. J. Glaciol. 63, 535–542. Global Glacier Mass Changes and Their Contributions to Sea-Level Rise From doi:10.1017/jog.2017.14 1961 to 2016. Nature. 568, 382–386. doi:10.1038/s41586-019-1071-0 Wang, X., Ding, Y., Liu, S., Jiang, L., Wu, K., Jiang, Z., et al. (2013a). Changes of Zhang, G., Yao, T., Xie, H., Wang, W., and Yang, W. (2015). An Inventory of Glacial Lakes and Implications in Tian Shan, Central Asia, Based on Remote Glacial Lakes in the Third Pole Region and Their Changes in Response to Sensing Data From 1990 to 2010. Environ. Res. Lett. 8, 044052. doi:10.1088/ Global Warming. Glob. Planet. Change. 131, 148–157. doi:10.1016/ 1748-9326/8/4/044052 j.gloplacha.2015.05.013 Wang, X., Siegert, F., Siegert, A.-g., and Franke, J. (2013b). Glacier and Glacial Lake Changes and Their Relationship in the Context of Climate Change, Central Conflict of Interest: The authors declare that the research was conducted in the Tibetan Plateau 1972-2010. Glob. Planet. Change. 111, 246–257. doi:10.1016/ absence of any commercial or financial relationships that could be construed as a j.gloplacha.2013.09.011 potential conflict of interest. Wang, X., Guo, X., Yang, C., Liu, Q., Wei, J., Zhang, Y., et al. (2020). Glacial Lake Inventory of High-Mountain Asia in 1990 and 2018 Derived From Landsat Publisher’s Note: All claims expressed in this article are solely those of the authors Images. Earth Syst. Sci. Data. 12, 2169–2182. doi:10.5194/essd-12-2169-2020 and do not necessarily represent those of their affiliated organizations, or those of Wilson, R., Glasser, N. F., Reynolds, J. M., Harrison, S., Anacona, P. I., Schaefer, M., the publisher, the editors and the reviewers. Any product that may be evaluated in et al. (2018). Glacial Lakes of the Central and Patagonian Andes. Glob. Planet. this article, or claim that may be made by its manufacturer, is not guaranteed or Change. 162, 275–291. doi:10.1016/j.gloplacha.2018.01.004 endorsed by the publisher. Wood, J. L., Harrison, S., Wilson, R., Emmer, A., Yarleque, C., Glasser, N. F., et al. (2021). Contemporary Glacial Lakes in the Peruvian Andes. Glob. Planet. Copyright © 2021 Ma, Song and Wang. This is an open-access article distributed Change. 204, 103574. doi:10.1016/j.gloplacha.2021.103574 under the terms of the Creative Commons Attribution License (CC BY). The use, Worni, R., Huggel, C., and Stoffel, M. (2013). Glacial Lakes in the Indian Himalayas - distribution or reproduction in other forums is permitted, provided the original From an Area-Wide Glacial Lake Inventory to On-Site and Modeling Based Risk author(s) and the copyright owner(s) are credited and that the original publication Assessment of Critical Glacial Lakes. Sci. Total Environ. 468-469, S71–S84. in this journal is cited, in accordance with accepted academic practice. No use, doi:10.1016/j.scitotenv.2012.11.043 distribution or reproduction is permitted which does not comply with these terms. Frontiers in Earth Science | www.frontiersin.org 11 August 2021 | Volume 9 | Article 723386
You can also read


