Book Chapter Inhibitory Effects of Eucalyptus and Banaba Leaf Extracts on Nonalcoholic Steatohepatitis Induced by a High-Fructose/High-Glucose ...
←
→
Page content transcription
If your browser does not render page correctly, please read the page content below
Prime Archives in Biomedical Sciences

Book Chapter

Inhibitory Effects of Eucalyptus and
Banaba Leaf Extracts on Nonalcoholic
Steatohepatitis Induced by a High-
Fructose/High-Glucose Diet in Rats
Yoshihisa Takahashi1*, Keiichiro Sugimoto2,3, Yurie Soejima1,
Arisa Kumagai1, Tatsuki Koeda4, Aiko Shojo3,5, Kazuya
Nakagawa2, Naoki Harada4, Ryoichi Yamaji4, Hiroshi Inui3,6,
Toshikazu Yamanouchi7 and Toshio Fukusato1
1
  Department of Pathology, Teikyo University School of
Medicine, Japan
2
  Research and Development Center, Nagaoka Perfumery Co.
Ltd., Japan
3
  Center for Research and Development of Bioresources, Osaka
Prefecture University, Japan
4
  Division of Applied Life Sciences, Graduate School of Life and
Environment Sciences, Osaka Prefecture University, Japan
5
  Department of Nutrition and Health, Faculty of Human
Development, Soai University, Japan
6
  Department of Clinical Nutrition, College of Health and Human
Sciences, Osaka Prefecture University, Japan
7
  Department of Internal Medicine, Teikyo University School of
Medicine, Japan

*Corresponding Author: Yoshihisa Takahashi, Department of
Pathology, Teikyo University School of Medicine, Tokyo, Japan

Published August 12, 2020

This Book Chapter is a republication of an article published by
Yoshihisa Takahashi, et al. at BioMed Research International in
April 2015. (Yoshihisa Takahashi, Keiichiro Sugimoto, Yurie
Soejima, Arisa Kumagai, Tatsuki Koeda, Aiko Shojo, Kazuya
Nakagawa, Naoki Harada, Ryoichi Yamaji, Hiroshi Inui,
Toshikazu Yamanouchi, Toshio Fukusato. Inhibitory Effects of

1                                            www.videleaf.com
Prime Archives in Biomedical Sciences

Eucalyptus and Banaba Leaf Extracts on Nonalcoholic
Steatohepatitis Induced by a High-Fructose/High-Glucose Diet
in Rats. BioMed Research International. Volume 2015, Article
ID 296207, 9 pages. http://dx.doi.org/10.1155/2015/296207)

How to cite this book chapter: Yoshihisa Takahashi, Keiichiro
Sugimoto, Yurie Soejima, Arisa Kumagai, Tatsuki Koeda, Aiko
Shojo, Kazuya Nakagawa, Naoki Harada, Ryoichi Yamaji,
Hiroshi Inui, Toshikazu Yamanouchi, Toshio Fukusato.
Inhibitory Effects of Eucalyptus and Banaba Leaf Extracts on
Nonalcoholic Steatohepatitis Induced by a High-Fructose/High-
Glucose Diet in Rats. In: Antonio Monleon-Getino, editor. Prime
Archives in Biomedical Sciences. Hyderabad, India: Vide Leaf.
2020.

© The Author(s) 2020. This article is distributed under the terms
of the Creative Commons Attribution 4.0 International
License(http://creativecommons.org/licenses/by/4.0/),      which
permits unrestricted use, distribution, and reproduction in any
medium, provided the original work is properly cited.

Conflict of Interests: K. Sugimoto and K. Nakagawa are
employed by Nagaoka Perfumery Co., Ltd. H. Inui received
funding from Nagaoka Perfumery Co., Ltd.

Acknowledgments: This work was supported by JSPS
KAKENHI Grant Number 20193568 and 23580181. We thank
the Teikyo Academic Research Center for giving advice on
statistical analysis.

Abstract
Nonalcoholic steatohepatitis (NASH) is a liver disease
associated with metabolic syndrome. The aim of this work was
to examine whether eucalyptus (Eucalyptus globulus) leaf
extract (ELE) and banaba (Lagerstroemia speciosa L.) leaf
extract (BLE) inhibited NASH induced by excessive ingestion of
fructose in rats. Wistar rats were divided into four groups
according to four distinct diets: starch diet (ST), high-
fructose/high-glucose diet (FG), FG diet supplemented with

2                                             www.videleaf.com
Prime Archives in Biomedical Sciences

ELE, or FG diet supplemented with BLE. All rats were killed
after 5 weeks of treatment. Serum alanine aminotransferase and
total cholesterol levels were significantly lower in the BLE
group than in the FG group. Liver histopathology, including
steatosis, lipogranulomas, and perisinusoidal fibrosis, was
significantly attenuated in the ELE and BLE groups compared
with the FG group. Levels of 2-thiobarbituric acid reactive
substances (TBARS), which reflect oxidative injury to the liver,
were significantly suppressed by ELE and BLE. Western
blotting analysis indicated that interleukin-6 expression levels
were significantly lower in the ELE and BLE groups than in the
FG group. These results suggest that ELE and BLE reduced
lipogenesis, oxidative stress, and inflammatory cytokine
expression, and thus inhibited NASH induced by excessive
ingestion of fructose in rats.

Introduction
Nonalcoholic fatty liver disease (NAFLD) is a condition in
which excessive fat (primarily triacylglycerols (TAG))
accumulates in the liver of a patient without a history of alcohol
abuse [1]. The histological spectrum of NAFLD pathology
includes simple steatosis and nonalcoholic steatohepatitis
(NASH), which is characterized by lobular inflammation and
hepatocellular injury, as well as hepatic steatosis. NASH is a
progressive disease that can advance to liver cirrhosis and
hepatocellular carcinoma [2,3]. NAFLD/NASH is recognized as
a hepatic manifestation of metabolic syndrome [4,5]. Notably,
the disorder is a growing clinical and public health concern, as
the prevalence of NAFLD/NASH is rapidly increasing
worldwide due to the increased rate of obesity. As a result, it is
currently the most common chronic liver disease [6,7].

Excessive consumption of fructose, largely resulting from the
rapid increase in the amount of high-fructose corn syrups
(HFCSs) in the human diet, is considered to be one of the major
factors contributing to the increasing rate of obesity and
metabolic syndrome [8,9]. Our group and others have shown that
fructose-enriched diet causes metabolic syndrome and
NAFLD/NASH in experimental animals [10-12]; therefore,

3                                              www.videleaf.com
Prime Archives in Biomedical Sciences

fructose enrichment has become a common nutritional animal
model of NAFLD/NASH. It has been reported that the amount of
fructose consumption is higher in patients with NAFLD and that
their hepatic ketohexokinase activity, which plays a crucial role
in fructose metabolism in the liver, is elevated compared to
healthy subjects [13].

Eucalyptus (Eucalyptus globulus) is an evergreen tree native to
Australia, which is widely distributed around the world. The
leaves of this plant are used as a traditional remedy for diabetes
mellitus in South America and Africa, and its anti-
hyperglycemic effect has been demonstrated in streptozotocin-
induced diabetic mice [14]. We have previously shown that
eucalyptus leaf extract (ELE) inhibits intestinal fructose
absorption and suppresses the accumulation of hepatic TAG
induced by the excessive ingestion of fructose in rats [15]. This
inhibitory effect on intestinal fructose absorption has also been
observed in human subjects [16]. Banaba (Lagerstroemia
speciosa L.) is another folk medicine used to treat diabetes
mellitus in various parts of the world, primarily Southeast Asia,
and many clinical and experimental studies have confirmed its
anti-hyperglycemic effect [17].

In the present study, we examined potential inhibitory effects of
ELE and banaba leaf extract (BLE) on NASH induced by
excessive ingestion of fructose in rats. We report that ELE and
BLE inhibited the development and progression of hepatic
lesions in our animal model of NAFLD/NASH. These effects
were associated primarily with decreased lipogenesis,
presumably due to the suppression of intestinal fructose
absorption. In addition, assays for inflammation and oxidative
stress suggested that the anti-oxidative and anti-inflammatory
effects of ELE and BLE are important mediators of NASH
inhibition.

Materials and Methods
Ethics Statement

This study was carried out in strict accordance with the
recommendations of the Guide for the Care and Use of

4                                             www.videleaf.com
Prime Archives in Biomedical Sciences

Laboratory Animals of the National Institutes of Health. The
protocol was approved by the Animal Care and Use Committee
of Osaka Prefecture University (Permit Number: 21-2). All the
animals received humane care, and all efforts were taken to
minimize suffering.

Preparation of ELE and BLE

Dried eucalyptus and banaba leaves were purchased from K.
Kobayashi & Co., Ltd. (Kobe, Japan) and were extracted with
boiling ethanol-water (1:2, v/v) under reflux for 2 h. The extract
was then filtered and evaporated to dryness in vacuo.

Animals and Experimental Protocols

Thirty 5-week-old male Wistar rats were purchased from Kiwa
Laboratory Animals Co., Ltd. (Wakayama, Japan) and
maintained on a starch diet for 1 week. Then, rats were divided
into four groups according to diet: starch (ST) (n=7), high-
fructose/high-glucose (FG) (n=9), FG diet supplemented with
ELE (n=7), and FG diet supplemented with BLE (n=7). The
latter two groups were termed ELE and BLE, respectively. The
rats in the ST and FG group were fed a starch and FG diet ad
libitum, respectively. The ELE and BLE groups were fed
identically to the FG group, but their feed was supplemented
with 1% (w/w) ELE or BLE. The composition of each diet is
shown in Table 1. All rats were housed individually in a room
with controlled temperature (23 ± 2°C), humidity (60 ± 10%),
and light cycles (09:00-21:00). The diets were stored in a
refrigerator at 4˚C. The feed containers were refilled with fresh
diet 3 times a week, and food consumption was recorded.

5                                              www.videleaf.com
Prime Archives in Biomedical Sciences

Table 1: The composition of each experimental diet (g/1000 g diet).

                         ST             FG            BLE        ELE
    Cornstarch           700            0             0          0
    Glucose              0              350           350        350
    Fructose             0              350           350        350
    Casein               170            170           170        170
    Soybean oil          30             30            30         30
    AIN-93G-MX           35             35            35         35
    mineral mix
    Choline chloride     2              2             2          2
    AIN-93VX vitamin     10             10            10         10
    mix
    Methionine           3              3             3          3
    Cellulose            50             50            40         40
    BLE                  0              0             10         0
    ELE                  0              0             0          10

BLE, banaba leaf extract; ELE, eucalyptus leaf extract.

The rats were killed at 11 weeks of age, 5 weeks after
commencing the diet. The rats were starved for 16 h, and their
body weights were measured before killing them. Rats were
starved overnight to avoid influences of food consumption on
serum glucose and insulin levels. After the rats were anesthetized
with isoflurane, blood samples from each rat were collected by
cardiac puncture, and the serum was separated by centrifugation.
The liver of each rat was excised and weighed, and samples were
collected for histological analysis and snap freezing. The weight
of epididymal adipose tissue (EAT) was also measured.

Biochemical Analysis of Serum

Serum      aspartate     aminotransferase     (AST),     alanine
aminotransferase (ALT), alkaline phosphatase (ALP),
cholinesterase (ChE), total cholesterol (T-Cho), high density
lipoprotein (HDL-Cho), and glucose levels were determined by
routine methods using the Hitachi 7700 Series (DDP)
autoanalyzer (Hitachi High-Technologies Corporation, Tokyo,
Japan). Arteriosclerotic index (AI) was calculated as (T-Cho -
HDL-Cho)/HDL-Cho. Serum insulin and adiponectin levels

6                                                         www.videleaf.com
Prime Archives in Biomedical Sciences were measured by enzyme-linked immunosorbent assay (ELISA) using the rat insulin ELISA kit (RTU) (Shibayagi Co., Ltd., Shibukawa, Japan) and mouse/rat adiponectin ELISA kit (Otsuka Pharmaceutical Co., Ltd., Tokyo, Japan), respectively. Histological Analysis The central part of the largest liver lobe was fixed in 10% formaldehyde solution and processed for light microscopy by standard methods. The largest whole section was histologically evaluated. Azan-Mallory staining was performed in addition to hematoxylin and eosin staining to assess hepatic fibrosis. Histopathological features of steatohepatitis were evaluated semi-quantitatively according to the validated histological scoring system of Kleiner et al. [18]. The degree of macro- and micro-vesicular steatosis was evaluated by the percentage of hepatocytes containing macro- and micro-vesicular fat, respectively, and graded as follows: grade 0 (33-66%), and grade 3 (>66%). Lobular inflammation was classified as follows: 0 (no foci), 1 (4 foci per 200× field). Lipogranulomas were evaluated as follows: 0 (no foci), 1 (2 foci per 200× field). Portal inflammation was graded as follows: 0 (none: no lymphocytes observed), 1 (mild: sparse lymphocytes present in some or all portal tracts), 2 (moderate: denser lymphocytic infiltration in most portal tracts), or 3 (severe: dense lymphocytic infiltration in most or all portal tracts). Portal fibrosis was evaluated as follows: 0 (none), 1 (mild: portal expansion), 2 (moderate: portal fibrosis with septa), 3 (severe: portal-portal or portal-central bridging septa without regenerative nodules), or 4 (cirrhosis). Intralobular perisinusoidal fibrosis was observed mainly in the periportal area and noted as follows: 0 (none), 1 (mild), or 2 (moderate). Fibrosis staging was classified as follows: 0 (none), 1 (perisinusoidal or portal), 2 (perisinusoidal and portal), 3 (bridging fibrosis), or 4 (cirrhosis). 7 www.videleaf.com
Prime Archives in Biomedical Sciences

Determination of TAG Content in the Liver

We measured TAG content in the liver to confirm the extent of
hepatic steatosis in each experimental group. TAG in the liver
was extracted according to the method described by Folch et al.
[19] and quantified using a commercially available kit (L-type
TG•H) (Wako Pure Chemical Industries, Ltd., Osaka, Japan)
according to the manufacturer’s instructions.

2-Thiobarbituric Acid Reactive Substances (TBARS)
Levels in the Liver

To assess oxidative injury in the liver, we measured the hepatic
TBARS levels. The liver was homogenized with a polytron
homogenizer in 1.15% KCl at 4°C. TBARS levels in the
homogenate were determined using the OXItek TBARS assay kit
(ZeptoMetrix, NY, USA) according to manufacturer instructions.

Determination of Glucose-6-Phosphate Dehydrogenase
(G6PDH)

The liver was homogenized with a polytron homogenizer in 25
mmol/l HEPES-KOH buffer of pH 7.4, containing 0.15 mol/l
KCl at 4°C. After centrifugation at 10,000 g for 20 min, we
obtained supernatant for use as a crude solution containing active
liver enzymes. G6PDH activity was measured as described
previously [20]. Protein concentration was determined by the
Bradford method [21], and activity of G6PDH was normalized to
the protein concentration.

Western Blotting

We examined protein expression levels of inflammatory
cytokines and cytokine receptor genes in the liver by western
blotting to elucidate molecular mechanisms of the effects of ELE
and BLE. Liver samples were homogenized and centrifuged at
10,000 g at 4˚C for 15 min, and the protein concentration in each
was determined using a NanoDrop 2000 spectrophotometer
(Thermo Fisher Scientific, Waltham, MA, USA). Aliquots of 50
μg protein were resolved by electrophoresis on 12.5% SDS-

8                                              www.videleaf.com
Prime Archives in Biomedical Sciences

PAGE gels, and transferred onto polyvinylidene fluoride
membranes. These membranes were incubated in blocking buffer
(5% non-fat milk powder in phosphate buffered saline (PBS)) for
1 h followed by incubation with primary antibodies in 5% bovine
serum albumin (BSA) in PBS overnight at 4˚C, with gentle
agitation. The primary antibodies used for western blotting were
as follows: Tumor Necrosis Factor (TNF)-α (1:250 dilution,
R&D Systems, Minneapolis, MN, USA), TNF Receptor 1
(TNFR1) (1:50 dilution, MBL, Nagoya, Japan), Interleukin (IL)-
6 (1:200 dilution, Santa Cruz Biotechnology, Dallas, TX, USA),
and Monocyte Chemotactic Protein (MCP)-1 (1:500 dilution,
Abcam, Cambridge, UK). As a loading control, blots were
incubated with antibodies against β-actin (1:1000 dilution, Santa
Cruz Biotechnology). The membranes were subsequently
washed with 0.1% Tween-20 in PBS and incubated with anti-
rabbit or anti-goat secondary antibodies (each 1:2000 in 0.1%
Tween-20 in PBS) for 1 h at room temperature. The blots were
again washed with 0.1% Tween-20 in PBS, and the expression of
antibody-linked protein was determined using ECLTM western
blotting Detection Reagents (Amersham Pharmacia Biotech Inc.,
NJ, USA). The optical density of the bands was quantified by
ImageQuant software (GE Healthcare Life Sciences, Little
Chalfont, UK) and reported in arbitrary units. The protein
expression level of each gene was normalized by the expression
level of β-actin.

Statistics

For continuous variables, data are presented as mean ± standard
deviation, and a one-way analysis of variance (ANOVA)
followed by Dunnett’s post-hoc test was performed to assess the
significance of the differences. For semi-quantitative data
obtained by histological assessment, data are presented as the
median (min. to max.), and a Kruskal-Wallis test followed by
Steel’s post-hoc test was performed to determine statistical
significance. P < 0.05 was considered statistically significant.

9                                             www.videleaf.com
Prime Archives in Biomedical Sciences

Results
General Observations
No rats died during the experiment. Table 2 shows data detailing
food consumption levels, calorie intake, and body, liver, and
EAT weights of rats in each group. Food consumption levels
were lower in the FG, ELE, and BLE groups than in the ST
group, and this difference was statistically significant for the
ELE and BLE groups. Calorie intake also tended to be lower in
the FG, ELE, and BLE groups than in the ST group. Body
weight was found to be significantly lower in the FG, ELE, and
BLE groups than in the ST group. Liver weight was higher in the
FG group than in the ST group. In contrast, liver weight was
lower in the ELE and BLE groups than in the FG group, and this
difference was statistically significant for the BLE group.
Liver/body weight ratio was significantly higher in the FG group
than in the ST group, while it was significantly lower in the BLE
group than in the FG group. EAT weight was higher in the FG
group than in the ST group, and it was significantly lower in the
ELE and BLE groups than in the FG group. EAT/body weight
ratio was also higher in the FG group than in the ST group.
EAT/body weight ratio was lower in the ELE and BLE groups
than in the FG group, and the difference was statistically
significant for the ELE group.
Biochemical Data for Serum
Table 3 shows the data obtained through biochemical analysis of
serum obtained from each group. ALT levels were significantly
higher in the FG group than in the ST group, while they were
lower in the ELE and BLE groups than in the FG group. This
difference was statistically significant for the BLE group. T-Cho
levels were higher in the FG group than in the ST group. They
were lower in the ELE and BLE groups than in the FG group,
and the difference was statistically significant for the BLE group.
Similarly, AI was higher in the FG group than in the ST group; it
was lower in the ELE and BLE groups than in the FG group and
the difference was statistically significant for the BLE group.
Assays for AST, ALP, ChE, HDL-Cho, glucose, insulin, and
adiponectin levels revealed no significant differences among the
experimental groups.

10                                              www.videleaf.com
Prime Archives in Biomedical Sciences

Table 2: Food consumption, calorie intake, and body, liver, and EAT weight of rats.

                                         ST                   FG                  BLE                      ELE
 Food consumption (g)                750.2 ± 32.2        705.6 ± 41.4         678.3 ± 72.6a            678.0 ± 44.9a
 Calorie intake (kcal)              2598.7 ± 111.4      2511.1 ± 147.3       2414.2 ± 258.3           2413.1 ± 159.6
 Body weight (g)                     358.2 ± 14.4        330.1 ± 10.5a        310.5 ± 29.8a            316.4 ± 24.4a
 Liver weight (g)                    10.05 ± 1.46         10.43 ± 0.38        8.97 ± 1.18b             9.92 ± 1.34
                                                                        a                 b
 Liver/body weight ratio (%)          2.86 ± 0.23         3.16 ± 0.12         2.88 ± 0.19              3.13 ± 0.31
 EAT weight (g)                       4.95 ± 0.80         5.37 ± 1.11         4.18 ± 1.21b             4.13 ± 1.01b
 EAT/body weight ratio (%)            1.41 ± 0.17         1.63 ± 0.35         1.33 ± 0.28              1.30 ± 0.27b

Data are presented as mean ± standard deviation.
a
 Significantly different from the ST group (P < 0.05). bSignificantly different from the FG group (P < 0.05).
EAT, epididymal adipose tissue.

Table 3: Serum data corresponding to each experimental group.

                               ST                         FG                        BLE                              ELE
 AST (IU/L)                    90.9 ± 14.6                91.1 ± 8.3                85.8 ± 7.8                       87.1 ± 11.1
 ALT (IU/L)                    22.6 ± 6.7                 28.7 ± 6.1a               20.0 ± 1.4b                      23.7 ± 2.8
 ALP (IU/L)                    537.4 ± 153.6              552.4 ± 134.9             560.8 ± 128.5                    518.6 ± 164.0
 ChE (IU/L)                    2.71 ± 0.95                2.89 ± 0.78               2.00 ± 0.89                      2.43 ± 1.27
                                                                                                  b
 T-Cho (mg/dL)                 92.8 ± 5.4                 103.9 ± 15.7              84.1 ± 10.0                      97.1 ± 18.2
 HDL-Cho (mg/dL)               28.0 ± 2.1                 30.8 ± 3.0                28.0 ± 2.9                       30.1 ± 3.8
 AI                            2.28 ± 0.08                2.37 ± 0.20               2.00 ± 0.20b                     2.21 ± 0.33
 Glucose (mg/dL)               114.3 ± 26.9               117.2 ± 22.3              117.0 ± 10.3                     105.0 ± 4.8
 Insulin (ng/mL)               1.56 ± 0.68                1.53 ± 0.99               1.21 ± 0.50                      1.16 ± 0.14
 Adiponectin (μg/mL)           4.97 ± 1.30                4.78 ± 0.97               4.43 ± 0.98                      4.79 ± 0.39

Data are presented as mean ± standard deviation.
a
 Significantly different from the ST group (P < 0.05). bSignificantly different from the FG group (P < 0.05).
AI, arteriosclerotic index; ALP, alkaline phosphatase; ALT, alanine aminotransferase; AST, aspartate aminotransferase; ChE,
cholinesterase; HDL-Cho, high density lipoprotein; T-Cho, total cholesterol.

11                                                         www.videleaf.com
Prime Archives in Biomedical Sciences
Histological Findings
Differences in the histological appearance among liver lobules
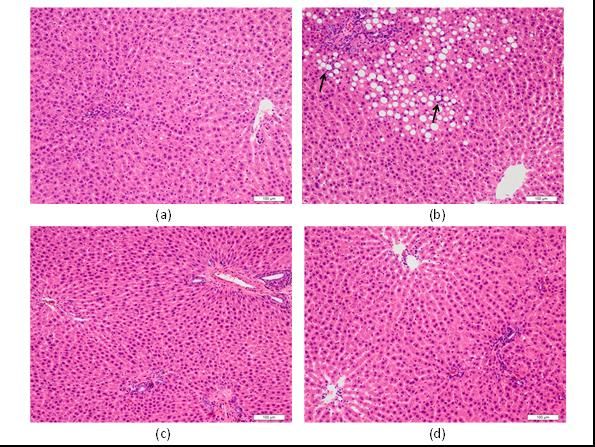
were not conspicuous in any of the rats. Although rats in the ST
group showed only mild steatosis and inflammation, rats in the
FG group showed liver histopathology consistent with NASH
(Figure 1(a) and 1(b)). Steatosis and perisinusoidal fibrosis in the
FG group was mainly distributed in zone 1. Table 4 summarizes
the histological findings of each group. The grade of macro-
vesicular steatosis was significantly higher in the FG group than
in the ST group. In keeping with ELE and BLE preventing
NASH-related pathologies, macro- and micro-vesicular steatosis
were significantly lower in the ELE and BLE groups than in the
FG group (Figure 1(c) and 1(d)). The grade of micro-vesicular
steatosis in the BLE group was also found to be significantly
lower than that of the ST group.
Table 4: Histological findings for each experimental group.
ST FG BLE ELE
Macrovesicular 0 (0-1) 2 (1-3)a 0 (0-1)b 0 (0-1)b
steatosis
Microvesicular steatosis 2 (1-3) 2 (1-3) 1 (0- 1 (1-2)b
1)a,b
Lobular inflammation 2 (0-2) 2 (1-2) 1 (0-2) 2 (1-2)
Portal inflammation 1 (1-1) 1 (1-1) 1 (0-1) 1 (1-1)
Lipogranulomas 0 (0-0) 2 (1-3)a 0 (0-1)b 0 (0-0)b
Portal fibrosis 0 (0-0) 1 (0-1)a 0 (0-1) 0 (0-1)
Perisinusoidal fibrosis 0 (0-0) 1 (1-1)a 0 (0-1)b 0 (0-1)b
Fibrosis stage 0 (0-0) 2 (1-2)a 0 (0-2) 1 (0-2)a
Data are presented as the median (min. – max.).
a
Significantly different from the ST group (P < 0.05). bSignificantly different
from the FG group (P < 0.05).
12 www.videleaf.comPrime Archives in Biomedical Sciences Figure 1: Histological appearance of the liver. Although rats in the ST group show only mild steatosis and inflammation (a), rats in the FG group show marked steatosis and scattered foci of lobular inflammation (arrows) (b). Steatosis is markedly alleviated in rats of the BLE (c) and ELE (d) groups. Lobular inflammation tended to be milder in the BLE group than in the FG group, but statistically significant differences were not observed among any experimental groups. With regard to portal inflammation, there were no significant differences among the experimental groups. The number of lipogranulomas was significantly higher in the FG group than in the ST group, and the granuloma number was lowered by ELE and BLE administration compared to the FG group. We further tested the effects of ELE or BLE treatment on the development of various forms of fibrosis in response to an FG diet. The degree of portal fibrosis was significantly more severe in the FG group than in the ST group and it was lower in the ELE and BLE groups than in the FG group, but the differences were not statistically significant. While the degree of perisinusoidal fibrosis was significantly more severe in the FG group than in the ST group, it was significantly milder in the ELE and BLE groups than in the FG group. Fibrosis stage was significantly higher in the FG and ELE groups than in the ST group. Fibrosis stage also tended to be lower in the ELE and BLE groups than in the FG group, but the differences were not statistically significant. 13 www.videleaf.com
Prime Archives in Biomedical Sciences

TAG Content, TBARS Levels, and G6PDH Activity in
the Liver

TAG content, TBARS levels, and G6PDH activity in the liver
were significantly higher in the FG group than in the ST group,
and they were significantly lower in the ELE and BLE groups
than in the FG group (Figure 2). TBARS levels in the ELE and
BLE groups were also found to be significantly lower than those
in the ST group.

Figure 2: TAG content, TBARS levels, and G6PDH activity in the liver. TAG
content (a), TBARS levels (b), and G6PDH activity (c) in the liver are
significantly higher in the FG group than in the ST group, and they are
significantly lower in the ELE and BLE groups than in the FG group. TBARS
levels in the ELE and BLE groups are also significantly lower than those in the
ST group. aSignificantly different from the ST group (P < 0.05); bSignificantly
different from the FG group (P < 0.05).

Protein Expression Levels of Inflammatory Cytokine
and Receptor Genes

Figure 3 shows western blotting results revealing the protein
expression levels of the inflammatory cytokines or receptors:
TNF-α, TNFR1, IL-6, and MCP-1. IL-6 expression levels were
significantly higher in the FG group than in the ST group, and
they were significantly lower in the ELE and BLE groups than in

14                                                       www.videleaf.com
Prime Archives in Biomedical Sciences

the FG group. With regard to TNF-α, TNFR1, and MCP-1
expression levels, there were no significant differences among
the experimental groups, with the exception of significantly
higher TNF-α expression in the BLE group than in the ST group.

                      ST      FG          ELE     BLE                    ST        FG           ELE     BLE

                                    (a)                                                   (b)
                       TNF-α/β-actin ratio                                     TNFR1/β-actin ratio
      1.6                                                     0.12
      1.4                                  a                    0.1
      1.2
                                                              0.08
        1
      0.8                                                     0.06
      0.6
                                                              0.04
      0.4
      0.2                                                     0.02
        0                                                           0
                ST           FG            BLE      ELE                  ST          FG          BLE    ELE
                                   (c)                                                    (d)
                           IL-6/β-actin ratio                                 MCP-1/β-actin ratio
       0.7
                               a                               2
       0.6
                                                              1.5
       0.5
                                             b
       0.4                                              b      1
       0.3
       0.2                                                    0.5
       0.1
            0                                                  0
                 ST           FG            BLE         ELE             ST           FG           BLE         ELE
                                    (e)                                                   (f)

Figure 3: Protein expression levels of inflammatory cytokine and receptor
genes determined by western blotting. IL-6 expression levels are significantly
higher in the FG group than in the ST group, and they are significantly lower in
the ELE and BLE groups than in the FG group (b,e). TNF-α (a,c), TNFR1 (d),
and MCP-1 (f) expression levels did not show significant differences among
the experimental groups, with the exception of significantly higher TNF-α
expression in the BLE group than in the ST group. aSignificantly different from
the ST group (P < 0.05); bSignificantly different from the FG group (P < 0.05).

Discussion
In the present study, we have shown that ELE and BLE attenuate
NASH induced by a fructose-enriched diet in rats. To the best of
our knowledge, this is the first study to examine the preventative
effects and potential therapeutic benefits of ELE and BLE on
NAFLD/NASH in detail.

There are a variety of established nutritional animal models of
NAFLD/NASH [22]. We focused on NAFLD/NASH induced by
excessive intake of fructose. Although the high-fructose diet

15                                                                                          www.videleaf.com
Prime Archives in Biomedical Sciences model of NASH is well established [10-12,22], in this study, we used a high-fructose/high-glucose diet to render the experimental diet more similar to the human diet. HFCSs, which are used as sweeteners and thought to substantially contribute to the increasing prevalence of obesity and metabolic syndrome [23,24], contain glucose as well as fructose. Indeed, the levels of fructose and glucose contents in most foodstuffs are practically identical. As evidence that our method is an appropriate animal model of NASH, liver histopathology similar to NASH and increased serum ALT level were induced in rats as a result of a high-fructose/high-glucose diet. Steatosis and perisinusoidal fibrosis in our model was predominant in zone 1, in contrast to typical forms of NAFLD/NASH in adult humans. We obtained similar findings in a previous study using a pure high-fructose diet [12]. Thus, this pattern may be the characteristic of NAFLD/NASH caused by excessive consumption of fructose. Unexpectedly, body weight in the FG group was significantly lower than that of the ST group. This phenomenon is most probably explained by our observation that food consumption and calorie intake in the FG group tended to be lower than those in the ST group. This was probably due to the taste of the FG diet, which was less preferred compared to the ST diet. We designed the ST diet to be tasty; however, the FG diet contained large amount of fructose and glucose, which might have made it too sweet. Furthermore, in our previous study, the energy intake in the high-fructose diet group was found to be significantly lower than that in the starch diet group [12]. Food consumption tended to be lower in the ELE and BLE groups than in the FG group, although the differences were not statistically significant. Possibly, the addition of ELE and BLE resulted in a further taste loss of the diet. However, EAT weight in the FG group was higher than that in the ST group; this result was consistent with abdominal obesity typically associated with metabolic syndrome. Liver weight and liver/body weight ratio were significantly lower in the BLE group than in the FG group, consistent with amelioration of NASH. We determined that the decrease in liver weight was not due to hepatotoxicity, as liver injury was not observed upon histological assessment. Serum levels of ALT, T- Cho, and AI were significantly lower in the BLE group than in 16 www.videleaf.com
Prime Archives in Biomedical Sciences

the FG group. This suggests that BLE administration
significantly improved hypercholesterolemia and hepatocellular
injury. Although the differences were not statistically significant,
these serological data tended to be lower in the ELE group than
in the FG group as well, suggesting there may be a similar, if
perhaps not as robust, effect of ELE. Statistically significant
differences in the serum levels of AST and ALP were not
observed among the experimental groups. However, these
serological markers are less specific to liver cell injury than
ALT.

Evaluation of liver histopathology revealed that macro- and
micro-vesicular steatosis, lipogranulomas, and perisinusoidal
fibrosis were significantly milder in both ELE and BLE groups
than in the FG group. These data indicate that ELE and BLE
attenuated pathological findings of NASH. Because the largest
whole section of the largest liver lobe was examined and
heterogeneity among liver lobules was not remarkable, the
observed histological findings likely reflected the whole aspect
of the liver. A significant inhibitory effect of ELE and BLE on
liver steatosis was further confirmed by quantification of TAG
content in the liver.

Fructose absorbed in the small intestine is transported mainly to
the liver and metabolized to triose phosphates by the action of
ketohexokinase, aldolase B, and triokinase without the
participation of 6-phosphofructokinase, which is the main rate-
controlling step in glycolysis [25]. Therefore, fructose can serve
as a relatively unregulated acetyl-CoA, and is more lipogenic
than glucose. Lipogenic enzymes such as G6PDH and fatty acid
synthase are activated and hepatic TAG concentration is
significantly elevated after excessive consumption of sucrose or
fructose [26,27].

We previously reported that ELE inhibits intestinal fructose
absorption [15]. A decrease in fructose absorption would result
in the reduction of lipogenesis in the liver. Indeed, hepatic
G6PDH activity was significantly lower in the ELE group than
in the FG group, and only very small amounts of TAG
accumulated in the liver of the ELE group, in contrast to the FG

17                                               www.videleaf.com
Prime Archives in Biomedical Sciences

group. When considering these and our previous study, we
speculated that ELE prevents NASH induced by the excessive
ingestion of fructose mainly by decreasing its intestinal
absorption. BLE also reduced lipogenesis and prevented NASH
in rats fed the high-fructose/high-glucose diet, suggesting that
BLE as well as ELE inhibits the intestinal absorption of fructose.
In fact, when rats were orally given BLE 10 min before the
administration of fructose, the intestinal fructose absorption, as
determined by measuring the elevated concentration of fructose
in the portal vein, was significantly suppressed (unpublished
data), in accordance with previous observations for ELE [15].

TBARS is a marker of lipid peroxidation. A “two-hit” hypothesis
has been proposed for the pathogenesis of NASH [28], and
oxidative stress is considered to be an important cause of the
“second hit.” Markers of oxidative stress, including TBARS, are
markedly elevated after fructose administration in rodents
[11,29]. In the present study, TBARS levels were significantly
higher in the FG group than in the ST group, while they were
significantly lower in the ELE and BLE groups than in the FG
group. These results suggest that NASH induced by the high-
fructose/high-glucose diet was associated with increased
oxidative stress, an effect that was inhibited by ELE and BLE.

We observed by western blot analysis that IL-6 expression levels
were significantly higher in the FG group than in the ST group,
while they were significantly lower in the ELE and BLE groups
than in the FG group. IL-6 is hypothesized to sensitize the liver
to injury, stimulate hepatocyte apoptosis, induce insulin
resistance, and participate in NASH development [30]. Our
results thus suggest that NASH brought on by a high-
fructose/high-glucose diet is associated with increased IL-6
expression, and that inhibition of NASH by ELE and BLE may
be explained in part by decreased IL-6 expression.

It is well established that ELE and BLE contain a wide spectrum
of polyphenols with strong antioxidative effects, such as
hydrolysable tannins [17,31]. Hydrolysable tannins and
aglycones ameliorated lipopolysaccharide-induced liver injury
by inhibition of inducible nitric oxide synthase (iNOS)

18                                              www.videleaf.com
Prime Archives in Biomedical Sciences

expression in mice [32]. It has been reported that fructose-fed
iNOS knockout mice did not exhibit increased levels of lipid
peroxidation, phospho-IκB and nuclear factor κB activity, and
TNF-α expression in the liver of rats [33]. We thus speculate that
these physiological functions have a composite effect on the
suppression of inflammation in the liver.

Conclusions
We show that ELE and BLE inhibit NASH induced by high-
fructose/high-glucose diet in rats. This preventative effect is
primarily associated with reduced lipogenesis, possibly due to
the suppression of the intestinal fructose absorption. In addition,
decreased oxidative stress and inflammatory cytokine expression
might also provide a mechanism by which NASH is inhibited by
ELE and BLE.

References
1. AJ MuCullough. The clinical features, diagnosis and natural
   history of nonalcoholic fatty liver disease. Clin Liver Dis.
   2004; 8: 521-533.
2. GC Farrell, CZ Larter. Nonalcoholic fatty liver disease: from
   steatosis to cirrhosis. Hepatology. 2006; 43: S99-S112.
3. JC Cohen, JD Horton, HH Hobbs. Human fatty liver disease:
   old questions and new insights. Science. 2011; 332: 1519-
   1523.
4. G Marchesini, M Brizi, G Bianchi, S Tomassetti, E
   Bugianesi, et al. Nonalcoholic fatty liver disease: a feature of
   the metabolic syndrome. Diabetes. 2001; 50: 1844-1850.
5. G Marchesini, E Bugianesi, G Forlani, F Cerrelli, M Lenzi,
    et al. Nonalcoholic fatty liver, steatohepatitis, and the
    metabolic syndrome. Hepatology. 2003; 37: 917-923.
6. AJ McCullough. Update on nonalcoholic fatty liver disease.
   J Clin Gastroenterol. 2002; 34: 255-262.
7. JM Clark, FL Brancati, AM Diehl. The prevalence and
   etiology of elevated aminotransferase levels in the United
   States. Am J Gastroenterol. 2003; 98: 960-967.
8. PJ Havel. Dietary fructose: implications for dysregulation of
   energy homeostasis and lipid/carbohydrate metabolism. Nutr

19                                              www.videleaf.com
Prime Archives in Biomedical Sciences
Rev. 2005; 63: 133-157.
9. RJ Johnson, MS Segal, Y Sautin, T Nakagawa, DI Feig, et
al. Potential role of sugar (fructose) in the epidemic of
hypertension, obesity and the metabolic syndrome, diabetes,
kidney disease, and cardiovascular disease. Am J Clin Nutr.
2007; 86: 899-906.
10. Z Ackerman, M Oron-Herman, M Grozovski, T Rosenthal,
O Pappo, et al. Fructose-induced fatty liver disease: hepatic
effects of blood pressure and plasma triglyceride reduction.
Hypertension. 2005; 45: 1012-1018.
11. F Armutcu, Ö Coskun, A Gürel, M Kanter, M Can, et al.
Thymosin alpha 1 attenuates lipid peroxidation and
improves fructose-induced steatohepatitis in rats. Clin
Biochem. 2005; 38: 540-547.
12. T Kawasaki, K Igarashi, T Koeda, K Sugimoto, K
Nakagawa, et al. Rats fed fructose-enriched diets have
characteristics of nonalcoholic hepatic steatosis. J Nutr.
2009; 139: 2067-2071.
13. X Ouyang, P Cirillo, Y Sautin, S McCall, JL Bruchette, et
al. Fructose consumption as a risk factor for non-alcoholic
fatty liver disease. J Hepatol. 2008; 48: 993-999.
14. SK Swanston-Flatt, C Day, CJ Bailey, PR Flatt. Traditional
plant treatments for diabetes. Studies in normal and
streptozotocin diabetic mice. Diabetologia. 1990; 33: 462-
464.
15. K Sugimoto, J Suzuki, K Nakagawa, S Hayashi, T Enomoto,
et al. Eucalyptus leaf extract inhibits intestinal fructose
absorption, and suppresses adiposity due to dietary sucrose
in rats. Br J Nutr. 2005; 93: 957-963.
16. K Sugimoto, T Kawasaki, M Tomoda, K Nakagawa, S
Hayashi, et al. Lowering of postprandial hyperfructosemia in
humans by eucalyptus leaf extract: A randomized, double-
blind, placebo-controlled crossover study. Food Sci Technol
Res. 2010; 16: 509-512.
17. SJ Stohs, H Miller, GR Kaats. A review of the efficacy and
safety of banaba (Lagerstroemia speciosa L.) and corosolic
acid. Phytother Res. 2012; 26: 317-324.
18. DE Kleiner, EM Brunt, M Van Natta, C Behling, MJ Contos,
et al. Design and validation of a histological scoring system
for nonalcoholic fatty liver disease. Hepatology. 2005; 41:
20 www.videleaf.comPrime Archives in Biomedical Sciences
1313-1321.
19. J Folch, M Lees, GH Sloane Stanley. A simple method for
the isolation and purification of total lipides from animal
tissues. J Biol Chem. 1957; 226: 497-509.
20. GE Glock, P McLean. Further studies on the properties and
assay of glucose 6-phosphate dehydrogenase and 6-
phosphogluconate dehydrogenase of rat liver. Biochem J.
1953; 55: 400-408.
21. MM Bradford. A rapid and sensitive method for the
quantitation of microgram quantities of protein utilizing the
principle of protein-dye binding. Anal Biochem. 1976; 72:
248-254.
22. Y Takahashi, Y Soejima, T Fukusato. Animal models of
nonalcoholic fatty liver disease/nonalcoholic steatohepatitis.
World J Gastroenterol. 2012; 18: 2300-2308.
23. RH Lustig, LA Schmidt, CD Brindis. Public health: The
toxic truth about sugar. Nature. 2012; 482: 27-29.
24. MB Vos, JE Lavine. Dietary fructose in nonalcoholic fatty
liver disease. Hepatology. 2013; 57: 2525-2531.
25. PA Mayes. Intermediary metabolism of fructose. Am J Clin
Nutr. 1993; 58: 754S–765S.
26. H Fukuda, N Iritani, T Tanaka. Effects of high-fructose diet
on lipogenic enzymes and their substrate and effector levels
in diabetic rats. J Nutr Sci Vitaminol (Tokyo). 1983; 29: 691-
699.
27. S Osaki, T Kimura, T Sugimoto, S Hizukuri, N Iritani. L-
Arabinose feeding prevents increases due to dietary sucrose
in lipogenic enzymes and triacylglycerol levels in rats. J
Nutr. 2001; 131: 796-799.
28. CP Day, OF James. Steatohepatitis: a tale of two hits?
Gastroenterology. 1998; 114: 842-845.
29. JD Botezelli, LT Cambri, AC Ghezzi, RA Dalia, FA
Voltarelli, et al. Fructose-rich diet leads to reduced aerobic
capacity and to liver injury in rats. Lipids Health Dis. 2012;
11: 78.
30. V Braunersreuther, GL Viviani, F Mach, F Montecucco. Role
of cytokines and chemokines in non-alcoholic fatty liver
disease. World J Gastroenterol. 2012; 18: 727-735.
31. K Sugimoto, K Nakagawa, S Hayashi, Y Amakura, M
Yoshimura, et al. Hydrolyzable tannins as antioxidants in
21 www.videleaf.comPrime Archives in Biomedical Sciences
the leaf extract of eucalyptus globulus possessing tyrosinase
and hyaluronidase inhibitory activities. Food Sci Technol
Res. 2009; 15: 331-336.
32. K Sugimoto, S Sakamoto, K Nakagawa, S Hayashi, N
Harada, et al. Suppression of inducible nitric oxide synthase
expression and amelioration of lipopolysaccharide-induced
liver injury by polyphenolic compounds in Eucalyptus
globulus leaf extract. Food Chem. 2011; 125: 442-446.
33. A Spruss, G Kanuri, K Uebel, SC Bischoff, I Bergheim. Role
of the inducible nitric oxide synthase in the onset of
fructose-induced steatosis in mice. Antioxid Redox Signal.
2011; 14: 2121-2135.
22 www.videleaf.comYou can also read