Metabolic profiling of fatty acids in Tripterygium wilfordii multiglucoside- and triptolide-induced liver-injured rats
←
→
Page content transcription
If your browser does not render page correctly, please read the page content below
Open Life Sciences 2021; 16: 184–197
Research Article
Xiaojie Liu#, Cong Hu#, Hongwei Li, Linjing Wu, Yinhua Xiong*, Xilan Tang, Siyu Deng
Metabolic profiling of fatty acids in Tripterygium
wilfordii multiglucoside- and triptolide-induced
liver-injured rats
https://doi.org/10.1515/biol-2021-0016
received August 12, 2020; accepted December 21, 2020
1 Introduction
Abstract: Tripterygium wilfordii multiglucoside (TWM) is The liver is a primary organ of synthesis and metabolism
a fat-soluble extract from a Chinese herb T. wilfordii, of fatty acids in vertebrates. It is not surprising that any
that’s used in treating rheumatoid arthritis, nephrotic syn- injury to the liver makes a disruption for the balance of
drome and other skin diseases. Triptolide (TP) is a major the levels of fatty acids including free fatty acids and
active component in TWM. However, clinical applications esterified fatty acids in the body. It has been reported
of TWM are limited by its various toxicities especially that the levels of fatty acids could be closely related to
hepatotoxicity. In recent studies, it has been reported various liver diseases such as liver cancer [1], hepatitis C
that drug-induced liver injury (DILI) could induce the dis- [2] and drug-induced liver injury (DILI) [3]. High level of
order of lipid metabolism in animals. Hence, this study free fatty acids in the body can induce large amounts of
focuses on the metabolic profile of fatty acids in TWM- lipids to deposit in hepatic cell, resulting in the damage
and TP-induced liver-injured rats. In serum and liver of cell membrane, mitochondria and lysosomes [4]. The
tissue, 16 free and 16 esterified fatty acids were measured decreased ratio of ω-6 and ω-3 polyunsaturated fatty
by gas chromatography coupled with mass spectrometry. acids in the body could significantly alleviate chemically
Metabolic profile of serum fatty acids in rats with liver induced liver injury [5]. The alterations in the fatty acid
injury was identified by multivariate statistical analysis. concentrations and the metabolic profiling may be exam-
The fatty acid levels in the serum of TWM- and TP-treated
ined in animals with hepatic damage, showing that these
rats significantly decreased, whereas those in the liver
changes could be used to evaluate biochemical processes
tissue of TWM- and TP-treated rats obviously increased
and pathological status in vivo.
when compared with the vehicle-treated rats. Four free
Tripterygium wilfordii multiglucoside (TWM) is a fat-
fatty acids were identified as candidate biomarkers of
soluble mixture including alkaloids, diterpene lactones
TWM- and TP-induced liver injury. Therefore, the targeted
and triterpenoids extracted from a Chinese herb T. wil-
metabolomic method may be used as a complementary
fordii [6]. The TWM tablet is extensively used for the
approach for DILI diagnosis in clinic.
treatment of rheumatoid arthritis, nephrotic syndrome,
Keywords: fatty acids, Tripterygium wilfordii multigluco- systemic lupus erythematosus and other diseases in clinics
side, triptolide, metabolic profile, liver injury [7]. However, the further development and clinical appli-
cation of TWM have been limited due to its various toxi-
cities especially hepatotoxicity [8]. Triptolide (TP), a major
active ingredient of diterpene lactone in TWM, showed
# Co-first author.
multiple pharmacological effects such as anti-inflamma-
tory [9], antitumor [10,11] and antifertility [12]. The ther-
* Corresponding author: Yinhua Xiong, Jiangxi Provincial Key apeutic effect of TP is 100–200 times higher than that of
Laboratory of Drug Design and Evaluation, School of Pharmacy, TWM, while the toxicity of TWM is stronger than that of TP
Jiangxi Science and Technology Normal University, Nanchang at the equivalent dose [13]. However, the hepatotoxic
330013, P. R. China, e-mail: xiongyhfriend@yeah.net
mechanism of TWM and TP has not been fully clarified.
Xiaojie Liu, Cong Hu, Hongwei Li, Linjing Wu, Xilan Tang, Siyu Deng:
Jiangxi Provincial Key Laboratory of Drug Design and Evaluation,
The hepatotoxic mechanism of TP may include oxidation
School of Pharmacy, Jiangxi Science and Technology Normal stress [14,15], lipid peroxidation [16], inhibition of mito-
University, Nanchang 330013, P. R. China chondrial respiratory chain [17], DNA damage and
Open Access. © 2021 Xiaojie Liu et al., published by De Gruyter. This work is licensed under the Creative Commons Attribution 4.0
International License.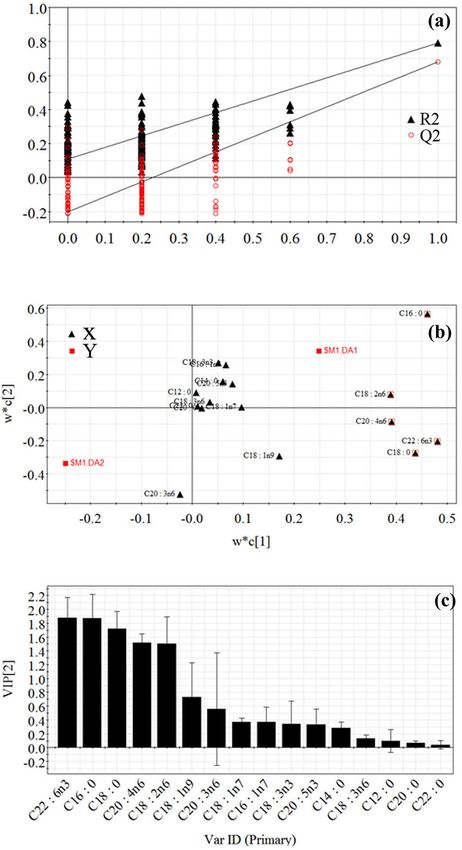
Metabolic profiling of fatty acids in TWM- and TP-induced liver injury 185
hepatocyte apoptosis [18]. A toxic dose of TP could induce China). The other chemical reagents were purchased from
obvious changes in the serum levels of different types of Xilong Scientific Co., Ltd (Guangdong, China).
lipids such as total free fatty acids, triglycerides and phos-
pholipids in rats [19]. However, it is still unclear whether
TP induces the metabolic profile dynamics of fatty acids in
animals with liver injury. 2.2 Chemical analysis of TWM by
Sex difference in lipid metabolism was also obviously electrospray ionization quadrupole
observed in the TP-treated rat liver. The levels of total free time-of-flight mass spectrometry
fatty acids, triglycerides and total bile acids were much
(ESI-Q-TOF-MS/MS)
higher in the female rats in comparison to the male rats
treated by TP [19]. Therefore, in this study, we introduced
The components of TWM powder were extracted using
a metabolomic approach to observe the changes in the
methanol by the ultrasonic method. The ultra-high per-
fatty acid metabolic profile of TWM- and TP-treated female
formance liquid chromatography (UHPLC) analysis was
rats with liver injury. Free and esterified fatty acids in
performed on a Shimadzu system (Kyoto, Japan) that
the serum and liver of rats were quantitatively determined
consists of an LC-30AD solvent delivery system, a DGU-
by gas chromatograph-mass spectrometry (GC-MS). More-
20A3 degasser, an SIL-30ACXR autosampler, a CTO-30AC
over, chemometrics such as principal component analysis
column oven and a CBM-20A controller. TWM ingredients
(PCA) and partial least squares-discriminant analysis
were separated on an Ultimate UHPLC XB C18 column
(PLS-DA) were used to discover the discrepancies in the
(1.8 µm, 100 mm × 2.1 mm i.d.; Welch Technologies,
metabolic profiling of fatty acids between control and
Shanghai, China) at a flow rate of 0.3 mL/min. The mobile
TWM-/TP-induced liver injured rats. We aimed (1) to
phase comprised 0.1% formic acid in water (solvent A)
identify potential fatty acid biomarkers for TWM- and
and acetonitrile (solvent B). The linear gradient elution
TP-caused hepatic damage and (2) to explore the correla-
was utilized with the following step: the initial composi-
tions between TWM-/TP-induced liver injury and serum
tion of 85% A and 15% B was changed to 70% A and 30%
fatty acid metabolic profile. These results may provide
B in 5 min and then maintained for 15 min, and then, B
not only a new method for the study of hepatotoxicity of
was increased to 40% in 10 min followed by an increase
Chinese herb but also a complementary approach for DILI
to 70% in another 10 min. The ESI-Q-TOF-MS/MS detec-
diagnosis in clinic.
tion was carried out on a Triple TOF™ 5600 + system in a
positive ion mode (AB SCIX, CA, USA). Ion spray voltage
and collision energy were optimized to 4.5 kV and 35 eV,
respectively. The duo spray source temperature was set
2 Materials and methods to 550°C. MS/MS data were analyzed using Peak View
Software™ 1.2 (AB SCIEX, CA, USA).
2.1 Chemical reagents
TWM was obtained from Qianjin Xieli Pharmaceutical Co., 2.3 Animals and chemical treatment
Ltd (Hunan, China). TP (>98% pure) was provided by Guilin
Sanjin Biologics Co., Ltd (Guanxi, China). Docosahexaenoic Seven- to nine-week-old female Sprague-Dawley rats
acid (C22:6n3), docosanoic acid (C22:0), eicosapentaenoic weighting 200 ± 20 g (SPF grade, Certificate number:
acid (C20:5n3), eicosatrienoic acid (C20:3n6), arachidonic acid SCXK2016-0002) were purchased from Silaike Jingda
(C20:4n6), arachidic acid (C20:0), nonadecadienoic Experimental Animal Co., Ltd (Hunan, China). Animals
acid (C19:2n6), γ-linolenic acid (C18:3n6), α-linolenic were permitted to acclimatize for 7 days in a 12 h light/dark
acid (C18:3n3), linoleic acid (C18:2n6), oleic acid (C18:1n9), cycle with regulated temperature and relative humidity.
cis-vaccenic acid (C18:1n7), stearic acid (C18:0), palmitic All animals were given free access to standard rat chow
acid (C16:0), palmitoleic acid (C16:1n7), myristic acid (the fatty acid composition is shown in Figure A1) pur-
(C14:0) and lauric acid (C12:0) were purchased from Nu- chased from COFCO Feed Co., Ltd (Hubei, China) and tap
Chek Prep (Elysian, MN, USA). Their purities were above water. The animals were randomly assigned to three
98%. Trimethylsilane diazomethane (TMSCHN2) in n-hexane groups. Control rats (n = 10) were administered with dis-
(2 mol/L) was purchased from Energy Chemical (Shanghai, tilled water containing 0.5% sodium carboxymethyl
186 Xiaojie Liu et al.
cellulose (CMC-Na). TWM-treated rats (n = 10) received using 100 µL trimethylsilyldiazomethane (TMSCHN2) in
3.5 g/kg TWM dissolved in 0.5% CMC-Na. TP-treated rats n-hexane (2 mol/L) under the condition of vortex for
(n = 10) received 2.1 mg/kg TP dissolved in 0.5% CMC-Na. 2 min at 25°C. Finally, the reaction was quenched with
Blood samples were collected 24 h after TWM and TP 100 µL of acetic acid. The reaction solution was evapo-
administration. At the end of the experiments, the rats rated to dryness under nitrogen and then reconstituted in
were sacrificed by euthanasia using pentobarbital sodium, 500 µL of n-hexane. Esterified fatty acids were methy-
and livers were subsequently collected. All animals were lated in the solution of 0.4 M KOH–CH3OH according to
handled in accordance with the standards for laboratory the method suggested in the previous study [3]. An ali-
animals (GB14925-2001). The Care and Use of Laboratory quot (1 µL) of the n-hexane solution was injected into the
Animals protocols were strictly performed. GC-MS system for analysis.
Ethical approval: The research related to animal use has
been complied with all the relevant national regulations
and institutional policies for the care and use of animals 2.6 Liver sample preparation for GC-MS
and has been approved by Animal Ethics Committee of analysis
Jiangxi Science & Technology Normal University.
One hundred milligrams of liver sample were homo-
genized twice by homogenizer (Kinematica, Luzern, Swiss)
at 3,000g for 30 s with 1,000 µL solution of methanol–
2.4 Biochemical assays and histopathology chloroform–water (2:1:0.8, v/v/v) under an ice bath con-
dition. The homogenate was centrifuged at 20,000g for
After rat sacrifice, the collected blood was centrifuged at 15 min at 4°C. After the supernatant being dried under
3,000g for 5 min at 4°C to obtain serum. The levels of nitrogen, free and esterified fatty acids in the residue
serum chemical indicators including alanine amino- were methylated with the same method as serum sample
transferase (ALT), aspartate aminotransferase (AST), preparation for the GC-MS analysis.
alkaline phosphatase (ALP) and total bilirubin (TBIL)
were measured using analyte-specific kits (Rongsheng
Biotech, Shanghai, China) according to manufac-
turer’s protocols. Liver sections were randomly 2.7 GC-MS analysis
selected for histological examination. Slide sections
were fixed in 4% paraformaldehyde in 0.1 M phos- The fatty acid analysis was carried out in a 6890 GC-5973
phate-buffered saline (PBS) for 24 h and routinely MS system (Agilent, CA, USA). The analysis conditions
embedded in paraffin wax and sliced at 5 µm thick- can be referred to from the method in the previous study
ness. After deparaffinization, the sections were stained [3]. Briefly, methyl ester of fatty acids was separated on
with hematoxylin and eosin for examination by the a DB-225MS capillary column (0.25 µm, 60 m × 0.25 mm
microscopy system. i.d.; Agilent, CA, USA). The initial temperature of the
oven was set at 70°C (held for 1 min), then increased to
200°C at the rate of 40°C/min (held for 20 min) and finally
increased to 230°C at the rate of 5°C/min (held for 5 min).
2.5 Serum sample preparation for GC-MS The electron impact was operated at 70 eV. Four fragments
analysis of m/z 55, 74, 67 and 79 were simultaneously acquired
using selective ion monitoring.
Methyl esterification method of free fatty acids was car-
ried out as follows: 20 µL of internal standard solution
(C19:2n6, 1,000 µg/mL) was added to 100 µL of serum.
Subsequently, serum was deproteinated with 900 µL 2.8 Data processing and statistical analysis
solution of chloroform–methanol (2:1, v/v). An aliquot
of supernatant (500 µL) was evaporated to dryness under GC-MS data were processed by enhanced MSD ChemStation
nitrogen. The residue was dissolved in 1,000 µL solution software (Agilent, CA, USA). PCA and PLS-DA were con-
of methanol–toluene (1:1, v/v), and it was methylated ducted by SIMCA-P 11.5 edition (Umetrics, Umea,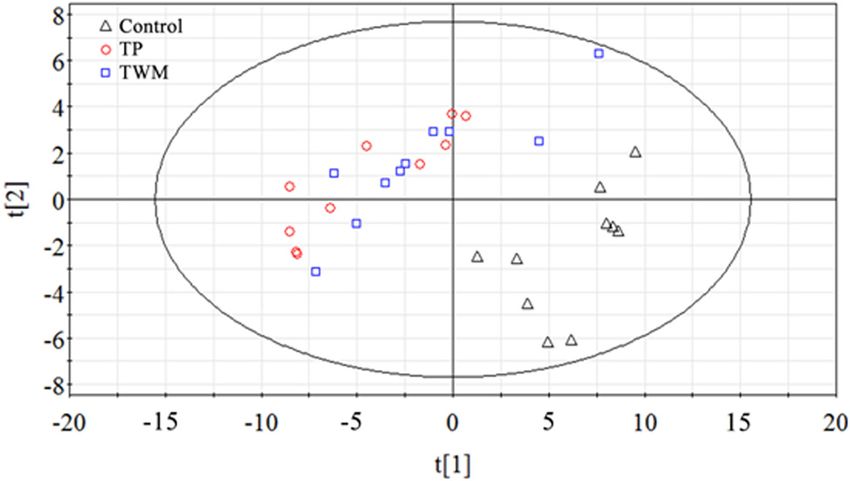
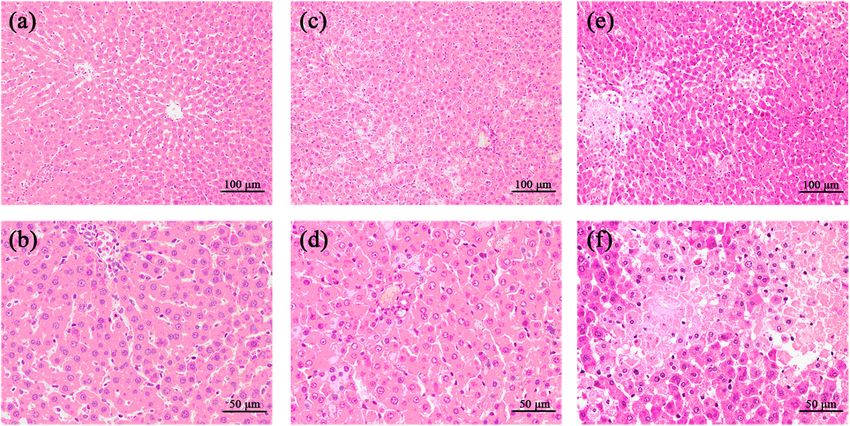
Metabolic profiling of fatty acids in TWM- and TP-induced liver injury 187 Sweden). Pearson’s correlation analysis was performed including ALT, AST, ALP and TBIL when compared with using SPSS 18.0 software (SPSS, Chicago, IL, USA). The control rats (p < 0.001 and p < 0.05). The serum levels of results for continuous variables were expressed as mean ± ALT and AST in TP-treated rats significantly elevated standard deviation. Differences between two groups were compared to the control rats (p < 0.05). The histo- significantly tested using two-tailed Student’s t-tests in pathology of livers was also examined 24 h post-TWM SPSS 18.0 software. A p-value of
188 Xiaojie Liu et al.
in the TWM-treated group when compared with that in
12,14-Dihydroxy-3-oxo-
1-Desacetylwilforgine
the control group. Importantly, the serum level of C16:0
abieta-8,11,13-triene
in the TP-treated groups downregulated ∼3 folds. In
Wilfordconine
addition, the serum levels of esterified fatty acids includ-
Compounds
Wilforlide B
Celacinnine
Celabazine
Euonymine
Wilforidine
Wilformine
Wtlfordine
Wilfordine
Wilforgine
Celafurine
Wilforzine
Triptolide
ing C12:0, C14:0, C16:0, C18:0, C18:2n6, C18:3n6, C20:4n6,
C20:5n, C22:0 and C22:6n3 in the TP-treated group and
C18:0, C20:4n6, C20:5n3, C22:0 and C22:6n3 in the TWM-
treated group were significantly decreased when com-
pared with that of the control group. Moreover, the serum
315.2420, 223.1104, 201.0915, 157.0989, 145.0989, 129.0672, 121.0649
level of C20:4n6 in the TWM-treated group downregulated
∼2 folds.
850.2846, 746.2603, 686.2387, 704.2495, 206.0802, 178.0851
840.2633, 798.2544, 686.2387, 704.2501, 206.0800, 178.0851
3.4 GC-MS analysis of fatty acids in rat liver
281.1883, 9.1425, 215.1412, 189.1267, 147.0790
tissue
788.2681, 728.2488, 686.2387, 206.0798
788.2701, 778.2862, 704.2498, 206.0796
856.2573, 846.2717, 828.2633, 674.2386
435.3303, 322.2473, 209.1636,114.0907
258.1936, 202.1207, 160.1102, 131.0477
The determined levels of free fatty acids and esterified
fatty acids in the liver tissue are summarized in Table A1.
866.2814, 856.2954, 838.2866
798.2540, 206.0801, 178.0849
762.2518, 752.2670, 194.0789
808.2743, 206.0796, 78.0849
249.1213, 166.0847, 160.1108
These data indicated that the higher levels of fatty acids
in liver tissue were observed in TWM- and TP-treated
groups when compared with the control group. As shown
176.1049, 160.1104
in Figure 4, the concentrations of all determined free fatty
Fragment ions
acids except C18:3n6, C20:0 and C20:5n3 in TP-treated
rats and all determined free fatty acids in TWM-treated
rats were significantly higher than those of control rats.
More importantly, the levels of C16:0, C18:0, C18:1n9,
C18:1n7, C18:2n6 and C22:6n3 in TWM- and TP-treated
rats have been upregulated 2–5 folds. As shown in
806.2866
806.2866
406.2489
780.2709
816.2709
868.3022
874.2764
453.3362
884.2972
380.2333
361.1645
858.2815
826.2917
370.2125
317.2111
Figure 5, the concentrations of esterified fatty acids
m/z
including C16:1n7, C18:0, C18:1n9, C18:2n6 and C20:3n
Table 1: Main compounds in TWM identified by UHPLC-Q-TOF-MS/MS
in the TP-treated group and C16:1n7, C18:0, C18:1n9,
C18:2n6, C18:3n6, C20:3n6 and C20:5n3 in the TWM-
Product ion
treated group significantly increased when compared
H]+
H]+
H]+
H]+
H]+
H]+
H]+
H]+
H]+
H]+
H]+
H]+
H]+
H]+
H]+
with the control group.
+
+
+
+
+
+
+
+
+
+
+
+
+
+
+
[M
[M
[M
[M
[M
[M
[M
[M
[M
[M
[M
[M
[M
[M
[M
3.5 Multivariate statistical analysis
PCA and PLS-DA were used to investigate the metabolic
C23H29O2N3
C43H49O18N
C43H49NO19
C38H47O18N
C38H47O18N
C41H47O20N
C36H45O18N
C39H45O18N
C21H27O3N3
C25H31O2N3
C41H47O19N
C41H47O17N
Molecular
C20H24O6
C30H44O3
C20H28O3
profiles of serum fatty acids for TMW- and TP-induced
formula
liver injury. Thirty-two variables including 16 free and
16 esterified fatty acids in serum were first analyzed
by PCA of two principal components (PC1 and PC2). The
two PCs explained 83.1% of the systematic variation. As
tR (min)
5.48
5.94
3.49
33.28
35.38
31.03
35.26
37.23
8.73
36.18
29.41
8.41
shown in the two-dimension score plot (Figure 6), TWM-
33.8
2.5
29.1
and TP-treated groups were combined together, and both
of them could be clearly distinguished from the control
Peaks
group. The PCA result showed that the serum fatty acid
10
14
12
13
15
metabolic pattern was different between control and two
11
8
6
4
9
2
3
7
5
1Metabolic profiling of fatty acids in TWM- and TP-induced liver injury 189 Figure 2: Assay of biochemical indicators in the serum of TWM- and TP-induced liver injured rats. *P < 0.05, **P < 0.01 and ***P < 0.001, significantly different from the control group. Figure 3: Histopathology of liver tissue 24 h after TWM and TP administration. Representative slides are shown at two magnifications (200× and 400×). (a/b), control group; (c/d), TP-treated group; (e/f), TWM-treated group. toxic groups. A previous study by our group indicated models to identify potential biomarkers of TWM- and TP- that serum free fatty acids could be promising biomarkers induced liver injury. The first PLS-DA model was con- of DILI since these species play key roles in many meta- structed by serum samples from the control and the bolic processes [3]. Thus, 16 determined serum free fatty TP-treated group. Values of R2X, R2Y and Q2 in the model acids as X variables were employed to construct PLS-DA were 92.1, 79.2 and 68.1%, respectively, which indicated
190 Xiaojie Liu et al.
Table 2: Serum concentrations of free and esterified fatty acids derived from control, TP-treated and TWM-treated rats measured by GC-MS
Fatty acids Control TP treated TWM treated
Free fatty acids C12:0 0.42 ± 0.09 0.38 ± 0.12 0.51 ± 0.20
C14:0 1.67 ± 0.77 0.71 ± 0.37* 1.48 ± 0.91
C16:0 71.24 ± 18.71 27.96 ± 8.12*** 46.85 ± 13.71*
C16:1n7 2.46 ± 0.51 1.47 ± 0.40*** 2.61 ± 1.05
C18:0 91.51 ± 22.09 49.9 ± 9.13*** 53.12 ± 9.37**
C18:1n9 33.22 ± 5.12 24.7 ± 7.03* 38.33 ± 10.81
C18:1n7 5.27 ± 0.82 3.32 ± 0.61*** 4.95 ± 1.26
C18:2n6 76.7 ± 13.76 44.93 ± 9.11*** 63.10 ± 14.59
C18:3n6 7.43 ± 0.12 7.18 ± 0.08*** 7.38 ± 0.15
C18:3n3 8.55 ± 0.39 7.87 ± 0.39** 8.24 ± 0.37
C20:0 1.47 ± 0.06 1.38 ± 0.06** 1.43 ± 0.17
C20:3n6 7.77 ± 0.31 8.10 ± 0.68 8.75 ± 0.62**
C20:4n6 76.87 ± 15.06 44.56 ± 8.43*** 50.70 ± 9.22***
C20:5n 17.61 ± 1.08 16.00 ± 0.82** 17.07 ± 0.76
C22:0 8.11 ± 0.04 8.07 ± 0.05** 8.08 ± 0.22*
C22:6n3 162.74 ± 24.78 111.24 ± 19.48*** 135.96 ± 17.05*
Esterified fatty acids C12:0 0.12 ± 0.05 0.05 ± 0.03** 0.30 ± 0.21*
C14:0 1.74 ± 0.50 1.12 ± 0.51* 2.74 ± 1.65
C16:0 161.63 ± 32.55 88.30 ± 29.37*** 125.97 ± 44.7
C16:1n7 3.58 ± 0.78 2.98 ± 1.13 4.93 ± 1.90
C18:0 155.81 ± 22.67 102.67 ± 26.91** 119.31 ± 28.59**
C18:1n9 70.31 ± 20.45 70.9 ± 33.68 89.87 ± 28.23
C18:1n7 7.84 ± 2.14 5.64 ± 3.33 8.71 ± 4.84
C18:2n6 198.83 ± 45.29 128.34 ± 43.52** 174.31 ± 77.43
C18:3n6 3.35 ± 0.62 2.27 ± 0.46** 2.80 ± 1.04
C18:3n3 4.59 ± 1.12 4.09 ± 1.10 4.81 ± 1.71
C20:0 3.61 ± 0.10 3.51 ± 0.13 3.54 ± 0.23
C20:3n6 11.16 ± 0.90 13.45 ± 3.77 13.37 ± 3.04
C20:4n6 353.62 ± 41.43 194.6 ± 49.08*** 179.28 ± 29.58***
C20:5n3 32.55 ± 7.90 19.27 ± 5.53** 20.95 ± 5.94**
C22:0 5.83 ± 0.08 5.70 ± 0.07*** 5.68 ± 0.06**
C22:6n3 425.97 ± 55.24 241.62 ± 96.4*** 278.46 ± 93.7**
Note: Values are expressed in μg/mL as mean ± standard deviation. *P < 0.05, **P < 0.01 and ***P < 0.001, significantly different from the
control group.
that the model has good explanatory ability to variables treated groups. Therefore, the second PLS-DA model
(including X and Y) and good predictive ability to the (R2X = 87.5%, R2Y = 67.1% and Q2 = 48%) was recon-
model. The model was further verified by permutation structed after the two species were eliminated. This mea-
test (n = 200). As shown in Figure A2-a, all red Q2-values sure could avoid erroneous conclusion by PLS-DA.
were lower than the original points to the right, and the Figure A3 shows that the most important variables on
black regression line of the Q2-points intersected the ver- classification were considered as C16:0, C18:0, C20:4n6
tical axis below zero, which demonstrated that the ori- and C22:6n3. In short, the above analysis suggested that
ginal PLS-DA model was valid. Loading plot (Figure A2-b) four free fatty acids (including C16:0, C18:0, C20:4n6 and
and variable importance in the projection (VIP) values C22:6n3) were identified as common potential biomarkers
(Figure A2-c) showed that the most important variables of TP- and TWM-induced liver injury. Pearson’s correla-
on classification were considered as C16:0, C18:0, C18:2n6, tion analysis was applied to measure the correlations
C20:4n6 and C22:6n3. The second PLS-DA model from between serum concentrations of the four candidate fatty
control and TWM-treated groups was similarly con- acid biomarkers (including free and esterified fatty acids)
structed. However, there was no significant difference and the activities of ALT and AST that currently served as
in the serum levels of C18:1n9 and C18:2n6 with VIP > clinical indicators of hepatic damage. Pearson’s correlation
1.0 in the PLS-DA model between control and TWM- analysis result showed that all correlation coefficients (r)Metabolic profiling of fatty acids in TWM- and TP-induced liver injury 191
were lower than zero, suggesting that these four fatty the study’s aim on the correlation between fatty acid
acids were negatively correlated with the two amino- metabolic profiling and TP-/TWM-caused liver injury.
transferases (Table A2). Moreover, free and esterified fatty Fatty acid levels in serum and liver tissues are sensi-
acids for C20:4n6 in TWM-induced liver injury were tively influenced by chemical liver injury, and thus, we
strongly correlated with the two aminotransferases (r < study this level changes to show the damage in the liver.
−0.7). Altogether, chemometric and correlation ana- In this article, the presented concentration data showed
lyses demonstrated that the four fatty acid biomarkers an opposite change trend of serum and liver fatty acid
and their metabolic profiling could be used as promising levels after TWM or TP administration: a decrease in
diagnostic indicators for TWM- and TP-caused hepatic serum levels and an increase in levels of fatty acids
damage. in the liver including free and esterified fatty acids.
β-Oxidation, the most important metabolic pathway for
fatty acids, is regulated by L-carnitine and rate-limiting
enzyme carnitine palmitoyltransferase I (CPT I), which
4 Discussion was responsible for fatty acyl CoA transport from cyto-
plasm to mitochondria. Moreover, peroxisome prolif-
Except for reproductive toxicity, other toxicities such as erator-activated nuclear receptor (PPARα) can adjust
hepatotoxicity and nephrotoxicity showed gender differ- the activity of CPT I [21,22]. β-Oxidation of fatty acids in
ences. Due to specifically expressed CYP3A2 in male rats testicle was irreversibly restrained after TP administra-
resulting in acceleration of TP metabolism, TP-treated tion by decreasing the levels of L-carnitine, acetyl-L-car-
female rats exhibited greater toxicity when compared to nitine and PPARα protein expression, resulting in the
male rats [20]. Therefore, female rats were used to develop accumulation of free fatty acids in the testicular tissue
TP- and TWM-induced liver-injured rat models based on [23]. This study offered further proof that TWM and TP
Figure 4: Assay of free fatty acids in the liver of TP-treated and TWM-treated rats. *P < 0.05, **P < 0.01 and ***P < 0.001, significantly
different from the control group.192 Xiaojie Liu et al.
Figure 5: Assay of esterified fatty acids in the liver of TP-treated and TWM-treated rats. *P < 0.05, **P < 0.01 and ***P < 0.001, significantly
different from the control group.
was induced by oxidative stress injury in TWM- and TP-
treated rats, leading to a significant decrease in serum
levels of most of fatty acids, especially polyunsaturated
fatty acids.
C20:4n6, a ω-6 polyunsaturated fatty acid, is a pre-
cursor of many active endogenous substances, such as
various inflammatory factors, in the body. C20:4n6-related
inflammatory metabolic pathway was regulated by phos-
pholipase A2 (PLA2), the activity of which was positively
correlated with Ca2+ concentration in the hepatic cell. The
significant elevated level of Ca2+ in hepatocyte was deter-
Figure 6: PCA score plot derived from three representative control mined in TP-induced liver-injured rats [24,25]. Therefore,
(Δ), TWM-treated (□) and TP-treated (○) groups using the metabolic
we speculated that overdose TP could induce C20:4n6-
profiles of serum free and esterified fatty acids. Two PCs score
visualization for sample types. The score plot showed an obvious related inflammatory metabolic pathway, resulting in
separation between control and two toxic groups. the significant decreased level of C20:4n6 in the liver.
However, in this study, the level of C20:4n6 in liver was
could inhibit the β-oxidation of fatty acids in the liver not significantly different between the TP-treated rats
according to the significantly increased levels of free and controls, which may be the combined result of fatty
and esterified fatty acids in the liver of TWM- and TP- acid β-oxidation inhibition and PLA2 activity upregula-
treated rats. Oxidative stress injury caused by reactive tion. C22:6n3, a ω-3 polyunsaturated fatty acid, could
oxygen species was one of the important mechanisms inhibit the activities of key enzymes in C20:4n6-related
of TWM and TP-induced liver toxicity. Lipid peroxidation inflammatory metabolic pathway such as PLA2 andMetabolic profiling of fatty acids in TWM- and TP-induced liver injury 193
cyclooxygenase 2, which indicated that C22:6n3 had a Data availability statement: The datasets generated during
strong anti-inflammatory effect [26]. Moreover, C22:6n3 and/or analyzed during the current study are available
could increase the expression level of CPT І by upregu- from the corresponding author on reasonable request.
lating the PPARα activity to accelerate the β-oxidation of
fatty acids [27]. C16:0 and C18:0 are the most important
long-chain saturated fatty acids for their higher concen-
trations in vivo. Nutrition research indicated that the References
serum level of saturated free fatty acids was closely cor-
[1] Pope ED, Kimbrough EO, Vemireddy LP, Surapaneni PK,
related with the development of nonalcoholic fatty liver
Copland JA, Mody K. Aberrant lipid metabolism as a thera-
disease [28]. C16:0 could induce oxidation stress in the
peutic target in liver cancer. Expert Opin Ther Targets.
hepatic cell in vitro via increased CD36 expression [29], 2019;23(6):473–83.
and it was positively correlated with inflammation. Con- [2] Chen W, Li XM, Li AL, Yang G, Hu HN. Hepatitis C virus
trarily, C18:0 was considered a potent anti-inflammatory increases free fatty acids absorption and promotes its repli-
lipid [30]. Altogether, the four serum free fatty acids cation via down-regulating GADD45α expression. Med Sci
Monit. 2016;22:2347–56.
including C16:0, C18:0, C20:4n6 and C22:6n3 played a
[3] Xiong YH, Xu Y, Yang L, Wang ZT. Gas chromatography-mass
crucial role in the development of liver injury caused by spectrometry-based profiling of serum fatty acids in acetamino-
TWM and TP, and were identified as potential biomarkers phen-induced liver injured rats. J Appl Toxicol. 2014;34(2):149–57.
of TWM- and TP-induced liver injury. [4] Mota M, Banini BA, Cazanave SC, Sanyal AJ. Molecular
mechanisms of lipotoxicity and glucotoxicity in nonalcoholic
fatty liver disease. Metabolism. 2016;65(8):1049–61.
[5] Warner DR, Warner JB, Hardesty JE, Song YL, King TN, Kang JX,
et al. Decreased ω-6:ω-3 PUFA ratio attenuates ethanol-
5 Conclusion induced alterations in intestinal homeostasis, microbiota, and
liver injury. J Lipid Res. 2019;60(12):2034–49.
In the study, TWM- and TP-treated rats can be obviously [6] Jin Y, Zhang J, Wang Y, Xiao X, Zhang Q. Tripterygium wilfordii
differentiated from control rats by PCA and PLS-DA based multiglycosides combined with prednisone in the treatment of
idiopathic membranous nephropathy: A protocol for a sys-
on the metabolic profiling of fatty acids in serum. Serum
tematic review and meta-analysis. Med (Baltim).
free fatty acids for C16:0, C18:0, C20:4n6 and C22:6n3 2020;99(5):e18970.
were considered as potential biomarkers of TWM- and [7] Xu X, Li QJ, Xia S, Wang MM, Ji W. Tripterygium glycosides for
TP-induced liver injury. Moreover, C20:4n6 in the serum treating late-onset rheumatoid arthritis: A systematic review
of TWM-induced liver injured rats exhibited a high nega- and meta-analysis. Altern Ther Health Med. 2016;22(6):32–9.
[8] Zhang Y, Jiang Z, Xue M, Zhang S, Wang Y, Zhang L.
tive correlation (r < −0.7) with ALT and AST levels.
Toxicogenomic analysis of the gene expression changes in rat
Altogether, TWM- and TP-induced liver injuries were clo-
liver after a 28-day oral Tripterygium wilfordii multiglycoside
sely related to the metabolic profiling of serum fatty exposure. J Ethnopharmacol. 2012;141(1):170–7.
acids. It clearly stated that a novel metabolomic method [9] Yuan K, Li XH, Lu Q, Zhu QY, Jiang HX, Wang T, et al. Application
based on the serum fatty acid metabolic profiling could and mechanisms of triptolide in the treatment of inflammatory
be a supplementary approach on DILI diagnosis in clinic. diseases-a review. Front Pharmacol. 2019;10:1469.
[10] Reno TA, Kim JY, Raz DJ. Triptolide inhibits lung cancer cell
migration, invasion, and metastasis. Ann Thorac Surg.
Funding: This study was financially supported by National 2015;100(5):1817–25.
Natural Science Foundation of China (NSFC No 81660692), [11] Li X, Zang A, Jia Y, Zhang J, Fan W, Feng J, et al. Triptolide
Natural Science Foundation of Jiangxi Province reduces proliferation and enhances apoptosis of human non-
(20181BAB215041), Science and Technology Project small cell lung cancer cells through PTEN by targeting miR-21.
Mol Med Rep. 2016;13(3):2763–8.
Founded by the Education Department of Jiangxi
[12] You L, Dong X, Ni B, Fu J, Yang C, Yin X, et al. Triptolide induces
Province (GJJ170683, GJJ180606), College Students
apoptosis through fas death and mitochondrial pathways in
Innovative Training Project Founded of Jiangxi Science & HepaRG cell line. Front Pharmacol. 2018;9:813.
Technology Normal University (20201404117) and Jiangxi [13] Miao YY, Luo L, Shu T, Wang H, Jiang ZZ, Zhang LY. Study on
Provincial Key Laboratory of Drug Design and Evaluation difference of liver toxicity and its molecular mechanisms
(20171BCD40015). caused by Tripterygium wilfordii multiglycoside and equiva-
lent amount of triptolid in rats. Zhongguo Zhong Yao Za Zhi.
2019;44(16):3468–77.
Conflict of interest: The authors state no conflict of [14] Wang XW, Tian RM, Yang YQ, Lu ZY, Han XD, Liu XS, et al.
interest. Triptriolide antagonizes triptolide-induced nephrocyte194 Xiaojie Liu et al.
apoptosis via inhibiting oxidative stress in vitro and in vivo. [23] Ma B, Qi H, Li J, Xu H, Chi B, Zhu J, et al. Triptolide disrupts
Biomed Pharmacother. 2019;118:109232. fatty acids and peroxisome proliferator-activated receptor (PPAR)
[15] Yuan Z, Hasnat M, Liang P, Yuan Z, Zhang H, Sun L, et al. The levels in male mice testes followed by testicular injury: A GC-MS
role of inflammasome activation in Triptolide-induced acute based metabolomics study. Toxicology. 2015;336:84–95.
liver toxicity. Int Immunopharmacol. 2019;75:105754. [24] Li W, Liu BD, Liao K, Liu Y, Wan ZJ, Dong YF, et al. Alteration of
[16] Yang B, Yan P, Yang GZ, Cao HL, Wang F, Li B. Triptolide androgen receptor protein stability by triptolide in lncap cells.
reduces ischemia/reperfusion injury in rats and H9C2 cells via Medicina. 2018;54(3):39.
inhibition of NF‑κB, ROS and the ERK1/2 pathway. Int J Mol [25] Yuan Z, Yuan Z, Hasnat M, Zhang H, Liang P, Sun L, et al. A new
Med. 2018;41(6):3127–36. perspective of triptolide-associated hepatotoxicity: the rele-
[17] Hasnat M, Yuan Z, Ullah A, Naveed M, Raza F, Baig MMFA, et al. vance of NF-κB and NF-κB-mediated cellular FLICE-inhibitory
Mitochondria-dependent apoptosis in triptolide-induced protein. Acta Pharm Sin B. 2020;10(5):861–77.
hepatotoxicity is associated with the Drp1 activation. Toxicol [26] Brito LF, Oliveira HBM, das Neves Selis N, Souza E, Júnior CLS,
Mech Methods. 2020;30(2):124–33. de Souza MNS, et al. Anti-inflammatory activity of β-caryo-
[18] Wei YM, Luan ZH, Liu BW, Wang YH, Chang YX, Xue HQ, et al. phyllene combined with docosahexaenoic acid in a model of
Autophagy in triptolide-mediated cytotoxicity in hepatic cells. sepsis induced by Staphylococcus aureus in mice. J Sci Food
Int J Toxicol. 2019;38(5):436–44. Agric. 2019;99(13):5870–80.
[19] Jiang Z, Huang X, Huang S, Guo H, Wang L, Li X, et al. Sex- [27] Ortiz M, Soto-Alarcón SA, Orellana P, Espinosa A, Campos C,
related differences of lipid metabolism induced by triptolide: López-Arana S, et al. Suppression of high-fat diet-induced
The possible role of the LXRα/SREBP-1 signaling pathway. obesity-associated liver mitochondrial dysfunction by doco-
Front Pharmacol. 2016;7:87. sahexaenoic acid and hydroxytyrosol co-administration. Dig
[20] Liu L, Jiang Z, Liu J, Huang X, Wang T, Liu J, et al. Sex Liver Dis. 2020;52(8):895–904.
differences in subacute toxicity and hepatic microsomal [28] Takahara I, Akazawa Y, Tabuchi M, Matsuda K, Miyaaki H,
metabolism of triptolide in rats. Toxicology. Kido Y, et al. Toyocamycin attenuates free fatty acid-induced
2010;271(1-2):57–63. hepatic steatosis and apoptosis in cultured hepatocytes and
[21] Violante S, Achetib N, van Roermund CWT, Hagen J, Dodatko T, ameliorates nonalcoholic fatty liver disease in mice. PLoS One.
Vaz FM, et al. Peroxisomes can oxidize medium- and long- 2017;12(3):e0170591.
chain fatty acids through a pathway involving ABCD3 and [29] Liu J, Yang P, Zuo G, He S, Tan W, Zhang X, et al. Long-chain
HSD17B4. FASEB J. 2019;33(3):4355–64. fatty acid activates hepatocytes through CD36 mediated oxi-
[22] Brown ZJ, Fu Q, Ma C, Kruhlak M, Zhang H, Luo J, et al. dative stress. Lipids Health Dis. 2018;17(1):153.
Carnitine palmitoyltransferase gene upregulation by linoleic [30] Gowda B, Fuda SG, Tsukui H, Chiba T, Hui H, Discovery SP. of
acid induces CD4+ T cell apoptosis promoting HCC develop- eicosapentaenoic acid esters of hydroxy fatty acids as potent
ment. Cell Death Dis. 2018;9(6):620. Nrf2 activators. Antioxid. 2020;9(5):397.Metabolic profiling of fatty acids in TWM- and TP-induced liver injury 195 Appendix Figure A1: Total ion chromatogram of free fatty acids (a) and esterified fatty acids (b) by GC-MS in the standard rat chow. (1) C12:0, (2) C14:0, (3) C16:0, (4) C16:1n7, (5) C18:0, (6) C18:1n9, (7) C18:1n7 and (8) C18:3n6.
196 Xiaojie Liu et al.
Figure A3: Permutation test plot (n = 200) (a), loading plot (b) and
VIP plot (c) in the PLS-DA model (R2X = 87.5%, R2Y = 67.1% and Q2 =
Figure A2: Analysis of candidate biomarkers of TP-induced liver 48%) derived from control and TWM-treated groups using the serum
injury using PLS-DA. The PLS-DA model (R2X = 92.1%, R2Y = free fatty acid metabolic profile. C16:0, C18:0, C20:4n6 and C22:6n3
79.2%, Q2 = 68.1%) was derived from control and TP-treated groups were identified as potential biomarkers of TWM-induced liver injury.
using the metabolic profile of free fatty acids. (a) The result of the
permutation test (n = 200) indicated that the original PLS-DA model
was valid. (b) The loading plot exhibited that the TP-induced hepatic
injury was highly correlated with C16:0, C18:0, C18:2n6, C20:4n6
and C22:6n3 marked with “□.” (c) VIP plot verified the importance
of these fatty acids with VIP > 1.0 in classification.Metabolic profiling of fatty acids in TWM- and TP-induced liver injury 197
Table A1: Concentrations of free and esterified fatty acids in liver tissue derived from control, TP-treated and TWM-treated rats measured by
GC-MS
Fatty acids Control TP treated TWM treated
Free fatty acids C12:0 1.13 ± 0.14 3.62 ± 0.74*** 6.69 ± 2.22***
C14:0 6.36 ± 2.03 19.53 ± 8.89** 42.74 ± 20.39***
C16:0 616.39 ± 159.17 1445.89 ± 468.67** 2162.29 ± 569.93***
C16:1n7 18.19 ± 6.78 52.06 ± 15.44*** 78.68 ± 28.23***
C18:0 744.20 ± 194.20 1723.37 ± 369.15*** 2299.57 ± 362.19***
C18:1n9 201.80 ± 71.02 801.93 ± 437.16** 1605.99 ± 634.54***
C18:1n7 65.30 ± 18.42 144.47 ± 44.4** 228.68 ± 59.43***
C18:2n6 557.57 ± 192.52 1514.95 ± 673.77** 2870.92 ± 1055.04***
C18:3n6 40.01 ± 2.55 47.35 ± 9.38 59.02 ± 13.06**
C18:3n3 50.37 ± 5.77 61.56 ± 8.02** 86.78 ± 18.20***
C20:0 50.45 ± 1.23 51.81 ± 1.44 54.12 ± 1.79***
C20:3n6 90.01 ± 11.29 175.79 ± 67.37** 257.38 ± 88.27***
C20:4n6 2642.14 ± 944.11 2956.26 ± 921.54 3662.93 ± 817.06*
C20:5n3 167.52 ± 48.90 184.35 ± 38.90 290.60 ± 66.67***
C22:0 40.37 ± 0.81 46.12 ± 1.60*** 47.29 ± 1.47***
C22:6n3 3041.03 ± 913.41 6288.49 ± 2679.29* 9199.99 ± 2654.3***
Esterified fatty acids C12:0 5.95 ± 0.66 4.57 ± 0.41*** 6.13 ± 0.71
C14:0 8.51 ± 3.16 10.90 ± 3.45 11.46 ± 4.05
C16:0 1959.14 ± 574.3 2415.11 ± 629.3 2087.04 ± 283.09
C16:1n7 19.00 ± 5.96 25.42 ± 6.80** 29.81 ± 10.07**
C18:0 3625.7 ± 1037.44 5488.39 ± 1357.17** 5204.89 ± 624.77**
C18:1n9 348.06 ± 122.00 618.73 ± 188.34** 680.23 ± 123.57***
C18:1n7 130.27 ± 43.63 164.23 ± 41.95 160.76 ± 19.57
C18:2n6 1480.48 ± 488.92 2247.08 ± 482.43** 2488.29 ± 324.63**
C18:3n6 19.00 ± 5.11 24.06 ± 6.68 26.51 ± 3.55**
C18:3n3 32.31 ± 3.18 31.86 ± 2.39 35.59 ± 3.35
C20:0 58.11 ± 2.96 58.99 ± 2.16 58.78 ± 0.77
C20:3n6 152.8 ± 22.27 224.97 ± 35.75*** 220.11 ± 21.86***
C20:4n6 7178.68 ± 2078.04 8356.28 ± 877.79 8197.38 ± 920.08
C20:5n3 193.77 ± 32.85 220.21 ± 35.58 242.90 ± 27.25**
C22:0 87.46 ± 2.32 87.83 ± 0.81 88.31 ± 0.49
C22:6n3 8341.72 ± 2057.19 8936.35 ± 1744.18 9403.66 ± 1406.34
Note: values are expressed in μg/g as mean ± standard deviation. *P < 0.05, **P < 0.01 and ***P < 0.001, significantly different from the
control group.
Table A2: Pearson’s correlation analysis between the serum levels of fatty acid biomarkers and two aminotransferases derived from
control, TP-treated and TWM-treated rats
TP (ALT) TP (AST) TWM (AST) TWM (AST)
Fatty acid r p R p r p r p
Free fatty acids C22:6n3 −0.479 0.038 −0.473 0.041 −0.592 0.006 −0.586 0.007
C20:4n6 −0.481 0.037 −0.470 0.042 −0.734 0.000 −0.708 0.000
C16:0 −0.500 0.029 −0.529 0.020 −0.388 0.091 −0.438 0.054
C18:0 −0.420 0.074 −0.410 0.081 −0.661 0.002 −0.659 0.002
Esterified fatty acids C22:6n3 −0.404 0.086 −0.396 0.093 −0.670 0.001 −0.654 0.002
C20:4n6 −0.408 0.083 −0.400 0.090 −0.792 0.000 −0.791 0.000
C16:0 −0.514 0.024 −0.507 0.027 −0.486 0.030 −0.456 0.043
C18:0 −0.449 0.054 −0.436 0.062 −0.676 0.001 −0.681 0.001
r, correlation coefficient. The value of r close to 1 indicates perfect correlation. Correlation significance was defined as *P < 0.05, **P < 0.01
and ***P < 0.001.You can also read