2.75D Convolutional Neural Network for Pulmonary Nodule Classification in Chest CT
←
→
Page content transcription
If your browser does not render page correctly, please read the page content below
2.75D Convolutional Neural Network for Pulmonary Nodule
                                                                 Classification in Chest CT
                                                                Ruisheng Su                                                          Weiyi Xie
arXiv:2002.04251v1 [eess.IV] 11 Feb 2020

                                             Biomedical Imaging Group Rotterdam, Erasmus MC                               Radboud University Medical Center
                                                         Rotterdam, the Netherlands                                             weiyi.xie@radboudumc.nl
                                                             ruisheng.su@hotmail.com

                                                                                     Tao Tan
                                                                    Radiology, the Netherlands Cancer Institute
                                                 Department of Mathematics and Computer Science, Technical University of Eindhoven
                                                                                             t.tan1@tue.nl

                                                                                           February 12, 2020

                                           Abstract                                                          reduction in the nodule detection pipeline. We evaluate
                                                                                                             the nodule false positive reduction system on the LUNA16
                                           Early detection and classification of pulmonary nodules in        data set which contains 1186 nodules out of 551,065 can-
                                           Chest Computed tomography (CT) images is an essential             didates. By comparing 2.75D with 2D, 2.5D and 3D, we
                                           step for effective treatment of lung cancer. However, due         show that our system using 2.75D input outperforms 2D
                                           to the large volume of CT data, finding nodules in chest          and 2.5D, yet slightly inferior to the systems using 3D
                                           CT is a time-consuming thus error prone task for radiolo-         input. The proposed strategy dramatically reduces the
                                           gists. Benefited from the recent advances in Convolutional        memory consumption thus allow fast inference and train-
                                           Neural Networks (ConvNets), many algorithms based on              ing by enabling larger number of batches comparing to
                                           ConvNets for automatic nodule detection have been pro-            the methods using 3D input. Furthermore, the proposed
                                           posed. According to the data representation in their input,       method is generic, which can be simply extended to many
                                           these algorithms can be further categorized into: 2D, 3D          neural network architectures. Our source code will be
                                           and 2.5D which uses a combination of 2D images to ap-             made publicly available.
                                           proximate 3D information. Leveraging 3D spatial and
                                           contextual information, the method using 3D input gener-
                                           ally outperform that based on 2D or 2.5D input, whereas its       1    Introduction
                                           large memory footprints becomes the bottleneck for many
                                           applications. In this paper, we propose a novel 2D data           Lung cancer is the first leading cause of cancer deaths
                                           representation of a 3D CT volume, which is constructed            worldwide, with 1.8 million new cases being diagnosed
                                           by spiral scanning a set of radials originated from the 3D        each year. Lung Cancer is the second leading cause of
                                           volume center, referred to as the 2.75D. Comparing to the         death globally, about 1 in 6 deaths is due to cancer. The
                                           2.5D, the 2.75D representation captures omni-directional          effectiveness of state-of-the-art cancer treatments still heav-
                                           spatial information of a 3D volume. Based on 2.75D repre-         ily depends on the phase at which the cancer is diagnosed.
                                           sentation of 3D nodule candidates in Chest CT, we train a         For example, the five-year survival rate for localized stage
                                           convolutional neural network to perform the false positive        of non-small cell lung cancer is 60%, whereas that for dis-

                                                                                                         1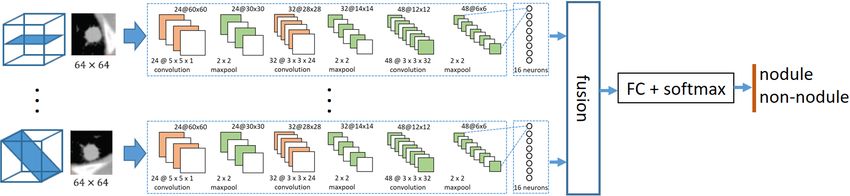
tant stage is only 6%. However, only 16% percent of lung            structural information not only on the x-y plane, but also
cancer cases are diagnosed at an early stage [27]. Similarly,       on the z direction. Contributed by much richer input infor-
the five-year survival rate of bladder cancer diagnosed at          mation, 3D CNN generally outperforms the 2D CNN with
localized stage and distant stage are 95% and 5% respec-            similar architectures when a significant larger training set
tively. About half of people are diagnosed after localized          is a available, yet costs more memory and computational
stage [35]. Clearly, early and robust cancer diagnosis is of        power on both training and testing phases. When limited
crucial importance for improving patient survival rates by          training samples are given, it is not feasible to perform
effective cancer treatments, yet full of challenges ahead.          transfer learning compared to 2D approach when a large
   CT is the most common imaging modality for early lung            number of nature images are available.
cancer screening, from which a series of x-ray images are              With the goal of achieving high classification perfor-
taken from different angles around the body of the patient.         mance without significantly increasing computation costs,
In current practice, CT images are read manually by radiol-         many 2D CNN methods have been proposed for cancer
ogists. This manual step of identifying suspicious lesions          nodule classification in CT images. The 2D and 2.5D
from a large number of normal samples is considered ex-             strategies typically yields relatively less model parameters,
perience demanding and error prone due to the nodule                thus more computationally efficient. This strategy usually
diversity in shape and size. What is more, it is very time          obtains one or more 2D patches from cuts with different
consuming, leading to low efficiency for hospitals and high         angles of a volume of interest (VOI) at the center. The
diagnosis cost for patients.                                        most common cuts are from three orthogonal planes. This
   To make early lung cancer screening using CT imaging             approach has been applied extensively for breast cancer de-
feasible, many Computer Aided Diagnostic (CAD) sys-                 tection in automated 3D breast ultrasound, lung CT nodule
tems have been proposed in the past decades. Their aims             detection, etc. An extension of patches from three orthogo-
[34] were to improve one or more steps of a typical CAD             nal planes is to take patches from more than three different
system: organ segmentation[12, 10], nodule detection[3,             angles around a fixed axis through the center of the VOI.
18, 8, 23, 20], nodule segmentation[41, 18, 19], and nodule         Next, each 2D patch is fed into a neural network, which is
diagnosis[40, 17].                                                  then fused either within the networks or after the last fully
   In this paper, we propose a novel strategy, which can            connected layer of each CNN stream. For example, Setio
contribute to the false positive step reduction in nodule           et al. [31] proposed to extract 9 slices from various sections
detection and diagnosis in CT images. False positive reduc-         of each 3D nodule volume, each trained with a 2D CNN
tion is a major component in CAD systems to identify and            stream separately, the outputs neurons of which are then
classify a relatively small amount of suspicious nodules            fused into the final classification result. The paper [31]
out of a large nodule CT image set. In the past few years,          also shows that multi-view based CNN outperforms signal
many deep learning based methods have been explored for             view based CNN. That is to say, the 2.5D strategy captures
cancer nodule classification in CT images, among which              more useful spatial information than the 2D strategy. In
Convolutional Neural Networks (CNNs) have been ex-                  order to best exploit the texture information of the nodule
ceptionally successful due to its ability to hierarchically         itself and its surroundings in various zoom levels, Shen
capture texture information.                                        et al. [33] proposed to utilize multi-scale nodule patches
   Based on the dimension of the input image and con-               to train independent 2D CNNs simultaneously and then
volution function, most CNN based methods for nodule                concatenate output neurons obtained from each input scale
classification can be categorized into three strategies: 1).        before the final binary classification layer.
single-view 2D CNN (2D strategy). 2). multi-view 2D                    These 2.5D approaches have shown their advantages
CNN (2.5D strategy)[31, 22, 39, 25, 21], 3). volume-based           in terms of accuracy over 2D approaches and require less
3D CNN (3D strategy)[33, 7, 15, 6, 1, 5, 28, 9, 2, 13].             training samples and less training parameters compared
   For the volume-based 3D CNN strategy, 3D volume                  to the 3D strategy. However, as only 2D information are
cubes which contain a candidate nodule are directly fed             extracted and the favorably diagnostic information in 3D
into a 3D CNN model, resulting a binary classification              is lost, the classification results are typically inferior to 3D
output. The 3D Volume of Interest (VOI) contains the                CNN based methods.

                                                                2
Given comparable CNN models, more spatial texture 2.1 Patch extraction using spiral scanning
information typically means higher classification accuracy.
For 2.5D, taking more patches from VOI at various posi-
tions or angles would provide more information to CNN
model. However, too many 2D patches from each VOI The workflow of using spiral scanning technique to trans-
will also increase the number of parallel CNN streams to form a 3D volume to a 2D image is illustrated in Fig. 1.
be used and deployed. It is also a challenge to fuse the First, given a 3D cubic volume of size d·d·d, a sphere with
information in an optimized way. a radius of r = d/2 is defined at the volume center. Next,
we transform the spherical VOI into a 2D re-sampled im-
Aiming for achieving comparable classification perfor-
age using a set of radial lines originating from the sphere
mance as 3D CNN based methods and meanwhile being
center to the surface. To best preserving the spherical 3D
computational efficient as 2D CNN based methods, in this
spatial information while reducing dimensions from 3D
study, we propose a novel 2.75D strategy training scheme.
to 2D, a set of surface sample points are selected such
In essence, each 3D VOI is represented by only one 2D
that they are evenly distributed along a spiral line on the
image in such a way that the 2D image contains maximized
spherical surface, which originates from the north pole
stereo texture information.
and ends at the south pole. By connecting the sphere
The contributions of this paper are as follows: (1) We center with each surface points, a set of radial lines are
propose a CNN based strategy using a 2.75D representa- defined. Finally, the intensities along each radial line are
tion of VOI as neural network input for cancer classifica- sampled into an array of length w. All the sampled radial
tion in CT images. To our best knowledge, this is the first lines are arranged as columns in a sequential order, which
work to represent the 3D volume as a single 2D image results to a 2D re-sampled image. The original spiral scan-
among CNN based methods for classification. (2). The ning method was proposed for in the favor of performing
proposed 2.75D can make use the important advantage of dynamic programming for segmentation purposes which
transfer learning from 2D nature images. (3) We evaluate makes perfect sense to search a curve to delineate lesion
the proposed strategy on the LIDC-IDRI datasets and com- boundary. However, from the first intuition, from human
pare its performance with the comparable 2D, 2.5D and eyes it is very challenging to perform classification tasks.
3D strategies. In our study, we innovatively leverage this representation
The remaining of this paper is organized as follows. for data-driven deep learning scheme.
First, the proposed algorithm is described in section 2.
In section 3, we explain the dataset used for algorithm Using the spiral scanning technique [38], the radial lines
evaluation and comparison. Next, experiment setup is and their corresponding surface sample point are deter-
detailed out in section 4, where the exact neural network mined by two angles: azimuth (longitude) angle α ∈ [0, π]
architectures of various strategies are explained. In section and elevation (latitude) angle β ∈ [0, 2π]. Suppose that
5, we discuss the comparison outcomes between strategies. the spiral line is densely around the sphere, the length
Finally, section 6 summarizes the conclusions of this paper. of the spiral line would be approximately equal to the
sum of circumferences of a number of separate horizontal
circles. For simplicity, the number of surface points are
calculated based on this approximation. Suppose the angle
step is π/N , the azimuth and elevation angles are evenly
2 2.75D strategy divided into N (αk = kπ/N, k = 0, 1, 2, ..., N ) and 2N
(βk = kπ/N, k = 0, 1, 2, ..., 2N ) sections, respectively.
Inspired by the idea of [38], we propose a novel spiral The number of sample points on a horizontal circle at α can
view convolutional neural network based strategy, named be expressed as 2π| sin(alpha)|/(π/N ), i.e., 2N sin(α),
the 2.75D strategy. We extract a 2D spiral view from each regardless of the sphere radius. Therefore, the total number
3D VOI and feed those images into 2D CNNs for cancer of sample points on the sphere surface is approximately
nodule classification tasks. 4N 2 /π when N is large, as calculated in equation 1.
3Figure 1: Workflow of 3D volume to 2D image transformation using spiral scanning. Each dotted line in red color
represents a sampled radial line originated from sphere center to a sampled surface point. 32 intensity values are on
each sampled radial line, which forms one column in the transformed 2D image. 43 radial lines from top to bottom of
the sphere are ordered from left to right in the transformed 2D image.
making a fair comparison of cancer nodule classification
strategies which take different input dimensions and differ-
N Z N
X ent dimensions of convolution function, rather than finding
2N | sin(kπ/N )| ≈ 2N | sin(kπ/N )|dk
0 a specific deep learning model which performs the best on
k=0
Z N
the cancer nodule classification task.
= 2N (N/π)| sin(kπ/N )|d(kπ/N ) The specific convolutional neural network configura-
(1)
0
Z π tions used for experiments are described in section 4.3.4.
= 2N 2 /π | sin x|dx
0
= 4N 2 /π 3 Materials
After spiral scanning, we get a 2.75D representation for In this paper, we use the Lung Image Database Consor-
each 3D VOI of the cancer candidates, which is essentially tium (LIDC-IDRI) [4] dataset, which is a publicly available
a 2D image, which consists of 3D texture information. dataset for development, training and evaluation of various
computer-aided diagnostic (CAD) methods for lung cancer
detection and diagnosis. The dataset contains 1018 cases
2.2 2.75D based neural network
from seven institutions and their corresponding nodule
In such a way, the 3D volume classification problem is annotations. The slice thickness of the CT scans vary be-
transformed into a regular 2D image classification prob- tween 2.5 mm and 5.0 mm. The CT scans with either slice
lem. Various 2D deep learning models can be applied to thickness larger than 2.5mm or inconsistent slice thickness
the spiral images. This method is not bundled with any are removed from the dataset, resulting 888 scans.
specific deep learning models. In this work, we focus on The dataset comes along with a list of annotated nodule
4candidates by four experienced thoracic radiologists. In pixel intensity range from (-1000, 400 Houndsfield Unit
the initial blinded-read phase, suspicious nodules are inde- (HU)) to (0,1) and clipped the intensity beyond this range.
pendently annotated into 3 nodule types: nodule >= 3mm,
nodule < 3mm, non-nodule. In the subsequent unblinded-
read phase, the nodule annotations from each radiologist 4.2 Data Augmentation
are reviewed along the annotations of the other radiologists.
While reviewing, own annotations are updated if consid- Data augmentation is a widely used technique to increase
ered necessary by each radiologist independently. In the the number of training and validation data samples to avoid
end, a list of suspicious nodules which are annotated up to imbalanced training and validation data sample sizes. A
4 times by all radiologists are obtained. The nodules which balanced and sufficiently large dataset is import for model
are >= 3mm and annotated by >= 3 out of 4 radiologists, robustness and overfitting prevention.
resulting 1186 nodules, are used as the reference standard In this experiment, the nodule sample size is 1555,
for the false positive reduction task. whereas the non-nodule sample size is 750386, which
For each CT scan, a number of volumes of inter- is 482.5 times higher (See Table 1). To ensure a balanced
ests (VOI) are extracted as candidate nodules using dataset, we increased the number of nodules by randomly
three existing Computer Aided Diagnosis (CAD) systems applying one or more of following augmentation steps: 1).
[24][14][30], aiming at solid nodules, subsolid nodules rotation from 0o to 360o along one or two axes (randomly
and large solid nodules respectively. By merging the three chosen) of the 64x64x64 pixel 3D volume. 2). flip the
sets of detected candidate nodules and combining candi- volume along one random axis (x, y or z). 3). zoom in
dates that are closer than 5 mm with averaged location and along a random axis or axes to maximum 125%. 4). shift
probability, a list of candidate nodules are obtains and the the volume by maximum 25% along a random axis, with
locations are stored in LIDC-IDRI dataset. As a result of mirror padding. The volume size were kept same during
candidate nodule detection, 1120 out of 1186 annotated augmentation.
nodules are detected. All the detected candidate nodules
are used for false positive reduction step.
4.3 Comparison between 2D, 2.5D, 3D and
2.75D strategies
4 Experiment A dataset of candidate nodule volumes of size 64x64x64
are obtained after preprocessing as input for training and
In order to compare the performance of the proposed strat- evaluation in the false positive reduction task. Depending
egy with existing strategies, four strategies(2.5D, 2D, 3D on the strategy, either the entire 3D volume or a portion of
and 2.75D) are evaluated on the pulmonary nodule false it is fed into CNNs for nodule classification. In this experi-
positive reduction problem using the LIDC-IDRI dataset. ment, four strategies as described in section sections 4.3.1
to 4.3.4 were compared. With the goal of fairly compar-
ing all the four strategies, we kept the CNN structure and
4.1 Preprocessing hyper-parameters identical, only toggling the 2D functions
to 3D functions (e.g. convolution).
Before feeding images of candidate nodule into CNNs,
some preprocessing steps are necessary. In this study, we
followed the preprocessing procedure described by Setio 4.3.1 2.5D Method
et al. [31]. A 50x50x50 mm volume of interest (VOI) was
extracted from each of the candidate nodule location. The Setio [31] proposed a multiple-view CNN based method
size of VOI was chosen to ensure fully visibility of all for the false positive reduction task in the Luna challenge
nodules ((a) 2.5D: multi-view 2D CNN architecture
(b) 2D: single view 2D CNN architecture
(c) 3D: volume based 3D CNN architecture
(d) 2.75D: spiral view based CNN architecture
Figure 2: Architectures of 2D, 2.5D, 3D and 2.75D strategy
Data Preparation From each VOI of size 64x64x64, are fed into the 2D CNNs in parallel streams, the outputs
nine 2D slice is extracted. Each of the 2D slice is fed into of which are then fused for a final binary decision. In this
a 2D CNN architecture, and the outputs are then fused into configuration, the parameters of the convolutional layers
the final classification result. for different streams are shared.
The first convolutional layer consists of 24 kernels of
2D CNN Configuration In this experiment, we re- size 5x5x1. The second convolutional layer consists of
implemented the multi-view CNN proposed by Setio et 32 kernels of size 3x3x24. The third convolutional layer
al. [31], which consists of 3 consecutive convolutional lay- consists of 48 kernels of size 3x3x32. Each kernel outputs
ers and max-pooling layers (see Fig. 2a). The input of the a 2D feature map (e.g. 24 of 60x60 images after the first
network is a 64x64x9 patch, which consists of nine 2D convolutional layer, which is denoted as 24@60x60 in
views of the 3D volume as shown in Fig. 2a. For the ease Fig. 2a). Max-pooling is used in the pooling layer, which
of comparison, we adopted their optimized hyper param- down-samples the patch size by half (e.g. from 24@60x60
eters as well (i.e., number of layers, kernel size, learning to 24@30x30 after the first max-pooling layer) by taking
rate, number of views, fusion method). All nine 2D views maximum values in non-overlapping windows of size 2x2
6Data subset 0 1 2 3 4 5 6 7 8 9 total
nodule 138 170 181 158 170 127 154 120 195 142 1555
augmented 78859 70672 74096 75634 76243 75437 76363 74823 74098 72606 748831
non-nodule 78997 70842 74277 75792 76413 75564 76517 74943 74293 72748 750386
Table 1: Statistics on the number of nodules and non-nodules in each of the 10 folds
(stride of 2). The last layer is a fully connected layer were replaced with Conv3D and Maxpooling3D respec-
with 16 output units. The Rectified linear units (ReLU) tively and filters were changed from 2D to 3D correspond-
activation function is applied in each convolutional layer ingly.
and fully connected layer, where the activation for a given As illustrated in figure 2c, the 3D CNN consist of same
input is obtained as a = max(0, x). number of kernels as the 2D CNN for each layer. The
filter sizes of the three layers are 5x5x5x1, 3x3x3x24 and
Neural Network Fusion Multiple 2D CNNs need to be 3x3x3x32 respectively. The max-pooling layer has a non-
fused to generate the final classification result. Setio et overlapping window of size 2x2x2 (stride of 2), which
al. explored three fusion approaches: Committee-Fusion, halves the size of patches.
Late-Fusion, Mixed-Fusion. In this experiment, late fusion
was implemented for comparison with other strategies. 4.3.4 2.75D Strategy
The late-fusion method [29, 16] concatenates the each
of the 16 output units from all 2D CNNs and fully con- We differentiate our 2.75D strategy from traditional 2.5D
nects the concatenated outputs directly to the classification and 3D strategies as follows. First we use a single 2D
layer (see Fig. 2a). By combining the information from image to represent of 3D VOI. Second, comparing to 2.5D
multiple views, this strategy has the potential to learn the approach, a 2.75D patch contains more 3D texture infor-
3D characteristics. mation.
As shown in Fig. 2d, a 2D image of size 32x43 pixel
was extracted from each 3D VOI of size 64x64x64 pixel
4.3.2 2D Strategy by applying the spiral scanning technique as described
The 2D strategy refers to the single view version of the in section 2.1. Such 2D patches were fed into the 2D
2.5D strategy as explained section 4.3.1. As shown in Fig. CNN model, which shares the same layer architecture as
2b, in this experiment, a single 2D slice of size 64x64 pixel described in section 4.3.1.
was extracted on the X-Y plane at the center of Z axis from As shown in Fig. 2d, after the first convolutional layer,
each VOI. A single 2D CNN stream was applied, which is 24 of 28x39 images are produced. The second convolu-
the same as described in section 4.3.1, followed by another tional layer outputs 32 of 12x17 images. The third convo-
fully connected layer directly to the binary classification lutional layer results in 48 of 4x7 images.
layer.
4.4 Training
4.3.3 3D Strategy
We performed evaluation in 10-fold cross-validation across
Besides the 2D and 2.5D strategies, it is a widely adopted the selected 888 LIDC-IDRI cases, which was split into
strategy to directly use the full 3D volume as input to 10 subsets with similar number of candidates in the Luna
CNNs for nodule classification (e.g. 3D-CNN [2]). Challenge[32]. For each fold, we used 7 subsets for train-
In this experiment, the input was a 64x64x64 pixel patch. ing, 2 subset for validation, and 1 subset for testing. The
The used CNN architecture for comparison (See Fig.2c) data size of each fold is shown in table 1.
was the same layer structure of the 2D CNN described One of the challenges of using CNNs is to efficiently
in section 4.3.2, except that Conv2D and MaxPooling2D optimize the model weights given the training dataset. To
7limit the differences between between all the CNNs in
this experiment, the same optimizer (RMSProp [37]), loss
function measured by cross-entropy error, batch size of
12 and dropout [36] with probability of 0.5 were shared
among all strategies. Early stopping with maximum of 50
epochs was also applied to all CNN architectures when the
validation loss does not decrease for 10 consecutive epochs.
We adopted normalized initialization for the model weights
as proposed by Glorot and Bengio [11]. The biases were
set initially to zero.
4.5 Evaluation
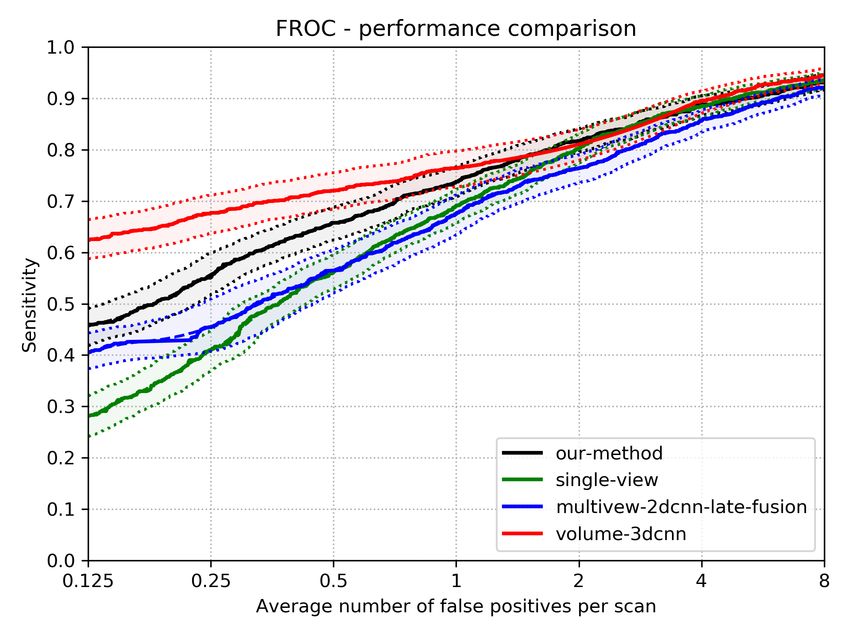
The performances of the four strategies were compared Figure 3: FROC curve of four different strategies.
based on two metrics: Area Under the ROC Curve (AUC)
and Competition Performance Metric (CPM) [26]. AUC is Strategy Patch Size CPM AUC
a commonly used evaluation metric for machine learning
Single View 2D CNN 64x64 0.62 98.02%
tasks, which represents the classification performance by
Multiple View 2D CNN 64x64x9 0.70 98.29%
the area under the Receiver Operating Characteristic curve
Volume based 3D CNN 64x64x64 0.79 99.28%
(ROC). However, in this specific false positive reduction
Our strategy 32x43 0.72 98.05%
task where the AUC is close to 100%, CPM turns out to be
more differentiating. It is defined as the average sensitivity
Table 2: Result statistics of four different strategies
at seven operating points of the Free-response ROC curve
(FROC): 1/8, 1/4, 1/2, 1, 2, 4, and 8 FPs/scan.
6 Conclusion and Discussion
5 Experimental Results To our best knowledge, we are the first to propose 2.75D
convolutional neural networks for analytical tasks in med-
On the LIDC dataset, the nodule false positive reduction ical imaging. The proposed strategy is a general idea to
task was performed using the CNN models described in transform a 3D medical image analysis problem into a 2D
section 4.3. The strategies were evaluated using 10-fold task, which is not limited to a specific CNN architecture.
cross validation based on AUC and CPM. The performance In terms of performance, our approach substantially out-
comparison is shown in Fig. 3 and Table 2. performs traditional 2D approach and 2.5D approach in
The AUC values in table 2 shows that the 3D strategy lung nodule classification. In terms of inferencing time,
slightly outperforms the other strategies, while the 2D, our approach is equivalent to 2D approach and substan-
2.5D and our 2.75D strategy achieves comparable sensitiv- tively better than 2.D approach by 9 times and 3D approach
ity. In terms of CPM ( see Table 2) and FROC ( see Fig. 3), by 10 times. From green AI perspective, our approach is
the 2.75D strategy clearly shows the capability of capture specially useful for 3D medical image analysis.
spatial 3D information of the volume with much less pixel Regarding performance, the very possible reason that
sizes. Our strategy outperforms both 2D and 2.5D by 10% 2.75D works is that the stereo information of the 3D vol-
and 2% respectively. The 3D method achieves highest ume is captured by the 2.75D representation, leading to
performance (0.79), which is 7% higher than the proposed comparable classification performance to 3D CNN based
2.75D strategy. Since 2.75D utilizes 2D convolution, the strategies, superior to 2D and 2.5D strategies.
performance could be further improved with the benefit of Another advantage of applying 2.75D approach is that
transfer learning. transfer-learning is directly applicable for 2.75D, 2.5D and
82D data representation using ImageNet dataset while for International Conference on Natural Computation (ICNC
3D approach, a dataset comparable to ImageNet is not 2007), volume 2, pages 275–279. IEEE, 2007.
publicly available for pre-training. [11] Xavier Glorot and Yoshua Bengio. Understanding the dif-
ficulty of training deep feedforward neural networks. In
Proceedings of the thirteenth international conference on
References artificial intelligence and statistics, pages 249–256, 2010.
[12] Shiying Hu, Eric A Hoffman, and Joseph M Reinhardt.
[1] HU Ahmed, Y Hu, D Barratt, D Hawkes, and M Em- Automatic lung segmentation for accurate quantitation of
berton. Medical image computing and computer-assisted volumetric x-ray ct images. IEEE transactions on medical
intervention–miccai 2009. Springer, 2009. imaging, 20(6):490–498, 2001.
[2] Wafaa Alakwaa, Mohammad Nassef, and Amr Badr. Lung [13] Xiaojie Huang, Junjie Shan, and Vivek Vaidya. Lung nod-
cancer detection and classification with 3d convolutional ule detection in ct using 3d convolutional neural networks.
neural network (3d-cnn). Lung Cancer, 8(8):409, 2017. In 2017 IEEE 14th International Symposium on Biomedical
[3] Samuel G Armato, Maryellen L Giger, Catherine J Moran, Imaging (ISBI 2017), pages 379–383. IEEE, 2017.
James T Blackburn, Kunio Doi, and Heber MacMahon. [14] Colin Jacobs, Eva M van Rikxoort, Thorsten Twellmann,
Computerized detection of pulmonary nodules on ct scans. Ernst Th Scholten, Pim A de Jong, Jan-Martin Kuhnigk,
Radiographics, 19(5):1303–1311, 1999. Matthijs Oudkerk, Harry J de Koning, Mathias Prokop,
[4] Samuel G Armato III, Geoffrey McLennan, Luc Bidaut, Cornelia Schaefer-Prokop, et al. Automatic detection of
Michael F McNitt-Gray, Charles R Meyer, Anthony P subsolid pulmonary nodules in thoracic computed tomog-
Reeves, Binsheng Zhao, Denise R Aberle, Claudia I Hen- raphy images. Medical image analysis, 18(2):374–384,
schke, Eric A Hoffman, et al. The lung image database 2014.
consortium (lidc) and image database resource initiative [15] Guixia Kang, Kui Liu, Beibei Hou, and Ningbo Zhang. 3d
(idri): a completed reference database of lung nodules on multi-view convolutional neural networks for lung nodule
ct scans. Medical physics, 38(2):915–931, 2011. classification. PloS one, 12(11):e0188290, 2017.
[5] Raunak Dey, Zhongjie Lu, and Yi Hong. Diagnostic clas- [16] Andrej Karpathy, George Toderici, Sanketh Shetty, Thomas
sification of lung nodules using 3d neural networks. In Leung, Rahul Sukthankar, and Li Fei-Fei. Large-scale
2018 IEEE 15th International Symposium on Biomedical video classification with convolutional neural networks. In
Imaging (ISBI 2018), pages 774–778. IEEE, 2018. Proceedings of the IEEE conference on Computer Vision
[6] Anton Dobrenkii, Ramil Kuleev, Adil Khan, Adin Ramirez and Pattern Recognition, pages 1725–1732, 2014.
Rivera, and Asad Masood Khattak. Large residual multiple [17] Yoshiki Kawata, Noboru Niki, Hironobu Ohmatsu, Ryutaro
view 3d cnn for false positive reduction in pulmonary nod- Kakinuma, Kenji Eguchi, Masahiro Kaneko, and Noriyuki
ule detection. In 2017 IEEE Conference on Computational Moriyama. Classification of pulmonary nodules in thin-
Intelligence in Bioinformatics and Computational Biology section ct images based on shape characterization. In Pro-
(CIBCB), pages 1–6. IEEE, 2017. ceedings of International Conference on Image Processing,
[7] Qi Dou, Hao Chen, Lequan Yu, Jing Qin, and Pheng-Ann volume 3, pages 528–530. IEEE, 1997.
Heng. Multilevel contextual 3-d cnns for false positive re- [18] William J Kostis, Anthony P Reeves, David F Yankelevitz,
duction in pulmonary nodule detection. IEEE Transactions Claudia I Henschke, et al. Three-dimensional segmentation
on Biomedical Engineering, 64(7):1558–1567, 2016. and growth-rate estimation of small pulmonary nodules in
[8] Andinet A Enquobahrie, Anthony P Reeves, David F helical ct images. IEEE Trans. Med. Imaging, 22(10):1259–
Yankelevitz, and Claudia I Henschke. Automated detection 1274, 2003.
of pulmonary nodules from whole lung helical ct scans: [19] Jan-Martin Kuhnigk, Volker Dicken, Lars Bornemann, Dag
performance comparison for isolated and attached nodules. Wormanns, Stefan Krass, and Heinz-Otto Peitgen. Fast
In Medical Imaging 2004: Image Processing, volume 5370, automated segmentation and reproducible volumetry of
pages 791–800. International Society for Optics and Pho- pulmonary metastases in ct-scans for therapy monitoring. In
tonics, 2004. International Conference on Medical Image Computing and
[9] Ling Fu, Jingchen Ma, Yizhi Chen, Rasmus Larsson, and Computer-Assisted Intervention, pages 933–941. Springer,
Jun Zhao. Automatic detection of lung nodules using 3d 2004.
deep convolutional neural networks. Journal of Shanghai [20] Jyh-Shyan Lin, S-CB Lo, Akira Hasegawa, Matthew T
Jiaotong University (Science), pages 1–7. Freedman, and Seong Ki Mun. Reduction of false pos-
[10] Qixin Gao, ShengJun Wang, Dazhe Zhao, and Jiren Liu. itives in lung nodule detection using a two-level neural
Accurate lung segmentation for x-ray ct images. In Third classification. IEEE Transactions on Medical Imaging,
915(2):206–217, 1996. multi-view convolutional networks. IEEE transactions on
[21] Kui Liu and Guixia Kang. Multiview convolutional neu- medical imaging, 35(5):1160–1169, 2016.
ral networks for lung nodule classification. International [32] Arnaud Arindra Adiyoso Setio, Alberto Traverso, Thomas
Journal of Imaging Systems and Technology, 27(1):12–22, De Bel, Moira SN Berens, Cas van den Bogaard, Piergior-
2017. gio Cerello, Hao Chen, Qi Dou, Maria Evelina Fantacci,
[22] Xinglong Liu, Fei Hou, Hong Qin, and Aimin Hao. Multi- Bram Geurts, et al. Validation, comparison, and combina-
view multi-scale cnns for lung nodule type classification tion of algorithms for automatic detection of pulmonary
from ct images. Pattern Recognition, 77:262–275, 2018. nodules in computed tomography images: the luna16 chal-
[23] S-CB Lo, S-LA Lou, Jyh-Shyan Lin, Matthew T Freedman, lenge. Medical image analysis, 42:1–13, 2017.
Minze V Chien, and Seong Ki Mun. Artificial convolu- [33] Wei Shen, Mu Zhou, Feng Yang, Caiyun Yang, and Jie Tian.
tion neural network techniques and applications for lung Multi-scale convolutional neural networks for lung nodule
nodule detection. IEEE Transactions on Medical Imaging, classification. In International Conference on Information
14(4):711–718, 1995. Processing in Medical Imaging, pages 588–599. Springer,
[24] Keelin Murphy, Bram van Ginneken, Arnold MR Schilham, 2015.
BJ De Hoop, HA Gietema, and Mathias Prokop. A large- [34] Junji Shiraishi, Feng Li, and Kunio Doi. Computer-aided
scale evaluation of automatic pulmonary nodule detection in diagnosis for improved detection of lung nodules by use of
chest ct using local image features and k-nearest-neighbour posterior-anterior and lateral chest radiographs. Academic
classification. Medical image analysis, 13(5):757–770, radiology, 14(1):28–37, 2007.
2009. [35] American Cancer Society. Cancer facts & figures 2019.
[25] Aiden Nibali, Zhen He, and Dennis Wollersheim. Pul- American Cancer Society, 2019.
monary nodule classification with deep residual networks. [36] Nitish Srivastava, Geoffrey Hinton, Alex Krizhevsky, Ilya
International journal of computer assisted radiology and Sutskever, and Ruslan Salakhutdinov. Dropout: a simple
surgery, 12(10):1799–1808, 2017. way to prevent neural networks from overfitting. The jour-
[26] Meindert Niemeijer, Marco Loog, Michael David nal of machine learning research, 15(1):1929–1958, 2014.
Abramoff, Max A Viergever, Mathias Prokop, and Bram [37] Tijmen Tieleman and Geoffrey Hinton. Lecture 6.5-
van Ginneken. On combining computer-aided detection sys- rmsprop: Divide the gradient by a running average of its
tems. IEEE Transactions on Medical Imaging, 30(2):215– recent magnitude. COURSERA: Neural networks for ma-
223, 2010. chine learning, 4(2):26–31, 2012.
[27] AM Noone, N Howlader, M Krapcho, D Miller, A Brest, [38] Jiahui Wang, Roger Engelmann, and Qiang Li. Segmenta-
M Yu, J Ruhl, Z Tatalovich, A Mariotto, DR Lewis, et al. tion of pulmonary nodules in three-dimensional ct images
Seer cancer statistics review, 1975-2015, national cancer by use of a spiral-scanning technique. Medical Physics,
institute. bethesda, md, 2018. 34(12):4678–4689, 2007.
[28] Huseyin Polat and Homay Danaei Mehr. Classification of [39] Hongtao Xie, Dongbao Yang, Nannan Sun, Zhineng Chen,
pulmonary ct images by using hybrid 3d-deep convolutional and Yongdong Zhang. Automated pulmonary nodule detec-
neural network architecture. Applied Sciences, 9(5):940, tion in ct images using deep convolutional neural networks.
2019. Pattern Recognition, 85:109–119, 2019.
[29] Adhish Prasoon, Kersten Petersen, Christian Igel, François [40] David F Yankelevitz, Rajiv Gupta, Binsheng Zhao, and
Lauze, Erik Dam, and Mads Nielsen. Deep feature learning Claudia I Henschke. Small pulmonary nodules: evalua-
for knee cartilage segmentation using a triplanar convo- tion with repeat ct—preliminary experience. Radiology,
lutional neural network. In International conference on 212(2):561–566, 1999.
medical image computing and computer-assisted interven- [41] David F Yankelevitz, Anthony P Reeves, William J Kostis,
tion, pages 246–253. Springer, 2013. Binsheng Zhao, and Claudia I Henschke. Small pulmonary
[30] Arnaud AA Setio, Colin Jacobs, Jaap Gelderblom, and nodules: volumetrically determined growth rates based on
Bram van Ginneken. Automatic detection of large pul- ct evaluation. radiology, 217(1):251–256, 2000.
monary solid nodules in thoracic ct images. Medical
physics, 42(10):5642–5653, 2015.
[31] Arnaud Arindra Adiyoso Setio, Francesco Ciompi, Geert
Litjens, Paul Gerke, Colin Jacobs, Sarah J Van Riel,
Mathilde Marie Winkler Wille, Matiullah Naqibullah,
Clara I Sánchez, and Bram van Ginneken. Pulmonary nod-
ule detection in ct images: false positive reduction using
10You can also read