HCP 3.0 NAREIT Presentation - NAREIT November 15-16, 2016
←
→
Page content transcription
If your browser does not render page correctly, please read the page content below

HCP 3.0 NAREIT Presentation

     Senior Housing   Life Science      Medical Office

                         NAREIT November 15-16, 2016
HCP Delivered on Near-Term Goals

  Execute the Spin-off of the HCR ManorCare Portfolio                                                                 Completed on Oct 31, 2016

                                                                                                                      Will be reduced from 35%
  Reduce and Improve Brookdale Concentration                                                                          immediately post-spin to 27% via
                                                                                                                      announced transactions(1)

                                                                                                                      Executing and refining financing
                                                                                                                      plan announced in May 2016,                       1
  Improve Balance Sheet Metrics                                                                                       resulting in better credit metrics
                                                                                                                      than initially anticipated

                                                                                                                       Revamped and enhanced
  Become a Leader in Transparency and Clarity
                                                                                                                       Supplemental disclosures in 3Q16

                                                                                                                       Deep team with diverse and
  Establish the Next Generation of Leadership for HCP 3.0
                                                                                                                       complimentary experience

(1) Concentration is based on cash NOI plus interest income. Reflects the announced RIDEA II transaction, sale of 64 Brookdale triple-net assets, sale or transfer of
    25 Brookdale triple-net assets and transfer of 4 Brookdale communities to another operator.

                                                           HCP 3.0
What Differentiates HCP 3.0
High quality portfolio reinforcing stability and organic growth, with 94% private-pay revenue sources
and improved tenant concentration
Strong and improving investment grade balance sheet with ample
liquidity and no significant debt maturities through end of 2018
Diversified senior housing portfolio with strong triple-net lease
coverage
Premier Life Science platform featuring The Cove development
Stable on-campus MOB portfolio well-known for its consistent
performance
2
Global leader in sustainability
Smaller investment base to grow off of
Senior Housing - The Solana Preserve
Houston, TX
We Will Strive to be Recognized in Our Industry for Our:
Investment plan emphasizing prudent capital allocation and
accretive growth objectives
Improvement in credit metrics over time to regain Baa1/BBB+ ratings
Best-in-class disclosures and transparency
Evergreen Medical Office
Lone Tree, CO
HCP 3.0
HCP is a Platform for Growth
Growth will come from all three of our major business lines: senior housing, life science, and MOB
Grow existing relationships by generating “tuck-in” acquisitions and developments
Capitalize on development and redevelopment opportunities across all segments
Enhance business development to target operators and health systems
Manage the balance sheet and be prepared for opportunistic acquisitions 3
Advance research and analytics capabilities to capitalize on segment-specific cycles
Recycle non-core assets into quality properties with strong local-market fundamentals
Well-positioned to grow off a smaller base and revitalized portfolio
HCP 3.0
Experienced Senior Leadership Team
                                                  Michael McKee
                                                Executive Chairman,
                                               Interim President and
                                              Chief Executive Officer

                                                     Tom Herzog
                                                 Chief Executive Officer
                                                   (Effective 1/1/17)

                                                                                                  4

                                                 Justin Hutchens             Troy McHenry
            OPEN
                                                     President             General Counsel and
    Chief Financial Officer
                                                  (Effective 1/1/17)       Corporate Secretary

        Jon Bergschneider                            Kai Hsiao                Tom Klaritch
       EVP – Life Science Estates                EVP – Senior Housing      EVP – Medical Office

                                    HCP 3.0
Best-in-Class Portfolio
Large, diversified healthcare REIT with high-quality cash flows from needs-based private pay sources
Complementary triple-net leases and operating business platforms across multiple healthcare sectors
43% Senior
Housing
Other
14%(2)
Senior
87 MSAs
Housing 800 94% 43 States
NNN
Properties(3) Private Pay(4)(5)
Medical
Office
$1.3B 24% Geographically
Diversified
5
22% Cash NOI
plus Interest Senior 6% 39%
Housing
Income(1) Operating 77% (vs. 4% national avg)
Strong Population Top 3 Tenants
Portfolio Concentrated
in Top 50 MSAs(6) Growth over Next Diversified
“SHOP”
Life Science 19%
5 Years(7) Tenants(5)
21%
Post-Spin, HCP has a Younger, Higher Quality Portfolio of Private Pay Assets
in Top 50 MSAs with Above Average Population Growth
(1) Represents HCP’s preliminary 2017 Outlook provided on 11/1/16 for cash NOI plus interest income from debt investments.
(2) Other segment primarily consists of hospitals, U.K. real estate, and all debt investments.
(3) After giving effect to the QCP spin and announced BKD transactions.
(4) Self-pay and private insurance (including managed care); medical office properties are considered 100% private-pay.
(5) Percentage based on cash NOI plus interest income.
(6) Percentage based on cash NOI.
(7) Source: Environmental Systems Research Institute (ESRI).
HCP 3.0
Premier Portfolio in Attractive Healthcare Markets
Senior Housing Improved lease coverage with announced Brookdale
transactions(2)
43%(1)
Added 6 new operators, diversifying our relationships
74% located in Top 50 MSAs(3)
Medical Office 83% located on-campus; 7% adjacent; 87% in Top 50
MSAs(3)
22%(1)
95% affiliated with 200+ hospitals and healthcare
6
systems(3)
Steady occupancy consistently above 90%
Life Science Amgen 93% located in 2 of the top 3 core markets(3)
Largest owner and developer on the West Coast
21%(1)
The Cove development represents a 1.0M sq. ft.,
LEED Silver waterfront campus in S. San Francisco
87% of revenues from public or well-established
private companies
Represents recently sourced new relationships
(1) Percentages by segment are based on 2017 Outlook for cash NOI plus interest income from debt investments. Excludes the Other segment, which primarily consists
of hospitals, U.K. real estate, and all debt investments.
(2) After giving effect to the announced BKD transactions, EBITDAR-to-Rent coverage for the retained 78 triple-net properties increases to 1.21x for the trailing 12 months
ended 9/30/16.
(3) Percentage based on cash NOI for senior housing and square footage for medical office and life science.
HCP 3.0
Senior Housing

                                             7

                 HCP | The Solana Germantown
                         Operated by Brookdale
                               Germantown, TN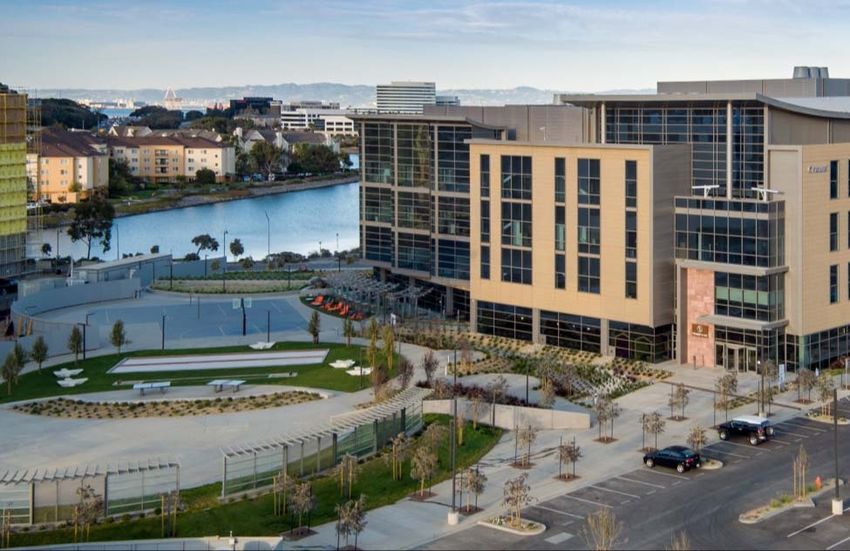
Diversified Senior Housing Portfolio

                                                                                                     24%
    46% SHOP                                                                                          a                              54% Triple-net
    Investments                                                                                                                      Leased Portfolio

      a                                         40%
                                                 a                 $573M                                                                  a
      b
                                                                           Cash                                                           b                   8

                                                                           NOI(1)                           16%                           c
                                                                                                             b

                                                                   6%
                                                                                     14%
                                                                   b                  c

(1) Based on HCP’s preliminary 2017 Outlook provided on 11/1/16. Note that following the completion of the announced Brookdale transactions, Brookdale will
    operate 204 communities for HCP generating approximately $350 million of expected annualized cash NOI, of which one third will be under triple-net
    leases and two thirds in RIDEA joint ventures.

                                                                  SENIOR HOUSING
Triple-Net Leases Anchor Recurring Internal Growth
$312M cash NOI(1) from 200+ triple-net leased senior housing properties managed by 20+ operators
Brookdale property EBITDAR-to-rent coverage improves to 1.21x and HCP’s triple-net senior housing
portfolio coverage up to 1.13x upon completing the Brookdale asset sales(2)
2% to 3% average annual escalators
Independent
5-mile
Living median income and net worth above the national average
Assisted
Limited expirations – weighted
Living average remaining term of 10 years
9
Memory
Care
Senior Housing – Oakmont of Roseville Senior Housing – The Fairfax, operated by Sunrise
Roseville, CA Ft. Belvoir, VA
(1) Based on HCP’s preliminary 2017 Outlook provided on 11/1/16 for cash NOI.
(2) Trailing twelve months ending 9/30/16, after giving effect to the announced Brookdale transactions.
SENIOR HOUSINGSHOP Portfolio is Well-Positioned
$262M cash NOI from over 100 properties(1)
High mix of independent living, which has been less impacted by new supply in our markets
15+ years Only 3.2% 6 Management team
with national operating
Avg. affordability for of Cash NOI exposed New relationships
experience
portfolio (2) to new supply(3) added past year
SHOP Portfolio Mix by Cash NOI Annual Inventory Growth(4)
5% 10
Assisted Living
4%
Independent
Living 3%
64%
2%
Assisted Independent Living
Living
1%
36%
0%
2010 2011 2012 2013 2014 2015 2016 2017E
63% of supply coming online over next 24 months will be AL - HCP’s portfolio is 64% IL
(1) Based on HCP’s preliminary 2017 Outlook provided on 11/1/16 for cash NOI.
(2) Affordability represents the number of years an individual can support the cost of residing in a senior housing facility. Affordability is calculated using the median net worth
for individuals ages 75 and older, divided by the annualized revenue per occupied room (REVPOR) less the median income for individuals ages 75 and older. Markets with
median income in excess of REVPOR reflect an Affordability metric of greater than (>) 15 years.
(3) Represents the percentage of company Cash NOI and Interest income exposed to new senior housing construction and expansion. As reported on 9/30/16.
(4) Supply data from NIC.
SENIOR HOUSINGSenior Housing Near-Term Growth Objectives
Invest in high-quality assets with attractive risk-adjusted return profiles
Expand local-market operator relationships
Provide our operators with exclusive analytics and business support tools
Capitalize on expansion, conversion, and redevelopment opportunities
Selectively pursue one-off and strategic acquisitions
Tactics to Achieve Goals
Increase HCP ■ Continue to foster relationships with new operators
Market 11
■ Deliver quickly and reliably for customers
Presence
■ Refine and optimize investment process with a customer-centered process
Help Our ■ “Center for Operational Excellence” will leverage HCP’s scale to provide our operators
Operators Win analytics and business services support and best practices
- Smaller operators gain scale to grow their business; provides HCP with repeat customers
- More robust market data helps HCP allocate capital between MSAs and operators
Portfolio Mining ■ Systematically evaluate the portfolio for accretive organic growth opportunities
■ Work with existing and new relationships to proactively reposition assets for growth
SENIOR HOUSINGReconstitute and Upgrade Our Brookdale NNN Portfolio
Transaction improves lease coverage, occupancy, and margins while reducing exposure to new
supply
Current HCP 3.0
BKD NNN BKD NNN
Portfolio(1) Portfolio
# of Properties 167 78
Located in Top 99 NIC Markets 74% 5% 79%
Contractual Rent(2) $222M $121M
% of Overall HCP(3) 16% 6% 10%
(4) 12
Property EBITDAR-to-Rent Coverage 1.02x 19 bps 1.21x
Occupancy 86.5% 260 bps 89.1%
(5)
EBITDAR Margin 30.2% 470 bps 34.9%
Qualified Care Giver Population Growth(6) 11.6% 11.9%
Senior 75+ Population Growth 17.9% 18.0%
Median Net Worth 75+ $210K $211K
HCP NOI Exposed to New Supply 4.0% 1.9%
(1) Excludes eight properties with upcoming lease expirations in the next six months.
(2) Reflects contractual rent adjusted for the rent re-allocation as part of the 25 NNN sale/transition as of September 2016, annualized.
(3) Concentration is based on cash NOI plus interest income. Taking into account RIDEA communities managed by Brookdale, our total Brookdale exposure is reduced from 35%
immediately post Spin to 27% (also reflecting the RIDEA II transaction).
(4) EBITDAR-to-Rent Coverage for the retained 78 communities is calculated using trailing 12 months EBITDAR as of September 30, 2016 and re-allocated rents. All other
coverages use rents for the trailing 12 months ended September 30, 2016 before giving effect to the rent re-allocation.
(5) Based on trailing 12 months ended September 30, 2016.
(6) Qualified Care Givers: Households – Age 45-64 and Income $100,000+.
SENIOR HOUSINGLife Science
13
HCP | The Cove at Oyster Point
South San Francisco, CAIrreplaceable Life Science Portfolio
$271M of cash NOI from 118 properties encompassing over 7M sq. ft. in three states(1)
Largest life science owner on the West Coast with concentrations in Bay Area and San Diego
SAN FRANCISCO – 4.6M sq. ft.
97% 87% 20+ Years
Average occupancy Revenues from As a premier
over past two years public or well- developer with 2.1M
established private sq. ft. of remaining
companies entitlements
Key Submarkets
• So. San Francisco • Mountain View
14
• Redwood City • Hayward
Life Science Development Overview
SAN DIEGO - 2.1M sq. ft.
Current pipeline(2) $464M
Pre-leased 57%
Stabilized yield 7.5% - 8%
Key Submarkets
Recently commenced $211M Cove Phase III
• Torrey Pines • Sorrento Mesa
• University Towne • Poway
Center
(1) Based on HCP’s preliminary 2017 Outlook provided on 11/1/16 for cash NOI.
(2) Current pipeline as of 3Q16. Cost, leasing, and yields do not include Cove Phase III.
LIFE SCIENCEStrong Life Science Internal Growth
Portfolio is concentrated in research hubs in core cluster markets resulting in strong demand
from high-quality tenants
Occupancy is up nearly 500 basis points over the last four years reaching stabilized levels
High Leasing Volume Strong Occupancy
15
1,500 100%
96%
Leased sq. ft. (000s)
1,000
92%
500
88%
-
84%
2012 2013 2014 2015 2016
2012 2013 2014 2015 3Q16
Renewal New YTD
Strong fundamentals in our top-tier clusters
LIFE SCIENCEThe Cove at Oyster Point Development
Premier Class A Life Science development
project totaling one million sq. ft. at the
gateway to South San Francisco, where overall
Life Science vacancy is below 3%
Can we get an in process pic?
$610M delivered or in-process; 164,000 sq. ft.
of remaining entitlements
Phase I is 73% leased; 247,000 sq. ft. in two
buildings (opened 3Q 2016)
16
Phase II is 50% pre-leased; 230,000 sq. ft. in
two buildings (commenced in February 2016;
anticipated delivery 4Q 2017)
Commencing Phase III; 336,000 sq. ft. in two
buildings (anticipated delivery 4Q 2018)
LEED Silver campus with rich amenity profile,
including food service, fitness, meeting space,
hotel & retail
LIFE SCIENCELife Science Near-Term Growth Objectives
Develop Class-A “trophy” campuses like The Cove
Acquire high-quality assets in top-5 life science markets; build on “estate concept” strategy
Recycle non-core assets
Focus on occupancy, retention, and tenant credit quality
Continue advancing LEED and sustainability initiatives
Tactics to Achieve Goals
Development ■ Build –out, lease, and stabilize The Cove campus 17
■ Continue pre-development for entitled Bay Area and San Diego land parcels
■ Develop speculatively when market conditions are appropriate
Acquisitions ■ Leverage cost of capital post-spin to compete more aggressively for core acquisitions
■ Opportunistically acquire value-add assets
Tenant Profile ■ Maintain focus on core life science clusters where Bio Pharma/Big Biotech want to be
■ Utilize HCP’s “estate concept” strategy to grow with tenants
■ Use capital to improve curb appeal to attract high-quality tenants
SENIOR HOUSING LIFE SCIENCEMedical Properties
Medical Office Buildings
18
HCP | 833 Chestnut MOB
Philadelphia, PAIndustry-Leading On-Campus Portfolio
$280M cash NOI from 226 properties encompassing 17M sq. ft.(1)
95% 83%
[82]% 87%
[82]%
affiliated with on-campus and located in top 50
200+ hospitals
On-Campus
an additional 7%
Multi-Tenant
MSAs(2)
and health oradjacent
Adjacent(2) Buildings
systems(2)
Skyridge MOB
Aspen, CO
19
MOB Development Overview
Current pipeline $135M
Pre-leased 63%
Stabilized yield 7.5%-8%
MOB Redevelopment Overview
Current pipeline $40M
Cash-on-cash returns 9%-12%
Medical City Dallas Campus (HCA)
Dallas, Texas
(1) Based on HCP’s preliminary 2017 Outlook provided on 11/1/16 for cash NOI.
(2) Percentage based on square feet. Adjacent defined as a medical office building located within 0.25 miles of a hospital campus.
MEDICAL OFFICEMedical Office Internal Growth: Strong, Steady, Stable
Strong Retention Steady Occupancy
100%
80%
90%
70%
60% 80%
50% 70%
2012 2013 2014 2015 YTD 2016 2012 2013 2014 2015 YTD 2016 20
High Leasing Volume Consistent Leader in Tenant Satisfaction(1)
3,000
Leased sq. ft. (000s)
2,500 4.24
4.19 4.20
2,000 4.14 4.16
1,500
4.15 4.13 4.13
1,000 4.09
500
3.95
-
2012 2013 2014 2015 YTD 2011 2012 2013 2014 2015
Renewal New 2016 HCP Kingsley Index
(1) Kingsley Associates’ tenant survey measuring tenant satisfaction with MOB landlords.
.
MEDICAL OFFICEMOB Near-Term Growth Objectives
Create new relationships with top health systems and hospitals
Focus investment and resources in top 50 MSAs with strong population and income growth
Execute on redevelopment pipeline and continue to add projects to shadow pipeline
Deliver steady operating results
Tactics to Achieve Goals
External ■ Foster existing relationships to grow on-campus portfolio via development
21
■ Target new relationships with leading health systems
■ Leverage key brokerage relationships and our scale
Organic ■ Pursue accretive redevelopment in our existing, well-positioned assets
■ Build on our leadership position in sustainability to improve operational efficiency
Opportunistic ■ Acquire assets from top health system and hospital relationships
■ Selectively pursue large strategic acquisitions
SENIOR HOUSING MEDICAL OFFICEHospitals and International
22
HCP | Physicians Park MOB
Nashville, TNHCP’s Hospital and International Portfolios
Hospital International
6.3x 70% 1.3x 91%
EBITDAR lease Cash NOI from EBITDAR lease Occupancy
coverage(1) acute-care hospitals coverage(1)
$570M investment dollars, 15 properties and $460M debt investments dollars and $390M
2,100 beds in 12 MSAs real estate investment dollars, 61 properties
and 3,200 beds
NNN leases with 1.5%-2.5% average annual rent
escalators NNN leases with 1.5%-2.5% average annual rent 23
escalators
Key relationships: HCA, Hoag, HealthSouth
Deep partnerships with top UK operators HC-
One and Maria Mallaband
Hoag Hospital HC- One - Greenfield Park
Irvine, CA United Kingdom
(1) EBITDAR lease coverage is for the trailing 12-months ended June 30, 2016.
HOSPITAL AND INTERNATIONALFinancial Outlook and Balance Sheet
24
HCP | The Solana Deer Park
Deer Park, IL2016 Guidance, Pro Forma Run Rate and 2017 Outlook
2016 2016 2017
Nov 1st Guidance Pro Forma Outlook
(mid‐point) Run Rate(1) (mid‐point)
NAREIT FFO per share $2.38 $1.58 $1.91
FFO as Adjusted per share $2.72 $1.92 $1.92
Cash NOI SPP 3.25% n/a 3.0%
NOI SPP 2.2% n/a 2.0%
25
Assumed timing of transactions:
Spin 10/31/16 1/1/16 10/31/16
RIDEA II transaction 11/30/16 1/1/16 11/30/16
Sale of 64 Brookdale triple‐net properties No Impact 1/1/16 2/1/17
(1) Represents the annualized, run-rate impact from the Spin, RIDEA II transaction and the sale of 64 Brookdale triple-net properties for $1.1B as if all transactions
occurred on January 1, 2016 and excluding the gains from participating debt recognized in 2016.
FINANCIAL OUTLOOK AND BALANCE SHEETSubstantial Liquidity; No Meaningful Near-term Debt Maturities
Negligible debt maturities through 2018(1)
$1.85 billion projected availability on $2.0 billion revolver
9/30/16 Projected
($ millions) $2,000 $2.2 Billion Debt Maturities $2,000 $0.3 Billion Debt Maturities(2)
$2,000 $2,000
$1,574
$1,500 $1,500
26
$1,000 $1,000
$637
$1,372
$500 $500
$241
$37
$150
$0 $0
Revolver
Column1 2016 2017 2018 Revolver
Column1 2016 2017 2018
Availability Availability
Revolver Balance Revolver Availability Senior Unsecured Notes Secured Debt Unsecured Term Loans
(incl pro rata JV debt) (natural hedge for UK investments)
(1) Excludes revolver and other debt maturities.
(2) As of 9/30/16, excluding revolver and other debt maturities. Projected maturity schedule reflects $3.15 billion of anticipated debt paydown using proceeds from QCP
financing, RIDEA II transaction and Brookdale asset sales during Q4’16 and through Q2’17 (see page 32 for detailed assumptions).
FINANCIAL OUTLOOK AND BALANCE SHEETProjected Debt Maturity Schedule(1)
($ in millions)
$2,000
$7.7B of total debt
4.1% weighted average interest rate
$1,600 6.7 years weighted average maturity
$1,371
$1,224
$1,200 $1,153
$918
$838 $806
$800 $752
27
$403
$400
$241
$37
$0
2016 2017 2018 2019 2020 2021 2022 2023 2024 2025 2026 Thereafter
Senior Unsecured Notes Secured Debt (incl/ pro rata JV) Unsecured Term Loans
(natural hedge for UK investments)
We Will Have Addressed Substantially All Debt Maturities Through the End of 2018
(1) As of 9/30/16, excluding revolver and other debt. Projected maturity schedule reflects $3.15 billion of anticipated debt paydown using proceeds from QCP
financing, RIDEA II transaction and Brookdale asset sales during Q4’16 and through Q2’17 (see page 32 for detailed assumptions).
FINANCIAL OUTLOOK AND BALANCE SHEETCommitted to a Strong Balance Sheet
Current credit ratings are Baa2 (stable) for Moody’s, BBB (stable) for S&P (reaffirmed in
October), and BBB (stable) for Fitch (stable-positive ratings action in October)
Ample liquidity with $2 billion revolver and large unencumbered asset base
Preliminary Post Spin
2017 General
Targets at
Targets(2) Targets
Announcement(1)
Net Debt / EBITDA ~6.5x Low to mid-6x 5.5x-6.0x
28
Financial Leverage 45% 43%-44% 3.5x
Coverage
Top 3 Tenant 30-35%
~40% 35%-40%
Concentration(3)
2017 Target Credit Metrics are Better than our Preliminary Post-Spin Targets…
with the Goal of Reducing Leverage Further and Regaining Baa1/BBB+ Ratings Over Time
(1) Post-spin targets discussed at the time of the Spin announcement in May 2016.
(2) Represents year end 2017 targets.
(3) Top three tenant concentration was 55% pre-spin. Concentration is based on cash NOI plus interest income.
FINANCIAL OUTLOOK AND BALANCE SHEETAppendix 29
Bridge to 2016 “Pro Forma Run Rate”
$ per share
                                                                                         FFO as
                                                                                        Adjusted
2016 Current Guidance(1)                                                                   $    2.72
plus: 2-month net impact from Spin transaction                                                  0.15
2016 Guidance – “WholeCo” Basis                                                                 2.87
Gains from participating debt                                                                  (0.04)
2016 WholeCo Run Rate                                                                      $    2.83

Reduced annual income contribution from
   NOI from assets transferred to QCP                                                           (1.03)         Combined, these transactions
                                                                                                               generate gross proceeds totaling         30
   NOI (rent) on Brookdale 64 NNN assets                                                       (0.20)
                                                                                                               $3.3B to HCP and reduce annual
   RIDEA II transaction                                                                        (0.06)          income by $600M
      Subtotal                                                                                  (1.29)

Use of proceeds
   Repay bonds, mortgage debt, revolver and other(2)                                            0.38

HCP Pro Forma Run Rate (Annual RemainCo)                                                    $ 1.92

(1) Based on the mid-point of the Company’s 2016 guidance on 11/1/16. Guidance reflects the Spin completion on 10/31/16 and RIDEA II
    transaction on 11/30/16, and assumes the Brookdale transactions are completed in 2017.
(2) Substantially all of the gross proceeds are used to repay debt at a blended interest rate of 5.2%. Remaining proceeds are used to fund
    transaction and prepayment costs and for reinvestment.

                                                                                                                                             APPENDIX
2016 Run Rate to 2017 Outlook:
Major Drivers Impacting FFO as Adjusted
$/share
$0.02 ($0.02)
$0.05 ($0.04)
($0.01)
$1.92 $1.92
31
2016 Run Rate 3.0% Cash SPP, Committed Drag from Add'l Tenant Purchase Other Items, net 2017 Outlook
FFO as Adj.(1) less Straight Line Re/Development Re/Dev Projects Options & Other FFO as Adj.
Rent & Other(2) Projects Capital Recycling (3)
Organic Growth from Same-Store and Development Earn-In
are Offset by Tenant Purchase Options and other Capital Recycling Activities
(1) 2016 Run Rate represents the annualized, run-rate impact from the QCP Spin, sale of 64 Brookdale triple-net assets, and the RIDEA II transaction.
(2) Includes straight-line & above/below market rents, accretion on DFL investments and termination fees and adjustments for CCRC non-refundable entrance fees.
(3) Includes ($0.03) from tenant purchase options for Genentech ($310M in Nov’16) and Tenet ($43M in Feb’17), and ($0.01) from other capital recycling activities.
APPENDIXCombined Sources and Uses
With proceeds from QCP, RIDEA II transaction, and Brookdale asset sales, we plan to
pay down $3.15 billion of debt, resulting in an improved credit profile
Sources Uses
$B Timing $B Rate Timing
QCP gross proceeds $1.75 4Q16 HCP debt repayment
RIDEA II transaction 0.47 4Q16 Unsecured bonds and mortgage debt $1.21 6.3% 4Q16
BKD 64 asset sales 1.13 1Q17 Mortgage debt 0.47 5.7% 1Q17
Unsecured bonds 0.25 5.6% 2Q17
Subtotal 1.93 6.1% 32
Revolver draw for 2016 maturities(1) 0.60 6.4% 4Q16-1Q17
Revolver (other) 0.62 1.5% 4Q16-1Q17
Total debt repayment 3.15 5.2%
Spin transaction costs(2) 0.20
Total $3.35 Total $3.35
(1) Revolver balance includes 2016 YTD debt maturities totaling $600 million ($200 million mortgage at 6.6% and $400 million unsecured bonds at 6.3%) at a blended 6.4%.
(2) Includes QCP spin costs (approximately $155 million including financing costs) and debt prepayment penalties (approximately $50 million).
APPENDIXWell-Managed Debt Profile(1)
Weighted Average Weighted Average
Weighted Interest
Average Interest Rate
Rate Weighted Average Maturity
7.0 Maturity
6.0%
6.5
5.5%
6.0
5.0%
5.5
4.5% 5.0
4.0% 4.5
2010 2011 2012 2013 2014 2015 3Q16 Proj 2010 2011 2012 2013 2014 2015 3Q16 Proj 33
Percentage of
Percentage of Fixed Rate Debt
Fixed Rate Debt
100% Weighted average interest rate 200
basis points lower since 2010
95%
Weighted average maturity increased
90%
to 6.7 years
85%
Limited exposure to floating rate debt
80%
75%
2010 2011 2012 2013 2014 2015 3Q16 Proj
(1) As of 9/30/16. Projected figures reflect $3.15 billion of anticipated debt paydown using proceeds from QCP financing, RIDEA II transaction and Brookdale asset
sales during Q4’16 and through Q2’17 (see page 32 for detailed assumptions).
APPENDIXAssumptions for 2016 Guidance & 2017 Outlook
2016 Guidance 2017 Outlook
YoY Cash NOI SPP Growth(1) 2.75%-3.75% 2.5%-3.5%
YoY NOI SPP Growth(1) 1.7%-2.7% 1.5%-2.5%
G&A Expense $103M-$105M $83M-$88M
($89M-$92M excl. severance charges)
Interest Expense $463M-$467M $305M-$315M
Net Dispositions $1.3B @ 7% $1.2B-$1.7B @ 8%
(primarily $1.1B BKD assets) 34
Recurring CapEx / 2nd Generation(2) $88M-$90M $92M-$97M
(7% of cash NOI)(3) (8% of cash NOI)
1st Generation TIs (non-recurring)(2) $152M-$155M $80M-$90M
Re/Development Spend(2) $248M-$251M $315M-$325M
@ 7.5%-8.0% stabilized ROC(4) @ 7.5%-8.0% stabilized ROC(4)
Dividend per Share(5) $2.095 $1.48
Fully Diluted FFO as Adj. Wtd. Avg. Share Count 473M 476M
(1) 2016 Nov 1st Guidance reflects full year same-store growth excluding QCP.
(2) Excludes pro rata share of unconsolidated JV capital spend of: $5M-$7M recurring and $40M-$45M non-recurring/development spend in 2016;
$10M-$15M recurring and $25M-$30M non-recurring/development spend in 2017.
(3) 2016 Cash NOI excludes contribution from QCP.
(4) Estimated stabilized ROC for ground-up development projects only.
(5) 2016 dividend per share is $0.575 for 1Q-3Q and $0.37 for 4Q; 2017 dividend per share is based on last quarter declared, annualized for modeling
purposes.
APPENDIXFull Year 2016 & 2017 Same Property Performance
Cash NOI SPP Growth(1)
2016F 2017F
7.75%
8%
7%
6%
5% 4.25%
4.5%
3.75%
4% 3.25%
2.8% 3.0%
3% 2.2%
2.5%
2% 1.25% 1.25%
1.0% 35
1%
0%
SH NNN SHOP Life Science Medical Office Other Total HCP
Improvement in Senior Housing triple-net performance is primarily driven by contractual rent increases and
additional CapEx rents (2016 impacted by previous rent reduction in BKD portfolio to cancel purchase options)
SHOP performance is primarily driven by higher rates and growth from capital investments
2017 Life Science performance is primarily driven by contractual rent escalators, partially offset by projected
rent abatements and downtime on expiring leases
Steady Medical Office performance benefits from high tenant retention and on-campus locations
Our Diversified Portfolio is Projected to Generate Same-Store Cash NOI Growth
in 2017 of 3%, Led by Continued Strength in our SHOP Platform
(1) Represents forecasted same-store cash NOI growth at the mid-point, excluding QCP for 2016.
APPENDIXDisclaimer This presentation is being presented solely for your information, is subject to change and speaks only as of the date hereof. This presentation and comments made by management do not constitute an offer to sell or the solicitation of an offer to buy any securities of HCP or any investment interest in any business ventures of HCP. This presentation is not complete and is only a summary of the more detailed information included elsewhere, including in HCP’s Securities and Exchange Commission filings. No representation or warranty, expressed or implied is made and no reliance should be placed on the accuracy, fairness or completeness of the information presented. HCP, its affiliates, advisers and representatives accept no liability whatsoever for any losses arising from any information contained in this presentation. FORWARD-LOOKING STATEMENTS Statements in this presentation, as well as statements made by management, that are not historical factual statements are “forward-looking statements” within the meaning of Section 27A of the Securities Act of 1933, as amended, and Section 21E of the Securities Exchange Act of 1934, as amended. Forward-looking statements include, without limitation, our statements regarding our planned or pending transactions, our financing plans, our prospects, and our economic guidance, outlook and expectations. All forward-looking statements are made as of the date hereof, are not guarantees of future performance and are subject to known and unknown risks, uncertainties, assumptions and other factors—many of which are out of our and our management's control and difficult to forecast—that could cause actual results to differ materially from those set forth in or implied by such forward-looking statements. These risks and uncertainties include, but are not limited to: our reliance on a concentration of a small number of tenants and operators for a significant portion of our revenues, with our concentration in Brookdale increasing as a result of the consummation of the spin-off of QCP on October 31, 2016; the financial condition of our existing and future tenants, operators and borrowers, including potential bankruptcies and downturns in their businesses, and their legal and regulatory proceedings, which results in uncertainties regarding our ability to continue to realize the full benefit of such tenants' and operators' leases and borrowers' loans; the ability of our existing and future tenants, operators and borrowers to conduct their respective businesses in a manner sufficient to maintain or increase their revenues and to generate sufficient income to make rent and loan payments to us and our ability to recover investments made, if applicable, in their operations; competition for tenants and operators, including with respect to new leases and mortgages and the renewal or rollover of existing leases; competition for skilled management and other key personnel; availability of suitable properties to acquire at favorable prices and the competition for the acquisition and financing of those properties; our ability to negotiate the same or better terms with new tenants or operators if existing leases are not 36 renewed or we exercise our right to replace an existing tenant or operator upon default; the risks associated with our investments in joint ventures and unconsolidated entities, including our lack of sole decision making authority and our reliance on our partners' financial condition and continued cooperation; our ability to achieve the benefits of investments, including those investments discussed above, within expected time frames or at all, or within expected cost projections; the potential impact on us and our tenants, operators and borrowers from current and future litigation matters, including the possibility of larger than expected litigation costs, adverse results and related developments; the effect on our tenants and operators of legislation and other legal requirements, including licensure, certification and inspection requirements, and laws addressing entitlement programs and related services, including Medicare and Medicaid, which may result in future reductions in reimbursements; changes in federal, state or local laws and regulations, including those affecting the healthcare industry that affect our costs of compliance or increase the costs, or otherwise affect the operations, of our tenants and operators; volatility or uncertainty in the capital markets, the availability and cost of capital as impacted by interest rates, changes in our credit ratings, and the value of our common stock, and other conditions that may adversely impact our ability to fund our obligations or consummate transactions, or reduce the earnings from potential transactions; changes in global, national and local economic conditions, and currency exchange rates; changes in the credit ratings on U.S. government debt securities or default or delay in payment by the government of its obligations; our ability to manage our indebtedness level and changes in the terms of such indebtedness; our ability to maintain our qualification as a real estate investment trust; the impact of the spin-off transaction on our business; and other risks and uncertainties described from time to time in our filings with the Securities and Exchange Commission. We caution investors not to place undue reliance on any forward-looking statements. We assume no, and hereby disclaim any, obligation to update any of the foregoing or any other forward-looking statements as a result of new information or new or future developments, except as otherwise required by law. NON-GAAP FINANCIAL MEASURES This presentation contains certain supplemental non-GAAP financial measures. While HCP believes that non-GAAP financial measures are helpful in evaluating its operating performance, the use of non-GAAP financial measures in this presentation should not be considered in isolation from, or as an alternative for, a measure of financial or operating performance as defined by GAAP. You are cautioned that there are inherent limitations associated with the use of each of these supplemental non- GAAP financial measures as an analytical tool. Additionally, HCP’s computation of non-GAAP financial measures may not be comparable to those reported by other REITs. Reconciliations of the non‐GAAP financial measures to the most directly comparable GAAP financial measures can be found in the Appendix to this presentation.
Definitions
Funds From Operations (“FFO”) We believe FFO applicable to common shares, diluted FFO applicable to common shares, and diluted FFO per common share
are important supplemental non-GAAP measures of operating performance for a REIT. Because the historical cost accounting convention used for real estate assets
utilizes straight-line depreciation (except on land), such accounting presentation implies that the value of real estate assets diminishes predictably over time. Since
real estate values instead have historically risen and fallen with market conditions, presentations of operating results for a REIT that use historical cost accounting for
depreciation could be less informative. The term FFO was designed by the REIT industry to address this issue.
FFO, as defined by the National Association of Real Estate Investment Trusts (“NAREIT”), is net income (loss) applicable to common shares (computed in
accordance with GAAP), excluding gains or losses from sales of depreciable property, including any current and deferred taxes directly associated with sales of
depreciable property, impairments of, or related to, depreciable real estate, plus real estate and other depreciation and amortization, and adjustments to compute our
share of FFO and FFO as adjusted (see below) from joint ventures. Adjustments for joint ventures are calculated to reflect our pro-rata share of both our consolidated
and unconsolidated joint ventures. We reflect our share of FFO for unconsolidated joint ventures by applying our actual ownership percentage for the period to the
applicable reconciling items on an entity by entity basis. We reflect our share for consolidated joint ventures in which we do not own 100% of the equity by adjusting
our FFO to remove the third party ownership share of the applicable reconciling items based on actual ownership percentage for the applicable periods. Our pro-rata
share information is prepared on a basis consistent with the comparable consolidated amounts, is intended to reflect our proportionate economic interest in the
operating results of properties in our portfolio and is calculated by applying our actual ownership percentage for the period. We do not control the unconsolidated joint
ventures, and the pro-rata presentations of reconciling items included in FFO (see above) do not represent our legal claim to such items. The joint venture members
or partners are entitled to profit or loss allocations and distributions of cash flows according to the joint venture agreements, which provide for such allocations
generally according to their invested capital.
The presentation of pro-rata information has limitations which include, but are not limited to, the following: (i) the amounts shown on the individual line items were
derived by applying our overall economic ownership interest percentage determined when applying the equity method of accounting or allocating noncontrolling
interests, and do not necessarily represent our legal claim to the assets and liabilities, or the revenues and expenses; and (ii) other companies in our industry may
calculate their pro-rata interest differently, limiting the usefulness as a comparative measure. Because of these limitations, the pro-rata financial information should
not be considered independently or as a substitute for our financial statements as reported under GAAP. We compensate for these limitations by relying primarily on
our GAAP financial statements, using the pro-rata financial information as a supplement. FFO does not represent cash generated from operating activities in
accordance with GAAP, is not necessarily indicative of cash available to fund cash needs and should not be considered an alternative to net income (loss). We
compute FFO in accordance with the current NAREIT definition; however, other REITs may report FFO differently or have a different interpretation of the current
NAREIT definition from ours.
In addition, we present FFO before the impact of non-comparable items including, but not limited to, severance-related charges, litigation settlement charges,
preferred stock redemption charges, impairments (recoveries) of non-depreciable assets, prepayment costs (benefits) associated with early retirement or payment of
debt, foreign currency remeasurement losses (gains) and transaction-related items (“FFO as adjusted”). Prepayment costs (benefits) associated with early retirement
of debt include the write-off of unamortized deferred financing fees, or additional costs, expenses, discounts, make-whole payments, penalties or premiums incurred
as a result of early retirement or payment of debt. Transaction-related items include acquisition and pursuit costs (e.g., due diligence and closing) and gains/charges
incurred as a result of mergers and acquisitions and lease amendment or termination activities. Management believes that FFO as adjusted provides a meaningful
supplemental measurement of our FFO run-rate and is frequently used by analysts, investors and other interested parties in the evaluation of our performance as a
REIT. At the same time that NAREIT created and defined its FFO measure for the REIT industry, it also recognized that “management of each of its member
companies has the responsibility and authority to publish financial information that it regards as useful to the financial community.” We believe stockholders, potential
investors and financial analysts who review our operating performance are best served by an FFO run-rate earnings measure that includes, in addition to
adjustments made to arrive at the NAREIT defined measure of FFO, other adjustments to net income (loss). FFO as adjusted is used by management in analyzing
our business and the performance of our properties, and we believe it is important that stockholders, potential investors and financial analysts understand this
measure used by management. We use FFO as adjusted to: (i) evaluate our performance in comparison with expected results and results of previous periods,
relative to resource allocation decisions, (ii) evaluate the performance of our management, (iii) budget and forecast future results to assist in the allocation of
resources, (iv) assess our performance as compared with similar real estate companies and the industry in general and (v) evaluate how a specific potential
investment will impact our future results. Other REITs or real estate companies may use different methodologies for calculating an adjusted FFO measure, and
accordingly, our FFO as adjusted may not be comparable to those reported by other REITs.
Net Operating Income from Continuing Operations (“NOI”) NOI and adjusted NOI are non-U.S. generally accepted accounting principles (“GAAP”) supplemental
financial measures used to evaluate the operating performance of real estate. We include properties from our consolidated portfolio, as well as our pro-rata share of
properties owned by our unconsolidated joint ventures in our NOI and adjusted NOI. We believe providing this information assists investors and analysts in estimating
the economic interest in our total portfolio of real estate. Our pro-rata share information is prepared on a basis consistent with the comparable consolidated amounts,
is intended to reflect our proportionate economic interest in the operating results of properties in our portfolio and is calculated by applying our actual ownership
percentage for the period. We do not control the unconsolidated joint ventures, and the pro-rata presentations of revenues and expenses included in NOI (see below)
do not represent our legal claim to such items. The joint venture members or partners are entitled to profit or loss allocations and distributions of cash flows according
to the joint venture agreements, which provide for such allocations generally according to their invested capital.
The presentation of pro-rata information has limitations, which include, but are not limited to, the following (i) the amounts shown on the individual line items were
derived by applying our overall economic ownership interest percentage determined when applying the equity method of accounting and do not necessarily represent
our legal claim to the assets and liabilities, or the revenues and expenses and (ii) other companies in our industry may calculate their pro-rata interest differently,
limiting the usefulness as a comparative measure. Because of these limitations, the pro-rata financial information should not be considered independently or as a
substitute for our financial statements as reported under GAAP. We compensate for these limitations by relying primarily on our GAAP financial statements, using the
pro-rata financial information as a supplement.

                                                                                                                                                                          1
Definitions
NOI is defined as rental and related revenues, including tenant recoveries, resident fees and services, and income from DFLs, less property level operating
expenses; NOI excludes all other financial statement amounts included in net income (loss). Management believes NOI provides relevant and useful information
because it reflects only income and operating expense items that are incurred at the property level and presents them on an unleveraged basis. Adjusted NOI is
calculated as NOI after eliminating the effects of straight-line rents, DFL non-cash interest, amortization of market lease intangibles, non-refundable entrance fees
and lease termination fees (“non-cash adjustments”). Adjusted NOI is oftentimes referred to as “cash NOI.” We use NOI and adjusted NOI to make decisions about
resource allocations, to assess and compare property level performance, and to evaluate our same property portfolio (“SPP”), as described below. We believe that
net income (loss) is the most directly comparable GAAP measure to NOI. NOI should not be viewed as an alternative measure of operating performance to net
income (loss) as defined by GAAP since it does not reflect various excluded items. Further, our definition of NOI may not be comparable to the definition used by
other REITs or real estate companies, as they may use different methodologies for calculating NOI.
Operating expenses generally relate to leased medical office and life science properties and senior housing RIDEA properties. We generally recover all or a portion
of our leased medical office and life science property expenses through tenant recoveries. We present expenses as operating or general and administrative based on
the underlying nature of the expense. Periodically, we review the classification of expenses between categories and make revisions based on changes in the
underlying nature of the expenses
Same Property Portfolio SPP NOI and adjusted NOI information allows us to evaluate the performance of our property portfolio under a consistent population by
eliminating changes in the composition of our portfolio of properties. We include properties from our consolidated portfolio, as well as properties owned by our
unconsolidated joint ventures in our SPP NOI and adjusted NOI (see NOI above for further discussion regarding our use of pro-rata share information and its
limitations). We identify our SPP as stabilized properties that remained in operations and were consistently reported as leased properties or RIDEA properties for the
duration of the year-over-year comparison periods presented, excluding assets held for sale. Accordingly, it takes a stabilized property a minimum of 12 months in
operations under a consistent reporting structure to be included in our SPP. Newly acquired operating assets are generally considered stabilized at the earlier of
lease-up (typically when the tenant(s) control(s) the physical use of at least 80% of the space) or 12 months from the acquisition date. Newly completed
developments and redevelopments are considered stabilized at the earlier of lease-up or 24 months from the date the property is placed in service. SPP NOI
excludes (i) certain non-property specific operating expenses that are allocated to each operating segment on a consolidated basis and (ii) entrance fees and related
activity such as deferred expenses, reserves and management fees related to entrance fees. A property is removed from our SPP when it is sold, placed into
redevelopment or changes its reporting structure.
2Non-GAAP Reconciliations
Projected Cash NOI(1)
Dollars in thousands (Unaudited)
For the projected mid-point full year 2017:
Senior Housing
Triple-net SHOP Life Science Medical Office Other Total
Cash (adjusted) NOI $ 311,700 $ 261,700 $ 270,700 $ 279,700 $ 126,700 $ 1,250,500
Non-cash adjustments to NOI(2) 1,000 (20,000 ) (750 ) 3,050 5,600 (11,100 )
NOI $ 312,700 $ 241,700 $ 269,950 $ 282,750 $ 132,300 1,239,400
Other income and expenses(3) 224,000
Costs and expenses(4) (929,800 )
Net income $ 533,600
Projected Future Operations(1)
(Unaudited)
Full Year 2016 Full Year 2017
Low High Low High
Diluted earnings per common share $ 1.49 $ 1.55 $ 1.07 $ 1.13
Depreciation and amortization 1.20 1.20 1.11 1.11
Other depreciation and amortization 0.03 0.03 0.02 0.02
Taxes associated with real estate disposition 0.11 0.11 — —
Gain on sales of real estate (0.54) (0.54) (0.43) (0.43)
Joint venture FFO adjustments 0.06 0.06 0.11 0.11
Diluted FFO per common share $ 2.35 $ 2.41 $ 1.88 $ 1.94
Transaction-related items and other 0.21 0.21 0.01 0.01
Loss on extinguishment of debt(5) 0.10 0.10 — —
Severance-related charges(6) 0.03 0.03 — —
Diluted FFO as adjusted per common share $ 2.69 $ 2.75 $ 1.89 $ 1.95
3Non-GAAP Reconciliations
Projected SPP NOI and SPP Cash NOI(1)
Dollars in thousands (Unaudited)
For the projected full year 2016 (low):
Senior Housing
Triple-net SHOP Life Science Medical Office Other QCP Total
NOI $ 416,800 $ 236,700 $ 289,700 $ 272,000 $ 123,700 $ 402,600 $ 1,741,500
Non-SPP NOI (22,700) (126,200) (38,600) (35,150) (27,850 ) (402,600 ) (653,100)
SPP NOI 394,100 110,500 251,100 236,850 95,850 — 1,088,400
Non-cash adjustments to SPP NOI(2) (11,200) — 1,500 (250) (900 ) — (10,850)
SPP cash (adjusted) NOI $ 382,900 $ 110,500 $ 252,600 $ 236,600 $ 94,950 $ — 1,077,550
Addback adjustments(7) 663,950
Other income and expenses(3) 253,000
Costs and expenses(4) (1,286,700)
Net income $ 707,800
For the projected full year 2016 (high):
Senior Housing
Triple-net SHOP Life Science Medical Office Other QCP Total
NOI $ 421,100 $ 238,500 $ 292,500 $ 274,600 $ 124,900 $ 408,500 $ 1,760,100
Non-SPP NOI (23,000) (126,950 ) (39,000) (35,450) (28,100 ) (408,500 ) (661,000)
SPP NOI 398,100 111,550 253,500 239,150 96,800 — 1,099,100
Non-cash adjustments to SPP NOI(2) (11,400) — 1,500 (250) (900 ) — (11,050)
SPP cash (adjusted) NOI $ 386,700 $ 111,550 $ 255,000 $ 238,900 $ 95,900 $ — $ 1,088,050
Addback adjustments(7) 672,050
Other income and expenses(3) 257,200
Costs and expenses(4) (1,282,500)
Net income $ 734,800
For the year ended December 31, 2015:
Senior Housing
Triple-net SHOP Life Science Medical Office Other QCP Total
NOI $ 424,841 $ 178,706 $ 278,261 $ 254,555 $ 119,474 $ 598,254 $ 1,854,091
Non-SPP NOI (31,890 ) (72,191 ) (36,106) (20,774) (24,941) (598,254) (784,156)
SPP NOI 392,951 106,515 242,155 233,781 94,533 — 1,069,935
Non-cash adjustments to SPP NOI(2) (11,929 ) — (6,630) (2,465) (291) — (21,315)
SPP cash (adjusted) NOI $ 381,022 $ 106,515 $ 235,525 $ 231,316 $ 94,242 $ — 1,048,620
Addback adjustments(7) 805,471
Other income and expenses(3) 162,951
Costs and expenses(4) (1,113,712)
Impairments, net (1,403,853)
Impairment of investments in unconsolidated joint ventures (45,895)
Net loss $ (546,418)
Projected SPP NOI change for the full year 2016:
Senior Housing
Triple-net SHOP Life Science Medical Office Other Total
Low 0.3% 3.75% 3.7% 1.3% 1.4% 1.7%
High 1.3% 4.75% 4.7% 2.3% 2.4% 2.7%
Projected SPP cash NOI change for the full year 2016:
Senior Housing Medical
Triple-net SHOP Life Science Office Other Total
Low 0.5% 3.75% 7.25% 2.3% 0.75% 2.75%
High 1.5% 4.75% 8.25% 3.3% 1.75% 3.75%
4Non-GAAP Reconciliations
Projected SPP NOI and SPP Cash NOI(1)
Dollars in thousands (Unaudited)
For the projected full year 2017 (low):
Senior Housing
Triple-net SHOP Life Science Medical Office Other Total
NOI $ 310,600 $ 240,500 $ 268,500 $ 281,400 $ 131,700 $ 1,232,700
Non-SPP NOI (18,200) (50,600) (37,300) (25,300) (20,450 ) (151,850)
SPP NOI 292,400 189,900 231,200 256,100 111,250 1,080,850
Non-cash adjustments to SPP NOI(2) 650 — 6,200 (700) (4,450 ) 1,700
SPP cash (adjusted) NOI $ 293,050 $ 189,900 $ 237,400 $ 255,400 $ 106,800 1,082,550
Addback adjustments(7) 150,150
Other income and expenses(3) 220,500
Costs and expenses(4) (933,300)
Net income $ 519,900
For the projected full year 2017 (high):
Senior Housing
Triple-net SHOP Life Science Medical Office Other Total
NOI $ 314,800 $ 242,900 $ 271,400 $ 284,100 $ 132,900 $ 1,246,100
Non-SPP NOI (19,550 ) (51,200 ) (37,900) (25,400) (20,550 ) (154,600)
SPP NOI 295,250 191,700 233,500 258,700 112,350 1,091,500
Non-cash adjustments to SPP NOI(2) 650 — 6,200 (800) (4,500 ) 1,550
SPP cash (adjusted) NOI $ 295,900 $ 191,700 $ 239,700 $ 257,900 $ 107,850 1,093,050
Addback adjustments(7) 153,050
Other income and expenses(3) 227,500
Costs and expenses(4) (926,300)
Net income $ 547,300
For the projected mid-point full year 2016:
Senior Housing
Triple-net SHOP Life Science Medical Office Other QCP Total
NOI $ 418,950 $ 237,600 $ 291,100 $ 273,300 $ 124,300 $ 405,550 $ 1,750,800
Non-SPP NOI (130,050 ) (55,000 ) (57,800) (22,700) (14,900) (405,550) (686,000)
SPP NOI 288,900 182,600 233,300 250,600 109,400 — 1,064,800
Non-cash adjustments to SPP NOI(2) (5,100 ) — 100 (200) (3,400) — (8,600)
SPP cash (adjusted) NOI $ 283,800 $ 182,600 $ 233,400 $ 250,400 $ 106,000 $ — 1,056,200
Addback adjustments(7) 694,600
Other income and expenses(3) 255,100
Costs and expenses(4) (1,284,600)
Net income $ 721,300
Projected SPP NOI change for the full year 2017:
Senior Housing
Triple-net SHOP Life Science Medical Office Other Total
Low 1.2% 4.0% (0.9)% 2.2% 1.7% 1.5%
High 2.2% 5.0% 0.1% 3.2% 2.7% 2.5%
Projected SPP cash NOI change for the full year 2017:
Senior Housing
Triple-net SHOP Life Science Medical Office Other Total
Low 3.25% 4.0% 1.7% 2.0% 0.75% 2.5%
High 4.25% 5.0% 2.7% 3.0% 1.75% 3.5%
(1) The foregoing projections reflect management's view of current and future market conditions, including assumptions with respect to rental rates, occupancy levels, development
items and the earnings impact of the events referenced in this Appendix. These projections do not reflect the impact of unannounced future transactions, except as described
herein, other impairments or recoveries, the future bankruptcy or insolvency of our operators, lessees, borrowers or other obligors, the effect of any future restructuring of our
contractual relationships with such entities, gains or losses on marketable securities, ineffectiveness related to our cash flow hedges, or existing and future litigation matters
including the possibility of larger than expected litigation costs and related developments. Our actual results may differ materially from the projections set forth above. The
5Non-GAAP Reconciliations
aforementioned ranges represent management’s best estimates based upon the underlying assumptions as of the date of this Appendix. Except as otherwise required by law,
management assumes no, and hereby disclaims any, obligation to update any of the foregoing projections as a result of new information or new or future developments.
(2) Represents straight-line rents, DFL non-cash interest, amortization of market lease intangibles, lease termination fees and adjustments for CCRC non-refundable entrance fees.
(3) Represents interest income, gain on sales of real estate, other income, net, income taxes and equity income (loss) from unconsolidated joint ventures, excluding NOI.
(4) Represents interest expense, depreciation and amortization, general and administrative expenses, and acquisition and pursuit costs.
(5) Prepayment costs associated with early retirement or payment of debt subsequent to the spin-off of Quality Care Properties, Inc. and RIDEA II transactions.
(6) Severance-related charges primarily relate to the departure of our former President and Chief Executive Officer.
(7) Represents non-SPP NOI and non-cash adjustments to SPP NOI.
6You can also read