Economic Bulletin - Issue 8 - February 2021 - Staffordshire ...
←
→
Page content transcription
If your browser does not render page correctly, please read the page content below
Economic Bulletin - Issue 8 – February 2021
Welcome to the latest edition of the Staffordshire & Stoke-on-Trent Economic Bulletin
produced by our Economy, Skills and Insight Teams, which provides the timeliest secondary
data available on what is happening with the local economy. However, this clearly only
provides part of the picture and we continue to build up our softer intelligence to provide a
better indication of what is happening on the ground, including the local response to the
COVID-19 crisis and subsequent recovery.

Alongside information on the Claimant Count and Job Vacancies that will be a part of every
Bulletin, we again look at the latest Government data regarding the Coronavirus Job
Retention Scheme (CJRS) Furloughed Workers and the Self-Employment Income Support
Scheme (SEISS). This month’s issue also provides more detailed youth claimant count
analysis and updated ward level analysis of the claimant count to help identify areas which
have been impacted the hardest across Staffordshire & Stoke-on-Trent and where there may
be a greater need for support.

We hope you find the Bulletin useful and welcome your comments and suggestions on
further information you would like to see included in future editions. If you do have any
feedback please send your comments to Darren Farmer, Economy & Skills Analyst at
darren.farmer@staffordshire.gov.uk.

Stay Safe,
Darryl Eyers
Director for Economy, Infrastructure and Skills, Staffordshire County Council
Key Messages

•     Over recent weeks there does feel like there is light at the end of tunnel with the UK
      vaccine programme achieving its first significant milestone of vaccinating more than
      15 million people and offering all of the most vulnerable a first jab. In Staffordshire and
      Stoke-on-Trent more than 300,000 residents have been given their first doses of the
      vaccines.
•     The successful rollout of the vaccines to date alongside the latest lockdown has helped
      see a strong decline in COVID-19 infection rates across most parts of the UK, with
      the R number falling below 1 for the first time since July and therefore the virus is no
      longer growing. There is also emerging evidence of reduced hospitalisations and
      deaths in those vaccinated, easing the pressure on the NHS and saving lives.
•     Although it is important to recognise that virus cases remain high and it is therefore
      vital that everyone continues to follow the guidance, gets tested on a regular basis
      even if they have no symptoms and take up the offer of the vaccine when called to do
      so.
•     To ease lockdown restrictions it is clearly important that the vaccine programme
      continue to be successfully rolled out at pace, with the aim for all over-50s offered a
      vaccine by mid-May and all adults offered a first dose by the end of July.
•     There remain concerns regarding the emergence of new variants but the Government
      and initial scientific studies indicate that the vaccines remain effective. Alongside
      potential booster jabs to combat new variants the expansion of workplace testing
      for staff that are unable to work from home and rapid lateral flow testing will be
      important in preventing the spread of new variants and reopening further parts of the
      economy.
Economic Impact and Support
•     In terms of the ongoing economic impact from the pandemic, the UK economy shrank
      by a record 9.9% in 2020 which was the largest slump since 1709 and is more than
      twice as much as the previous record. However, there was a growth of 1.2% in
      December as some restrictions eased looks to have prevented what could have been
      the country’s first double-dip recession since the 1970s.
•     The rate of unemployment in the UK rose to 5.1% in the three months to December,
      with 1.74 million people unemployed in the October to December period, up 454,000
      from the same quarter in 2019.
•     The economy is expected to shrink by 4.2% in the first three months of 2021, amid
      tighter lockdown restrictions to slow the spread of the virus. More positively the Bank
      of England feels that the economy will rebound strongly due to the rapid vaccine
      rollout leading to improved consumer confidence during spring and summer but this
Staffordshire & Stoke-on-Trent Economic Bulletin – February 2021                   Page | 2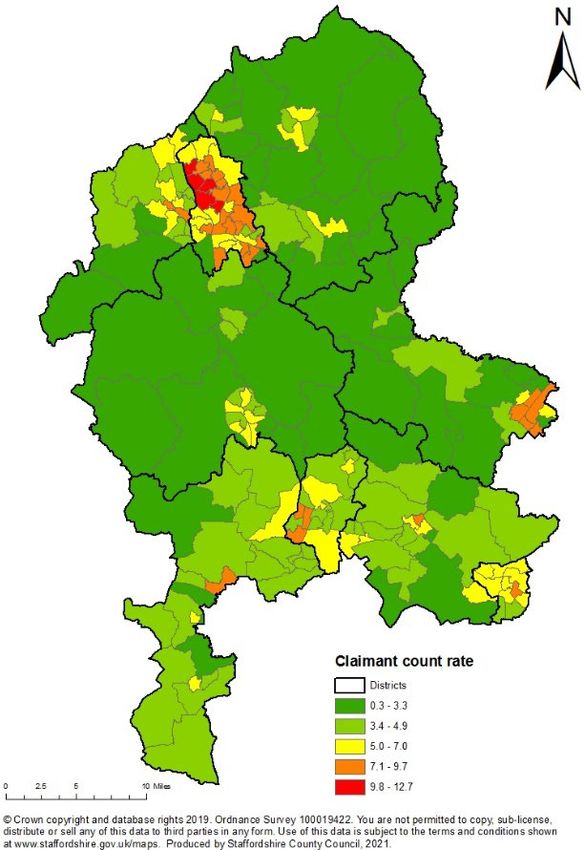
is dependent on controlling new strains.
• To oversee the exiting from lockdown and recovery the Government has this week
announced it’s “cautious” four-part roadmap out of lockdown -
https://www.gov.uk/government/publications/covid-19-response-spring-2021
• There are a number of key earliest possible dates at which point certain easing may
take place if four tests on vaccines, infection rates and new coronavirus variants are
met at each stage, these include:
Step One: 8 March
Schools open and outdoor after-school sports allowed
Two people allowed to sit together outdoors
Care home residents allowed one regular visitor
Step One: 29 March
Six people or two households allowed to meet outdoors
Outdoor sports facilities open and organised sport allowed
Travel outside local area allowed
Step Two: 12 April
Non-essential retail and personal care open
Hospitality outdoors open
Indoor leisure such as gyms and swimming pools open
Self-contained holiday accommodation open
Step Three: 17 May
Outdoors most social contact rules lifted
Six people or two households can meet indoors
Indoor hospitality and hotels open
Step Four: 21 June
All legal limits on social contact removed
Hope to reopen final closed sectors of the economy
• As well as the ‘roadmap’ there is also the Budget on 3rd March where it is expected
that the Chancellor will provide a long-term blueprint which commentators believe is
likely to mean high state spending for a decade, including extending government relief,
such as the furlough scheme and business rates relief, self-employment grants,
business support loans, cuts in VAT and possibly even stamp duty, to prevent a surge
in unemployment while the virus is brought under control.
• This further support comes as the UK recorded their highest January level of borrowing
since records began, with the total borrowed reaching £8.8 billion last month.
• The chancellor has also announced that small businesses will have more time to repay
state-backed loans taken out to help survive the coronavirus lockdown, with the option
to extend the length of the loan from six to ten years under a "pay-as-you-grow"
Staffordshire & Stoke-on-Trent Economic Bulletin – February 2021 Page | 3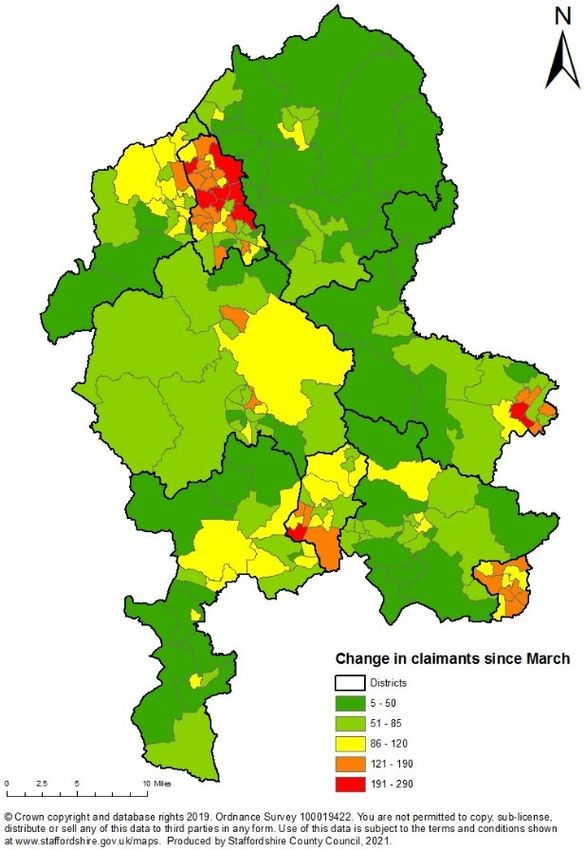
initiative.
•     It will be important that as we progress out of lockdown the Government works with
      business to reopen the economy and unlock investment for a recovery from COVID-
      19.
Green Recovery
•     The LGA has stated that a green industrial revolution could “ignite” the UK’s recovery
      from the pandemic and create up to two million jobs. Up to 1.18 million green jobs
      could be created in England alone by 2050, with a near-fourfold increase to 680,000 in
      just nine years, including roles in the building of more turbines, retrofitting homes and
      by building electric cars.
•     An example of this is the recent announcement by Jaguar that their production will be
      all-electric by 2025, with the company launching electric models of its entire Jaguar
      and Land Rover line-up by 2030 and investing £2.5bn a year on new technology.
•     It is clear that local authorities are best placed to work with employers and skills
      providers to ensure local communities can benefit. Making the right investments now
      and in our Covid recovery will help us towards net zero carbon targets and address the
      economic challenges.
•     Staffordshire County Council has also agreed plans to transform Staffordshire into a
      carbon neutral county council by 2050, with measures including:
       o replacing street lights
       o creating energy from waste
       o more sustainable travel
•     The authority has also committed £600,000 over the next year to push forward the
      climate change agenda, and a further £2m up to 2024/25.
Local Picture
•     Looking locally due to our strong position going into the crisis the number of people
      on some form of government economic support scheme (including Universal Credit,
      Furlough and Self-employment Income Support) is estimated to be lower than the rest
      of the country, 20% compared to 23% nationally, but increased further during the third
      lockdown as more people were furloughed.
•     The claimant count in Staffordshire saw a further decrease of 410 claimants between
      December 2020 and January 2021 to a total of 24,440 claimants and the claimant
      rate has declined to 4.6% of the working age population in January.
•     This shows both the positive effect that the package of Government support such as
      the furlough scheme is having on staving off further job losses.
•     However, the area has seen Universal Credit (UC) claimants more than double since
      March (pre-COVID), an increase of just under 12,400 claimants - however, not all
      will be out of work.

Staffordshire & Stoke-on-Trent Economic Bulletin – February 2021                 Page | 4
•     These increases need to be viewed in the context of the move to Universal
      Credit. Before Universal Credit, the Claimant Count was based upon Jobseeker’s
      Allowance claimants - people out of work but looking for a job. However, in response
      to COVID-19 the Government changed the criteria for Universal Credit to allow some
      people on low income to claim whilst in work. Therefore, there will be a proportion of
      claimants currently that will still be in work but claiming Universal Credit because
      they are on a low income, although from the data released by Government it is not
      currently possible to quantify the proportion of people that are indeed unemployed or
      employed but on a low income.

•     Therefore, the reasons for the increase in claimants are still to fully emerge but evidence
      suggests there will be a combination of factors such as the self-employed no longer
      being able to operate, part-time employees working less than 16 hours a week who
      are now furloughed, and Small & Medium Enterprises laying off staff in the short-term.

•     It is important to recognise that although we have seen a rise in claimant numbers due
      to COVID given our strong position going into the pandemic we still perform
      comparatively well for our claimant rate which stood at 4.6% of the working age
      population in January compared to 7.1% regionally and 6.3% nationally.

•     However, it is young people, women, the lowest paid (including those in manual
      occupations, more routine or less skilled jobs) and part-time workers who continue to
      feel the impact of the economic shock the most. For example, the proportion of
      young people aged 18-24 that are claiming Universal Credit has increased from
      3.7% in March 2020 to 7.3% in January 2021, well above the rate of 4.6% for the
      working age population. Given that it is harder for these groups to find a new job it is
      increasingly vital that the welcomed announcements made in ‘A Plan for Jobs 2020’
      such as the Kickstart Scheme are quickly and effectively put in place to support these
      groups and help prevent them becoming long-term unemployed.

•     The latest Coronavirus Job Retention Scheme (CJRS) figures show that there were
      55,400 furloughed job claims in Staffordshire up to the end of January,
      equivalent to 14% of eligible workers, which is in-line with the regional average but
      slightly lower than the national average of 15%. Stoke-on-Trent had 14,400 jobs still
      furloughed, equivalent to 13% of eligible jobs. The concern is how many of those on
      furlough will be able to return to work once the CJRS scheme ends at the end of April.

•     Staffordshire has seen 25,300 self-employed workers claim for the third SEISS
      grant up to the end of January and a take-up rate of 64% for those eligible through
      the scheme, slightly lower than the regional and national average take-up rates (both
      65%). Stoke-on-Trent had 7,300 SEISS claims up to the end of January, equivalent

Staffordshire & Stoke-on-Trent Economic Bulletin – February 2021                   Page | 5
to 71% of those eligible. This is the highest rate the West Midlands Region upper-tier
authorities. There are concerns as to how many of these businesses will be viable and
able to continue to operate after Government support is withdrawn.
• The ongoing third lockdown has seen a further decline in recruitment during January,
with job vacancies in Staffordshire decreasing by 3% between December and
January equivalent to 550 fewer job vacancies, which is slightly above the 2%
decline seen nationally. Stoke-on-Trent also saw a decline of 2% with just over
110 fewer vacancies in January compared to December. However, it is still positive
that vacancy levels remain above those seen a year earlier.
• We continue to see demand for roles in health, social care and logistics e.g. ASOS
and Pets at Home with clear emerging opportunities for job creation in digital
(including online retail), advanced manufacturing (AI, Automation and Machine
Learning), construction (£900 million Getting Building Fund) and the green
economy (including retrofitting homes to improve energy efficiency and electric
cars).
• We will also look to build on existing strengths including advanced manufacturing
through the adoption of AI, Automation and Machine Learning, construction to
achieve Government house building targets and build major new infrastructure
projects such as HS2 and West Midlands Freight Interchange, and advanced logistics
with the online retail boom such as the recent announcement of ASOS’s decision to
build a £90million distribution centre creating 2,000 jobs close to Cannock and
Tamworth were jobs will be very much needed.
• Although the number of job vacancies has been impacted by the latest lockdown and
tighter restrictions it is important that we continue to work together to support our
residents reskill and upskill into the roles that do exist such as through the work of the
Countywide Redundancy Task Group, the £2 billion Government Kickstart Scheme
– find out more about the types of roles and how to express an interest at the Stoke-
on-Trent and Staffordshire Enterprise Partnership website, and the Government
Restart Scheme.
Local initiatives
• We are continuing to prioritise support for small businesses and people whose jobs or
employment prospects have been impacted by the pandemic.
• In addition to the package of support already being delivered by the county council
and programmes by a range of other organisations, including , Staffordshire County
Council is working with our district and borough council partners to produce a £5m
support package that will help more businesses and more people.
Staffordshire & Stoke-on-Trent Economic Bulletin – February 2021 Page | 6This includes:
• More funding on top of the Additional Restrictions Grant managed by the district
and borough councils - the county council will be investing £860,000 towards the
scheme.
• Contributing to the cost of apprentices through 'The Staffordshire 500'
Apprentices Wage Support programme - Supporting smaller businesses not paying
into the national apprenticeship levy by contributing to the cost of the wages of 16 to
24-year olds. This could create up to 500 apprentices.
• Up to £5,000 for re-training through the 'Nil Cost Training for Employers Top-up
Project' - offering businesses the opportunity to up-skill employees or train new staff
if looking to change business operations or enter new markets. Up to £5,000 would be
provided and matched through other funding sources. Up to 400 Staffordshire
businesses could be supported over the next 15 months through the programme.
• The Small Business ‘To Thrive’ Financial Support programme - would offer grants
to small businesses between £2,000 and £5,000 to cover expenditure costs. Applicants
would need to demonstrate all the measures they have put in place to remain open
during the restriction period.
• More information when the new initiatives go live will be available here.
• Other support you can access now includes over £615,000 in start-business support,
including:
o The Start-Up Programme of free online webinars and training - get your business
going
o The Start-Up Loans Scheme - of £3,000 to £5,000 for people who have completed
the Start-Up Programme
o 'Ignite' - the start-up programme supporting students to start up their own
business
o The Redundancy and Recruitment Triage Service - Free and one to one support
for you and your staff if you are having to make redundancies. The service helps
people discover their transferable skills and match them to new work.
• The Growth Hub has launched its online webinar library to provide dedicated
support to local businesses on topics ranging from funding and finance to marketing,
HR and business growth. You can access the library here.
• Keele University and partners have launch ambitious plans to strengthen recovery and
help SMEs. The Keele Deal I Recovery will create a wide-ranging programme of
contributions aimed at achieving a major impact on our area's recovery from Covid-
Staffordshire & Stoke-on-Trent Economic Bulletin – February 2021 Page | 719. The Deal sees Keele University working with partners, including the county council,
to develop responses to the increasing job losses and changing labour market caused
by the pandemic, ensuring that current and future generations of workforce have the
skills they need. The Deal incorporates a number of projects, including the expansion
of the University's Science and Innovation Park. Innovation Centre 7 is set for
completion in the spring of 2022 and specialising in digital enhancement and will help
more than 300 SMEs to benefit from a data analytics transformation programme.
• In conclusion, it is apparent that the third national lockdown and tighter restrictions
have caused further economic impact to businesses and jobs but it continues to be
clear that Government and local support is playing a vital role in helping
businesses to survive and stave off further job losses. Alongside this the increasing
speed and success of the vaccination programme rollout is a major step in the right
direction to reducing further impacts.
• As the vaccines continue to be provided to the general population it is vital that
additional support such as the Additional Restrictions Grant is utilised to help
businesses transition to new business models including diversification and
digitisation to improve their viability and sustainability. Alongside this the Restart
Scheme has an important role to play in ensuring that local residents have the
skills needed within the local economy to support increased growth, productivity
and prosperity.
Staffordshire & Stoke-on-Trent Economic Bulletin – February 2021 Page | 8Local Picture – Residents on Government Support Schemes During this period it is important to be able to understand how local businesses are responding to the gradual reopening of the economy and what impact COVID-19 has had and continues to have on jobs. A key aspect of this is monitoring the number of people claiming Universal Credit (Claimant Count), and the number of people on the Coronavirus Job Retention (CJRS) and Self-Employment Income Support Schemes (SEISS), as seen below. Overall Number of Residents on Government Support Schemes In line with the Claimant Count rate which shows the proportion of the working age population claiming Universal Credit we have calculated the proportion of the working age population which may be on the furloughed or have accessed SEISS support. In total there are potentially just over 139,000 residents in the SSLEP area on Government support, equivalent to around 20% of the working age population which is lower than the regional (22%) and national (23%) averages. Tamworth (22%) and Cannock Chase (21%) have the highest rates while Newcastle-under-Lyme (18%) and Stafford (18%) have the lowest. SSLEP Working Age Population 694,954 Jobs in High Risk Sectors 221,000 Claimant Count Jan 2021 36,860 Coronavirus Job Retention Scheme (CJRS) Furloughed job claims as at 31st Jan 69,800 Self-Employment Income Support Scheme (SEISS) claims up to 31st Jan 32,600 Potential workers on Government support 139,260 Potential % of working age population on Government support 20.0% Note: Important to recognise that there may be some workers which are accessing more than one support scheme and there may be some double counting due to jobs moving on and off the furlough scheme Staffordshire & Stoke-on-Trent Economic Bulletin – February 2021 Page | 9
Detailed Breakdown
     Claimant Count 1
     The following table highlights the level of claimant unemployment in the Staffordshire
     Districts and each of the Strategic Authorities in the West Midlands Region:

                            Claimant Count (Universal Credit) Statistics: January 2021

                                                 Claimant                                      Monthly                      Change in    Change in
                                  Claimant                      Claimant      Number of                      Monthly
                                                Count Rate                 1                  Change in                     Claimants    Claimants
Area                             Count Rate                    Count Rate      Claimants                    Change in
                                                (December                                     Claimants                   since March   since March
                               (January 2020)                (January 2021) (January 2021)                Claimants (%)
                                                   2020)                                     (Numbers)                     (Numbers)        (%)

England                             2.9             6.3            6.3         2,200,965      -15,820        -0.7%         1,137,460      107.0%
West Midlands                       3.8             7.2            7.1          260,100        -1,790        -0.7%          115,750       80.2%

SSLEP                               2.6             5.4            5.3           36,860         -460         -1.2%          17,490        90.3%

Birmingham                          6.5            11.1           11.1           81,210          -25          0.0%          31,840        64.5%
Wolverhampton                       5.9            10.3           10.3           16,750          30           0.2%          6,370         61.4%
Sandwell                            4.9            9.5            9.4            19,325          -60         -0.3%          8,545         79.3%
Walsall                             4.6            8.5            8.5            14,705          20           0.1%          6,100         70.9%
Stoke-on-Trent                      4.4            7.8            7.8            12,420          -50         -0.4%          5,100         69.7%
Dudley                              4.2            7.3            7.3            14,110         -110         -0.8%          5,595         65.7%
Coventry                            3.0            6.6            6.5            16,270         -155         -0.9%          8,270         103.4%
Telford and Wrekin                  2.9            6.0            5.9            6,565          -150         -2.2%          3,135         91.4%
Solihull                            2.8            5.9            5.8            7,460           -55         -0.7%          3,810         104.4%
Worcestershire                      2.3            5.2            5.1            17,855         -355         -1.9%          9,550         115.0%
Warwickshire                        2.1            4.7            4.6            16,215         -265         -1.6%          8,385         107.1%
Staffordshire                       2.1            4.6            4.6            24,440         -410         -1.6%          12,390        102.8%
Shropshire                          2.0            4.4            4.4            8,305          -135         -1.6%          4,295         107.1%
Herefordshire, County of            1.8            4.0            4.0            4,470           -75         -1.7%          2,360         111.8%

Tamworth                            3.0             6.1            5.9           2,790          -85          -3.0%           1,300        87.2%
Cannock Chase                       2.5             5.3            5.3           3,355           5            0.1%           1,700        102.7%
East Staffordshire                  2.1             5.0            5.0           3,645          -40          -1.1%           1,925        111.9%
Newcastle-under-Lyme                2.3             4.6            4.5           3,670          -95          -2.5%           1,690        85.4%
Lichfield                           2.0             4.4            4.3           2,650          -75          -2.8%           1,330        100.8%
South Staffordshire                 1.9             4.4            4.3           2,920          -45          -1.5%           1,610        122.9%
Stafford                            1.9             4.1            4.0           3,305          -70          -2.1%           1,650        99.7%
Staffordshire Moorlands             1.6             3.7            3.6           2,100          -15          -0.7%           1,180        128.3%
1
    The claimant rate is the proportion of the working age population claiming benefits

     •     The Claimant Count in Staffordshire saw a further decrease of 410 between December
           2020 and January 2021 to a total of 24,440 claimants. While Stoke-on-Trent saw a
           decrease of 50 over the same period with a total of 12,420 claimants in January.

     •     These decreases in the Claimant Count are similar to the decline seen nationally. This
           reflects both the positive effect that the package of Government support such as the
           furlough scheme is having in staving off higher job losses and the job opportunities
           that are now available.

     •     It is also important to look at the change in the Claimant Count seen since March 2020
           (pre-COVID) where the number of claimants in Staffordshire has more than doubled
           with an increase of 12,390 claimants and in Stoke-on-Trent there has been an increase
           of 5,100.

    Staffordshire & Stoke-on-Trent Economic Bulletin – February 2021                                                         Page | 10
• Ultimately, the full effect of COVID-19 on employment will not be felt until the furlough
and SEISS schemes and further Government support comes to an end.
• The increases in the Claimant Count also need to be viewed in the context of the move
to Universal Credit. Before Universal Credit, the Claimant Count was based upon
Jobseeker’s Allowance claimants, i.e. people out of work but looking for a job. A
proportion of claimants currently will have a job but claiming Universal Credit due to
having a low income - the reasons for the increase in claimants are still to fully emerge
but evidence suggests there will be a combination of factors such as:
o New Job Starters/PT employees/Self-employed with no income claiming Universal
Credit because they are not eligible for the CJRS;
o Self-employed ceased trading or have very low income claiming Universal Credit
(and are either not eligible for, or not yet been paid, income under the SEISS);
o Working part-time low-income workers claiming Universal Credit and may be
furloughed;
o Potential Redundancies within Small & Medium Enterprises laying off staff in the
short-term.
• Unfortunately, due to Government data limitations it is not currently possible to
quantify the proportion of people that fall into these cohorts at a local level.
• Given the comparatively strong position of Staffordshire going into the pandemic and
the fact that COVID-19 has impacted much of the economy during lockdown, even with
the significant increase in claimants the proportion of working age residents on such
benefits remains comparatively low in Staffordshire with a rate of 4.6% in December
compared to 7.1% regionally and 6.3% nationally. In Stoke-on-Trent the Claimant
Count rate remains above both the regional and national averages at 7.8%.
• This month all Staffordshire Districts have seen a decline in the claimant count with the
exception of Cannock Chase which saw a small rise of 5. Newcastle-under-Lyme,
Tamworth and Lichfield saw the largest decreases in the number of working age
claimants in January.
• Tamworth and Cannock Chase continue to record the highest rates in Staffordshire,
although Newcastle-under-Lyme and East Staffordshire have the largest caseloads.
However, it’s important to note all Districts and Boroughs remain lower than the current
national and regional rates.
1
Source: https://www.nomisweb.co.uk/
Staffordshire & Stoke-on-Trent Economic Bulletin – February 2021 Page | 11• As well as workers across sectors being impacted differently, there are also signs that it
is the lowest paid, women, part-time workers and young people (particularly
apprentices) that are being hardest hit. These groups are more likely to work in sectors
that have shut down or reduced activity, such as hospitality and non-essential retail.
They are also less likely to be able to work from home.
Youth Claimant Count (Universal Credit) Statistics: January 2021
Youth Monthly Change in Change in
Youth Youth Number of Monthly
Claimant Change in Youth Youth
Claimant Claimant Youth Change in
Area Count Rate Youth Claimants Claimants
Count Rate Count Rate 1 Claimants Youth
(December Claimants since March since March
(January 2020) (January 2021) (January 2021) Claimants (%)
2020) (Numbers) (Numbers) (%)
England 3.9 8.9 8.8 419,235 -2,260 -0.5% 221,505 112.0%
West Midlands 4.9 9.9 9.7 51,220 -960 -1.8% 23,315 83.6%
SSLEP 3.9 8.2 8.1 7,225 -115 -1.6% 3,405 89.1%
Wolverhampton 8.5 15.1 14.8 3,165 -50 -1.6% 1,255 65.7%
Sandwell 7.3 15.1 14.7 3,895 -95 -2.4% 1,780 84.2%
Walsall 7.6 13.7 13.6 3,110 -30 -1.0% 1,195 62.4%
Dudley 6.9 12.8 12.5 2,995 -70 -2.3% 1,245 71.1%
Birmingham 6.0 11.3 11.1 15,685 -205 -1.3% 6,580 72.3%
Solihull 5.1 11.2 11.0 1,670 -30 -1.8% 845 102.4%
Stoke-on-Trent 5.5 10.1 10.0 2,370 -15 -0.6% 965 68.7%
Telford and Wrekin 4.7 10.1 9.7 1,460 -60 -3.9% 700 92.1%
Worcestershire 3.7 8.5 8.3 3,445 -105 -3.0% 1,850 116.0%
Shropshire 3.8 8.1 7.9 1,650 -45 -2.7% 825 100.0%
Staffordshire 3.3 7.5 7.3 4,855 -100 -2.0% 2,440 101.0%
Herefordshire, County of 3.2 6.8 6.7 820 -10 -1.2% 405 97.6%
Warwickshire 2.8 6.6 6.5 2,960 -40 -1.3% 1,625 121.7%
Coventry 2.7 6.1 5.9 3,140 -105 -3.2% 1,605 104.6%
Tamworth 4.8 10.8 10.7 615 -10 -1.6% 320 108.5%
Cannock Chase 4.4 10.2 10.0 735 -15 -2.0% 370 101.4%
East Staffordshire 3.2 8.0 7.9 670 -5 -0.7% 350 109.4%
South Staffordshire 3.0 7.5 7.4 590 -10 -1.7% 340 136.0%
Lichfield 3.3 7.5 7.1 500 -30 -5.7% 230 85.2%
Stafford 3.2 6.6 6.7 610 5 0.8% 295 93.7%
Staffordshire Moorlands 2.7 6.1 6.1 390 0 0.0% 215 122.9%
Newcastle-under-Lyme 2.8 5.6 5.4 750 -30 -3.8% 325 76.5%
1
The claimant rate is the proportion of the working age population claiming benefits
• Young people aged 18-24 continue to be disproportionately impacted by
unemployment where the claimant rate for young people in Staffordshire has increased
from 3.7% in March to 7.3% in January compared to a rise from 2.3% to 4.6% for all
working-age residents, while in Stoke-on-Trent the rate has risen from 5.9% in March
to 10.0% in January.
• Staffordshire has seen a decrease of 100 in the youth claimant count over the latest
month to a total of 4,855, while Stoke-on-Trent has seen a decline of 15 to 2,370 youth
claimants.
• This month the majority of Staffordshire Districts saw slight decreases in youth
claimants, with the exception of Stafford which saw an increase of 5 and Staffordshire
Moorlands which remained unchanged. Tamworth and Cannock Chase continue to
record the highest rates in Staffordshire, both above the regional and national averages.
Staffordshire & Stoke-on-Trent Economic Bulletin – February 2021 Page | 12Claimant Counts and Rates in Staffordshire & Stoke-on-Trent Wards
• The following maps and tables provide the latest breakdown of the claimant count by
wards in Staffordshire & Stoke-on-Trent.
Claimant Count Rate January 2021
Out of the 201 wards in Staffordshire &
Stoke-on-Trent, 46 were above the England
average of 6.3% for the number of claimants
as a proportion of the working age
population.
The top 15 wards with the highest claimant
count rate were all in Stoke-on-Trent with
Joiner’s Square (12.7% or 570 claimants),
Moorcroft (12.3% or 450), and Etruria and
Hanley (12.2% or 635 claimants) having the
highest rates.
In Staffordshire, Cannock North in Cannock
Chase (8.4% or 395), Burton in East
Staffordshire (8.4% or 250) and Anglesey in
East Staffordshire (8.2% or 435) had the
highest claimant count rates.
Change in Claimant Count since March 2020
The top 3 wards with the highest change in
the number of claimants since March 2020
were in Stoke-on-Trent and included Birches
Head and Central Forest Park (290 increase
to 680 in total), Etruria and Hanley (280 rise
to 635), and Bentilee and Ubberley (250
increase to 650).
In Staffordshire the highest increases were
seen in Anglesey in East Staffordshire (245
rise to 435), Shobnall in East Staffordshire
(225 increase to 435) and Cannock South
(200 rise to 425).
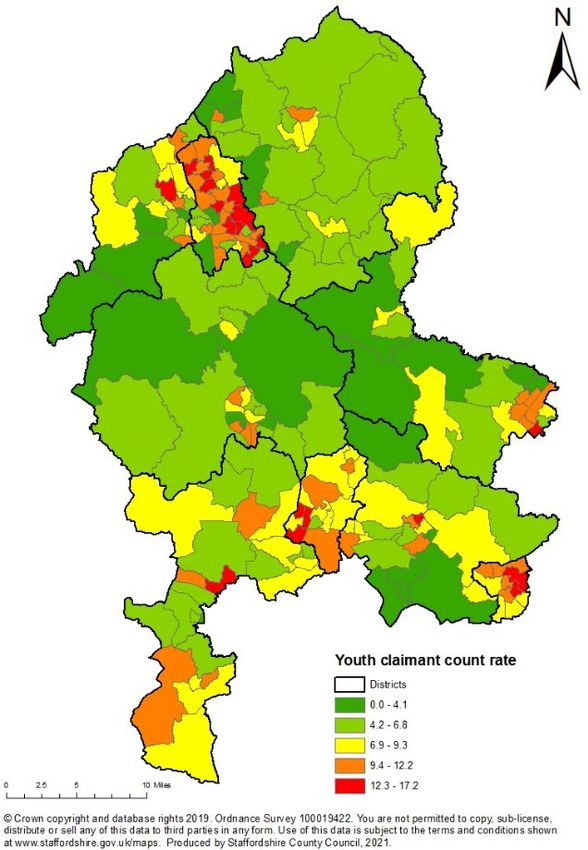
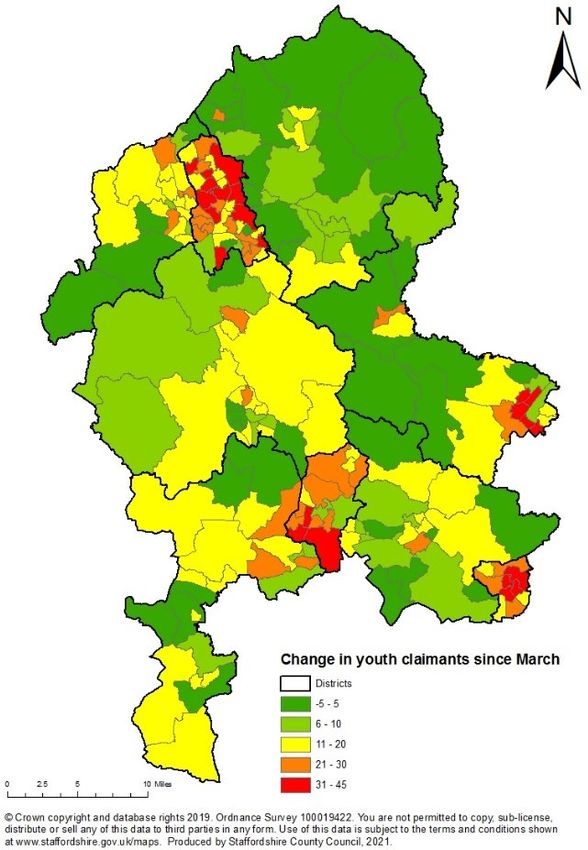
Staffordshire & Stoke-on-Trent Economic Bulletin – February 2021 Page | 13Youth Claimant Counts and Rates in Staffordshire & Stoke-on-Trent Wards The following maps and tables provide the latest breakdown of the youth claimant count by wards in Staffordshire & Stoke-on-Trent. Youth Claimant Count Rate January 2021 Out of the 201 wards in Staffordshire & Stoke-on-Trent, 75 were at or above the England average of 8.8% for the number of claimants aged 18-24 as a proportion of the 18-24 population. Of the top 10 wards with the highest youth claimant count rate 7 were in Stoke-on-Trent including Joiner’s Square (16.3%), Moorcroft (15.8%), Burslem Park (14.9%), Bentilee and Ubberley (14.4%), Meir North (14.4%), Abbey Hulton and Townsend (14.0%) and Tunstall (13.8%). In Staffordshire, the highest rate was Glascote in Tamworth with 17.3%, followed by Cannock South (13.8%) and Curborough in Lichfield (13.8%). Change in Youth Claimant Count since March 2020 Out of the top 10 wards with the highest change in the number of youth claimants since March 2020 8 were in Stoke-on-Trent including Burslem Park (45 rise to 65), Tunstall (45 rise to 85) and Birches Head and Central Forest Park (45 rise to 115). In Staffordshire, the highest increases were seen in Glascote in Tamworth (45 rise to 100), Belgrave in Tamworth (45 rise to 75) and Cannock South (40 rise to 90). Staffordshire & Stoke-on-Trent Economic Bulletin – February 2021 Page | 14
Coronavirus Job Retention Scheme (CJRS) Furloughed Jobs 2

•   HMRC have released local authority level breakdowns of the CJRS scheme for claims
    submitted to HMRC by 15th February 2021 for the period up to 31st January 2021.

•   HMRC have stated that the CJRS claims data are provisional and subject to revisions in
    future releases due to additional claims submitted following this release. This means
    that figures are preliminary and are likely to be revised upwards in future releases, with
    HMRC estimating that the number of claims reported for January could increase by
    around 3%.

•   Based on the provisional figures, Staffordshire had the 2nd highest number of
    furloughed job claims up to the end of January in the WM with 55,400, behind
    only Birmingham and equivalent to 14% of eligible workers. This is to be expected
    given Staffordshire is the 2nd largest strategic authority area in the region but shows the
    potential size of the challenge as furlough ends.

•   Between December and January Staffordshire has seen an increase of 8,700
    furloughed jobs, reflecting the impact of the third lockdown and tighter
    restrictions. This has seen Staffordshire’s rate of furlough increase from 12% to
    14% but remains in-line with the regional average and slightly lower than the
    national average (15%).

•   Stoke-on-Trent has seen the number of furloughed jobs increase from 12,200 to
    14,400, equivalent to 13% of eligible jobs.

           Coronavirus Job Retention Scheme (CJRS) Statistics: February 2021
                                                                            Total
                                                                   employments Total take up-
                                                         Total        furloughed           rate
                                                employments                    at            at
            County and district / unitary         eligible for         31 January   31 January
            authority                                furlough       (provisional) (provisional)
            England                                 25,577,900         3,769,700           15%
            South Staffordshire                         48,300             7,200           15%
            Tamworth                                    38,400             5,700           15%
            Lichfield                                   47,300             7,000           15%
            West Midlands                            2,580,400           366,400           14%
            Cannock Chase                               46,400             6,600           14%
            Staffordshire County                       398,200            55,400           14%
            East Staffordshire                          58,400             8,100           14%
            SSLEP                                      510,800            69,800           14%
            Staffordshire Moorlands                     42,300             5,700           14%
            Newcastle-under-Lyme                        55,200             7,200           13%
            Stoke-on-Trent UA                          112,600            14,400           13%
            Stafford                                    61,900             8,000           13%
            Source: HMRC CJRS and PAYE Real Time Information

2
  Source: HMRC – https://www.gov.uk/government/statistics/coronavirus-job-retention-scheme-statistics-
february-2021

Staffordshire & Stoke-on-Trent Economic Bulletin – February 2021                           Page | 15
• There is concern as to how many of those workers which remain on furlough are to
return to work once furlough ends at the end of April.
• The national data provides more detailed breakdowns than available for local
authorities and looking at the national picture allows for greater insight into who is
currently being supported by the furlough scheme.
• Nationally there were 802,000 (an increase of nearly 100,000 since December)
employers making 4,703,600 (an increase of over 728,500 since December) furloughed
job claims up to the end of January.
• Over two thirds (68%) of claims were made by SMEs with 32% in large businesses with
250+ employees. While of those workers furloughed, over two thirds (68%) were fully
furloughed and 28% partially furloughed with 4% unknown. The proportion that are
fully furloughed had been declining going into the second lockdown but has risen due
to the impact of the second lockdown and third lockdown.
• The following chart shows the trend in furloughed job claims nationally, it shows that
as lockdown was eased furlough claims gradually declined, however it is clear that the
second and third lockdowns impacted jobs between November and January.
Coronavirus Job Retention Scheme (CJRS) Statistics: February 2021 Time Series
Staffordshire & Stoke-on-Trent Economic Bulletin – February 2021 Page | 16• Nationally, the identified high-risk sectors of ‘Accommodation and Food services’ and
‘Arts, entertainment and recreation’ have by far the highest furlough take-up rates.
While it is ‘Accommodation and Food services’ and ‘Wholesale and retail including the
repair of motor vehicles’ which have the highest number of jobs that are still furloughed,
with these two sectors seeing by far the highest increases during the third lockdown.
Coronavirus Job Retention Scheme (CJRS) Statistics: February 2021 by Sector
Employers Employments
Value of
claims made
Employers Employers for periods
(PAYE furloughing Employments 1 November
schemes) staff Take-up rate furloughed Take-up rate to
with staff at at Employments at at 31 January
eligible for 31 January 31 January eligible for 31 January 31 January (provisional)
Sector furlough (provisional) (provisional) furlough (provisional) (provisional) (£ million)
Accommodation and food services 133,800 90,400 68% 2,037,800 1,147,200 56% 2,520
Wholesale and retail; repair of motor vehicles 249,100 130,400 52% 4,520,000 938,500 21% 1,833
Administrative and support services 165,300 71,900 43% 2,739,200 387,000 14% 866
Arts, entertainment and recreation 41,000 26,100 64% 574,900 315,100 55% 652
Manufacturing 101,300 49,200 49% 2,363,400 312,800 13% 704
Professional, scientific and technical 308,000 102,400 33% 2,255,200 270,600 12% 662
Construction 239,100 94,000 39% 1,297,700 244,100 19% 595
Other service activities 93,600 59,200 63% 548,800 222,600 41% 444
Education 39,600 19,200 49% 3,236,600 188,200 6% 233
Transportation and storage 77,100 30,400 39% 1,373,600 187,600 14% 525
Health and social work 101,300 35,000 35% 4,199,600 183,000 4% 286
Information and communication 146,200 39,100 27% 1,239,400 110,500 9% 294
Real estate 48,000 20,500 43% 437,400 64,900 15% 154
Finance and insurance 34,500 9,300 27% 1,083,500 31,400 3% 77
Agriculture, forestry and fishing 33,700 5,800 17% 207,000 21,200 10% 38
Water supply, sewerage and waste 5,800 2,600 45% 177,100 14,200 8% 35
Public administration and defence; social security 7,700 300 4% 1,374,100 9,500 1% 13
Households 77,700 2,600 3% 133,000 3,400 3% 7
Energy production and supply 1,300 400 32% 133,200 3,000 2% 9
Mining and quarrying 1,000 300 30% 48,900 2,100 4% 6
Unknown and other 53,300 13,600 - 195,600 46,600 - 103
Total 1,958,200 802,700 41% 30,175,900 4,703,600 16% 10,057
Source: HMRC CJRS and PAYE Real Time Information
• The Government has now set out its roadmap out of lockdown and it is clear that due
to the given timings of lifting certain restrictions there will be certain sectors which will
continue to be adversely affected until such measures are lifted. In the longer-term,
specific industrial sectors and the associated labour market may continue to be
adversely affected, particularly due to reduced economic support measures and
challenging market conditions.
• A particular risk is the end of the Government’s Job Retention Scheme (JRS) at the end
of April. The JRS has been successful in enabling many people to remain in employment
but furloughed during the crisis but once this comes to an end there are concerns that
many furloughed workers may find themselves out of work.
Staffordshire & Stoke-on-Trent Economic Bulletin – February 2021 Page | 17Self-Employment Income Support Scheme (SEISS) 3
• Staffordshire has seen 25,300 self-employed workers claim for the third SEISS
grant up to the end of January and a take-up rate of 64% for those eligible through
the scheme, which is slightly below the regional and national average take-up rates
(both 65%).
• Stoke-on-Trent had 7,300 SEISS claims up to the end of January, equivalent to
71% of those eligible. This is the highest rate the West Midlands Region upper-tier
authorities.
Self-Employment Income Support Scheme (SEISS) Statistics: February 2021
Total Total no. of Average value
potentially claims Total value of of claims
County and district / unitary eligible made to claims made to made to Total Take-
authority population 31/01/21 31/01/21 (£) 31/01/21 (£) Up Rate
Stoke-on-Trent UA 10,400 7,300 18,300,000 2,500 71%
Cannock Chase 5,000 3,500 10,600,000 3,000 70%
Tamworth 3,000 2,000 5,600,000 2,800 68%
Newcastle-under-Lyme 5,200 3,400 9,800,000 2,900 66%
South Staffordshire 5,300 3,500 10,100,000 2,900 66%
SSLEP 49,800 32,600 91,200,000 2,798 65%
England 3,067,000 1,998,000 5,666,000,000 2,836 65%
Lichfield 4,800 3,100 9,500,000 3,100 65%
West Midlands 259,000 170,000 461,000,000 2,700 65%
East Staffordshire 5,200 3,300 8,700,000 2,600 64%
Staffordshire County 39,400 25,300 72,900,000 2,900 64%
Stafford 5,600 3,400 9,800,000 2,900 60%
Staffordshire Moorlands 5,400 3,100 8,800,000 2,800 58%
• Nationally, transport and storage, education, construction, and arts,
entertainment and recreation remain the sectors which have seen the highest
take-up rates.
3
Source: HMRC - https://www.gov.uk/government/statistics/self-employment-income-support-scheme-
statistics-february-2021
Staffordshire & Stoke-on-Trent Economic Bulletin – February 2021 Page | 18Job Vacancies 4
• The ongoing third lockdown has seen a further decline in recruitment during January,
with job vacancies in Staffordshire decreasing by 3% between December and
January equivalent to 550 fewer job vacancies, which is slightly above the 2%
decline seen nationally.
• Stoke-on-Trent also saw a decline of 2% with just over 110 fewer vacancies in
January compared to December.
• However, it is still positive that vacancy levels remain above those seen a year
earlier.
Staffordshire & Stoke-on-Trent Unique Job Vacancies Trend
• The third lockdown has impacted the majority of occupational groups with only ‘skilled
trades occupations’ and ‘administrative and secretarial occupations’ seeing a small
increases in vacancies over the last month.
• As seen last month the occupations to see the most significant declines during January
were associated to the logistics sector with elementary storage occupations and van
drivers accounting for over a third of the total decline in vacancies seen in Stoke-on-
Trent and Staffordshire. This is likely a reflection of the large number of businesses that
4
Source: EMSI
Staffordshire & Stoke-on-Trent Economic Bulletin – February 2021 Page | 19have had to close during the lockdown and therefore not requiring logistics during the
period.
• By far the main recruitment growth occupations between Feb (pre-COVID) and
January have been nurses and elementary storage occupations.
Top 20 occupations declining and top 20 increasing between Feb 2020 (Pre-COVID) and
Jan 2021 in SSLEP
• While demand for roles in health and social care including nurses and social care
workers and home carers alongside roles in logistics such as elementary storage
occupations and van drivers remain by far the strongest of all occupations.
• There is also demand for primary and nursery education teaching professionals,
which is an area which was badly impacted during lockdown. While in manufacturing
metal working production and maintenance fitters remain the occupation in most
demand.
Staffordshire & Stoke-on-Trent Economic Bulletin – February 2021 Page | 20• As well as these more sector specific roles, there is continuing and growing demand for
workers which support numerous sectors including sales and business development
mangers, programmers and software development professionals, book-keepers,
and admin roles.
Top 20 occupations in demand in SSLEP during January2021
• It is clear that there are jobs available in the local economy but clearly there will be
increasing competition for those roles. The national and local support which is in place
to support those that have been unfortunate enough to lose their jobs is vital in both
reskilling and upskilling as well as enabling them to access the opportunities available.
Job Vacancies Summary Table
Dec 2020- Feb 2020- Jan 2020-
Dec 2020- Feb 2020- Jan 2020-
Jan 2020 Feb 2020 Nov 2020 Dec 2020 Jan 2021 Jan 2021 Jan 2021 Jan 2021
Jan 2021 Jan 2021 Jan 2021
Area / SSLEP Occupational Group Unique Unique Unique Unique Unique (Month on (Month on (Year on
Monthly % Monthly % Annual %
Postings Postings Postings Postings Postings Month Month Year
Change Change Change
Change) Change) Change)
Staffordshire CC 20,223 21,569 22,232 20,769 20,217 -552 -3% -1,352 -6% -6 0%
Stoke-on-Trent 6,519 7,346 7,701 7,426 7,314 -112 -2% -32 0% 795 12%
SSLEP 26,742 28,915 29,933 28,195 27,531 -664 -2% -1,384 -5% 789 3%
West Midlands 177,017 194,979 186,230 180,033 176,672 -3,361 -2% -18,307 -9% -345 0%
England 2,077,174 2,229,865 2,196,421 2,097,119 2,050,719 -46,400 -2% -179,146 -8% -26,455 -1%
South Staffordshire 753 655 948 826 787 -39 -5% 132 20% 34 5%
Stafford 4,563 4,887 5,569 5,327 5,123 -204 -4% 236 5% 560 12%
East Staffordshire 3,343 3,678 4,013 3,838 3,795 -43 -1% 117 3% 452 14%
Lichfield 2,564 2,533 2,751 2,569 2,526 -43 -2% -7 0% -38 -1%
Newcastle-under-Lyme 1,525 1,676 1,904 1,694 1,659 -35 -2% -17 -1% 134 9%
Cannock Chase 2,490 2,657 2,798 2,632 2,509 -123 -5% -148 -6% 19 1%
Tamworth 3,046 3,392 2,747 2,634 2,548 -86 -3% -844 -25% -498 -16%
Staffordshire Moorlands 1,939 2,091 1,502 1,249 1,270 21 2% -821 -39% -669 -35%
Professional Occupations 6,401 7,086 7,732 7,606 7,600 -6 0% 514 7% 1,199 19%
Elementary Occupations 2,359 2,469 3,330 2,839 2,576 -263 -9% 107 4% 217 9%
Managers, Directors and Senior Officials 1,700 1,951 2,041 2,088 2,033 -55 -3% 82 4% 333 20%
Caring, Leisure and Other Service Occupations 2,637 2,685 2,884 2,699 2,610 -89 -3% -75 -3% -27 -1%
Process, Plant and Machine Operatives 2,521 2,234 2,604 2,231 2,087 -144 -6% -147 -7% -434 -17%
Skilled Trades Occupations 2,232 2,632 2,498 2,310 2,356 46 2% -276 -10% 124 6%
Associate Professional and Technical Occupations 5,009 5,625 5,171 4,943 4,898 -45 -1% -727 -13% -111 -2%
Administrative and Secretarial Occupations 2,791 2,986 2,617 2,510 2,545 35 1% -441 -15% -246 -9%
Sales and Customer Service Occupations 1,092 1,247 1,056 969 826 -143 -15% -421 -34% -266 -24%
Staffordshire & Stoke-on-Trent Economic Bulletin – February 2021 Page | 21Notes Claimant Count and ILO Unemployment Definitions The Claimant Count is a measure of the number of working age people claiming benefits principally for the reason of being unemployed, including those claiming Jobseeker's Allowance plus those who claim Universal Credit and are required to seek work and be available for work. ILO unemployment data is obtained from the national Labour Force Survey. The definition for unemployment is those without a job, want a job, have actively sought work in the last four weeks and are available to start work in the next two weeks, or; are out of work, have found a job and are waiting to start work in the next two weeks. Understanding the differences between the Claimant Count and ILO Unemployment According to the UK Claimant Count for May, claimant unemployment increased to 2.8 million and a rate of 7.8% – a rise of 125% in just two months, the fastest rate of growth on record. However, the ILO measure shows that unemployment has remained largely unchanged at around 1.3 million and a rate of 3.9%. Understanding the reasons why there is this difference is important for policymakers trying to determine whether we are currently in the middle of an unemployment crisis or whether this is to come as the Job Retention Scheme (JRS) is gradually withdrawn. The following section tries to explain this incredibly confusing, complicated and often contradictory data. The main reasons for the difference between the Claimant Count and ILO measures include: • The two measures describe different periods – for claimant unemployment, the numbers refer to claimants on a specific ‘count date’ with the last three being 12 March, 9 April and 14 May. Therefore, these are point-in-time estimates, and handily we can compare what the situation was about a week before the crisis (12 March) with how things were two months later (14 May). The ILO measure is a three-month average of survey responses between early February and late April 2020. This means that two months pre-date the crisis, while one month (April) is since the crisis began. However, ONS does release single month estimates (latest available April 2020) which show a drop in employment in April of 320,000 explained almost entirely by fewer people self-employed but only slight increase of 40,000 unemployed. Instead there is a steep rise in ‘economic inactivity’ which is those who are out of work but are not looking and/ or available for work. Staffordshire & Stoke-on-Trent Economic Bulletin – February 2021 Page | 22
•   Difference in measuring economic inactivity/worklessness - the Claimant Count
    measures those who are required to look/be available for work as a condition of benefit,
    while the ILO measure is those who say that they actually are actively seeking and
    available for work. The Labour Force Survey is recording a single-month increase in the
    number of people out of work (unemployed and economically inactive) of 330,000, but
    nearly 290,000 of these people are not looking for work (economically inactive). The
    majority of this rise is people previously self-employed and are either not eligible for, or
    not yet been paid, income under the Self-Employed Income Support Scheme (SEISS).

•   Claimant Count now includes more workers on low-income - In the Claimant Count,
    people with earned income can be counted as claimant unemployed if their earnings in
    the reference month are below a set threshold (£338 per month for a single person, or
    £541 per month for a couple). Before Universal Credit (UC), short-hours working was
    penalised and so these numbers were generally low. However, UC incentivises short-
    hours work, and so we’ve seen a growth in recent years in the number of people treated
    as being unemployed but who have some earnings. The detailed data for UC suggests
    that 190,000 of the 1 million increase between March and April was accounted for by
    working claimants – so around one fifth of the rise.

•   Difference in recording people who are ‘in work’ – in the Labour Force Survey you are
    recorded as in employment even if you have not done any work that week but ‘have a
    job or business that you were away from… (and that you expect to return to)”. Obviously
    this category of workers ‘away’ from work now captures about 9 million people
    furloughed under the Job Retention Scheme (JRS) who are continuing to earn, but it also
    includes people who consider themselves to be employees or self-employed but who
    have no earnings. ‘Real time’ Pay As You Earn data suggests that this may be mainly
    employees, with the number of paid employees falling by 450,000 between March and
    April. This 450,000 could include a large number of people who may have been due to
    start a job in March or April but have been told that they job isn’t available yet and may
    also be people who had very few or irregular hours before the JRS was introduced and
    whom employers have not submitted a JRS claim. These people may be describing
    themselves as being workers with a job that they are away from, rather than as being
    actively seeking a new job.

•   Benefit take-up/eligibility impact on the Claimant Count – given that the claimant
    count only counts those who claim benefit it may be under-stating the growth in
    worklessness. We know that many unemployed people do not claim, and particularly
    young people (usually due to eligibility). Under UC, there have been on average 450,000
    more ILO unemployed young people than claimant unemployed and even if that gap
    narrows in the crisis, as tends to happen in recessions, it’s possible that ILO youth
    unemployment will remain significantly higher than the claimant measure.

Staffordshire & Stoke-on-Trent Economic Bulletin – February 2021                 Page | 23
Summary table outlining the potential estimates for the Claimant Count rise in April
Potential
Proportion of Potential
Labour Force Survey
Claimant Count Number of Potential Reasons for being a Claimant
Categorisation
Change Mar-20 Claimants
to Apr-20
44% 450,000 New Job Starters/PT employees/Self- In Employment - even if not done any
employed with no income claiming work that week but ‘have a job or
Universal Credit not supported by JRS business that were away from… (and
that expect to return to)” – rather than
unemployed
28% 292,500 Self-employed ceased trading or have very Economically inactive - people out
low income claiming Universal Credit (and of work but are not looking for work -
are either not eligible for, or not yet been paid, majority people previously self-
income under the SEISS) employed
18% 190,000 Working part-time low income workers In Employment
claiming Universal Credit
10% 100,000 Potential Redundancies
100% 1,032,500 Claimant Count Increase Mar-20 to Apr-20
• It is hoped that this analysis has provided further clarity as to why we have seen such a
spike in the number of claimants early in the crisis. What is clear is that we have seen a
record fall between March and April in the number of people working and not being
supported by JRS. We have also seen worklessness rising at a faster rate than at any time
before. Although very few of the decline in the numbers ‘working’ had translated into
higher unemployment in April, it is envisaged that this may be the case if people are
unable to get back into work quickly.
• Looking forward, the growth in claims for UC is slowing and so the growth in the Claimant
Count is also likely to slow as well. That said claimant unemployment is currently at the
highest level on record. The main concern now is what happens to many workers as JRS
is gradually withdrawn and it is important that we are thinking now about how to support
people that are made redundant and what policy interventions are needed.
Staffordshire & Stoke-on-Trent Economic Bulletin – February 2021 Page | 24StokeStaffsLEP | The Kickstart Scheme
ABOUT US NEWS EVENTS CONTACT US
CALL OUR HELPLINE: 0300 111 8002
Delivering Growth Enterprise Support
Skills Advisory Panel EU Funding
Our Local Industrial Strategy (LIS)
COVID-19 Business Support Celebrating our Business Heroes
THE KICKSTART SCHEME
SKILLS ADVISORY PANEL
What is Kickstart?
EFFECTIVE WORLD CLASS Covid- 19 is causing all sorts of challenges. It’s a tough time, but the
SKILLS SYSTEM
Kickstart scheme is a great way for businesses and young people in
Advanced Manufacturing & Stoke-on-Trent and Staffordshire to get back on their feet.
Engineering Hub
It’s a £2 billion fund to create thousands of high-quality, six-month
Developing a Workforce
work placements for young people to give them a stepping-stone to
Skills Capital Equipment Fund
future work and the confidence they need for the future.
ESIF ESF delivery programme
Employers are being called on to put forward placements for
APPRENTICESHIP GROWTH
enthusiastic 16 to 24 year olds and get fully funded in return.
Apprenticeship Employer More about the Kickstart Scheme
Recognition Awards
Stoke & Staffordshire
Apprenticeship Graduation
Ceremony
Stoke & Staffordshire Young
Apprenticeship Network (SSYAAN)
Stoke and Staffordshire Employer CLICK HERE FOR EU FUNDING
Apprenticeship Ambassador
https://www.stokestaffslep.org.uk/skilled-workforce/education-trust/kickstart/[26/02/2021 09:05:38]StokeStaffsLEP | The Kickstart Scheme
Network
Ladder for Staffordshire
CAREERS GUIDANCE AND
EMPLOYABILITY
Enterprise Advisors and Employer
Engagement
Schools and colleges
SKILLS ADVISORY PANEL
BOARD How does Kickstart work?
Employers can get funding for their costs to host a young person in a
SKILLS ADVISORY PANEL
EVIDENCE BASE placement for 6 months, as well a training fund of up to £1, 500. It’s all
about helping them to get the skills and get the experience they need
to move onto sustained employment after their placement.
When you offer a work placement, you’re giving a young person facing
real barriers to employment the confidence and skills they need to
start their career. It also means an injection of new enthusiasm,
imagination and innovation into your business.
MORE INFORMATION
Information for employers and how to express an interest for funding
Becoming a Gateway organisation – representing a group of
employers for funding
Information for young people: What KickStart is and how to apply
Information for young people: What to do if you want a skills boost
before you apply
PARTNERS
https://www.stokestaffslep.org.uk/skilled-workforce/education-trust/kickstart/[26/02/2021 09:05:38]StokeStaffsLEP | The Kickstart Scheme
QUICK LINKS CONTACT CAREERS
Home 0300 111 8002 Vacancies
News contactus@stokestaffslep.org.uk RESOURCES
Judges’ Chambers Our People & Partners
County Buildings
Martin Street Governance
Stafford Minutes & Agendas
ST16 2LH
Publication Library
Case Studies
Partner Resources
Annual Reports
Privacy Policy
NEWSLETTER
To sign up for email updates
please enter your email below.
Your email address.
SOCIAL
© STOKE-ON-TRENT AND STAFFORDSHIRE LOCAL ENTERPRISE PARTNERSHIP 2015
s
https://www.stokestaffslep.org.uk/skilled-workforce/education-trust/kickstart/[26/02/2021 09:05:38]You can also read