Packaging in Perspective - Prepared by the Advisory Committee on Packaging Supported by INCPEN, the Packaging Federation and Valpak
←
→
Page content transcription
If your browser does not render page correctly, please read the page content below
Packaging in Perspective
Prepared by the Advisory Committee on Packaging
Supported by INCPEN, the Packaging Federation and Valpak

This publication has been produced to provide facts about the much discussed
subject of packaging recovery and recycling. It aims to provide the public and
others with an outline of what the UK has achieved and what is being done.

It is not generally recognised that businesses have already achieved a great
deal and continue to do much to:
   design more effective packaging
   minimise environmental impact
   increase the amount of used packaging that is recovered and recycled.

Key facts
   10 million tonnes of packaging are used each year to protect all the goods
    purchased by businesses and consumers.
   GDP has risen by 28% in the last 10 years. The amount of packaging has
    risen by only 8%.
   Packaging is less than 3% of all solid waste and 60% of it is recovered and
    recycled each year.
   £1.5 billion has been spent by businesses in the last 10 years to double
    the amount recovered and recycled.
   Government has set industry targets up to 2012 to increase recycling.

2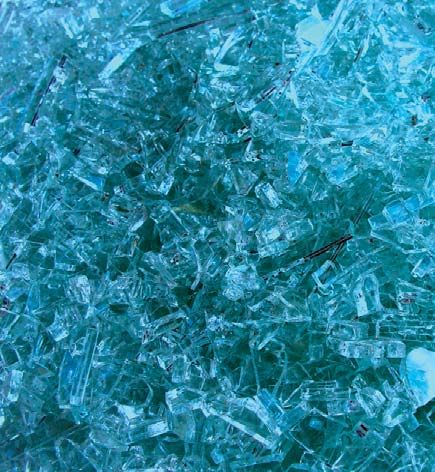
Contents
                                                                                              page

                         Perceptions and Reality                                                       4

                         Packaging Waste                                                               7

                         Facts and Figures                                                         10

                         Packaging and Carbon                                                      16

                         Comparing the UK with other European countries                            20
ACP
Communications           FAQs                                                                      22
Task Force
                         Sources and regulations                                                   26
ACP Chair
John Turner

BERR
Peter Askew

BPI
Andrew Green

Defra
Ian Atkinson            Foreword
INCPEN
Jane Bickerstaffe
                         John Turner, Chair, Advisory Committee on Packaging
Packaging Federation
Dick Searle

Valpak
                       ‘‘ The ACP set up a Communications Task Force to look at how to bring a
                          better balance to the debate about packaging.
Steve Gough              Packaging receives a lot of attention which is out of proportion to its
WRAP                     scale in the overall waste stream and comment is often weighted
Andy Dawe                heavily against this important industry. Packaging is necessary to
                         protect products in the modern world.

                         The Task Force concluded that many of the facts about what has been
                         achieved and what is being done to reduce the environmental impact
                         of packaging were not generally known. This publication is aimed at
                         presenting these facts to bring more balance into the debate.

                         I am indebted to the members of the Task Force for the time spent on
                         preparing this publication.
                                                     ’’
                                                                                                   3
Perceptions and Reality
                                               Perception: Packaging is a major environmental
                                               problem
                                               Reality:      Each household’s annual purchases of products weigh
                                               nearly 3 tonnes, and require 110 GigaJoules of energy to produce. To avoid
                                               wastage of these products and the energy used to produce them, they
            3000kg                             need to be protected so they safely survive the stresses and strains of
          annual purchases                     being transported from farm and factory through to the shops and
                                               then to consumers. Less than 200 kg of packaging does this job and the
                                               energy used to make the packaging is just 7 GigaJoules – or one
                                               fifteenth of the energy used to produce the goods.
                             200kg
                         packaging required    Food wastage in developing countries can be as high as 50%; thanks
                        to protect purchases   mainly to packaging only 3% goes to waste before it reaches the shops
                                               in the UK.

30%
                                               Perception: There is too much packaging
                                28%            Reality: Packaging is a cost to industry so there is a commercial
                                               incentive to keep it to a minimum. The amount of packaging on the
                                               vast majority of individual products has gone down over the last twenty
20%                                            years but consumers now buy far more products so the total amount
                                               of packaging used has gone up, though at a much slower rate than
                                               household expenditure or GDP. Between 1998 and 2007 packaging grew
                                               by less than 8% (8.7 million tonnes to 9.4 million tonnes, excluding
10%                                            wood) but GDP rose by 28%.
              8%

                                               Perception: Nothing is being done to encourage
                                               packaging minimisation
      Packaging                GDP
      (% increase weight)    (% increase)      Reality: There are European and UK laws that require
                                               manufacturers to help fund recycling of used packaging and to use the
                                               minimum amount of packaging with financial penalties for non
                                               compliance. Government, retailers and manufacturers, and industry
                                               associations are working with Councils to ensure these laws are
                                               applied and enforced effectively.

      4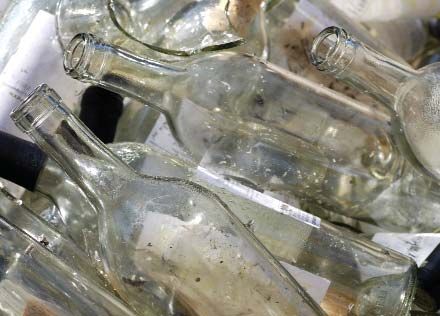
Perception: More packaging should be recycled
                                 Reality: Over 60% of all packaging – from industry, commerce and
                                 households – is recovered and recycled. £1.5 billion has been paid by
                                 manufacturers and retailers in the last ten years to increase the
                                 recovery and recycling of packaging from 3 million tonnes to 6 million
                                 tonnes a year. Government and industry are working together to
                                 increase this further, with the help of consumers.

                60%
             packaging           Packaging’s contribution to society
              recycled           Without packaging:
                                  Consumers could not live the way they do today. Worldwide, more

                                   people now live in urban than rural environments. Food and other
                                   goods are therefore made at some distance from where they are
                                   consumed – packaging is needed to ensure they survive the journey
                                   from production to consumption.
  30%               50%
  drive to shops/   food            No liquids, gels or powders would be available.
  storage/cooking   production
                                    Fruit and vegetables would not be available out of season.
                                    Consumers would have to grow their own food or shop daily for it.
                                    The environmental damage from broken goods and spoiled food
                                     would be enormous.
                                    Food waste has at least ten times the environmental impact of
                                     packaging waste and that’s before taking account of the impact of
10%                                  methane from decayed food.
transport/                          Of the total energy used in the food chain, 50% is used in food production,
retailing
                                     10% on transport to the shops and retailing, 10% to make the packaging and
              10%                    the remaining 30% is used by shoppers to drive to the shops and store and
              packaging              cook food.

                                                                                                             5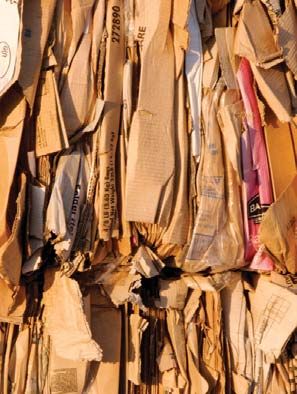
Packaging contains, protects, preserves,
                          promotes, carries information – and
                          reduces costs
                             Food and other goods have to be protected and contained on their
                              journey from farm or factory via warehouses and shops until they
                              arrive at consumers’ homes.

Fresh for 14 days            Roughly 10 million tonnes of packaging are used each year, of which
                              4.7 million tonnes is the sales packaging that protects the 100 billion
                              items bought each year by UK households.
                             In addition to containing and protecting goods, packaging has to
                              perform a wide range of other roles including carrying an increasing
                              amount of information, much of which is required by law; being easy
                              to open and re-close; tamper-evident and child resistant and
                              dispensing products.
                             An unwrapped cucumber loses moisture and becomes dull and
                              unsaleable within 3 days. Just 1.5 grams of wrapping keeps it fresh
Grapes in-store wastage       for 14 days. Selling grapes in trays or bags has reduced in-store
                              waste of grapes by 20%. In-store wastage of new potatoes reduced
DOWN by 20%
                              from 3% when sold loose to less than 1% after specially designed
                              bags were introduced.
                             Even fruit and vegetables that are sold “loose” need packaging to get
                              from the farm to the shop and a bag of some sort to get them home.

New potatoes
in-store wastage
DOWN to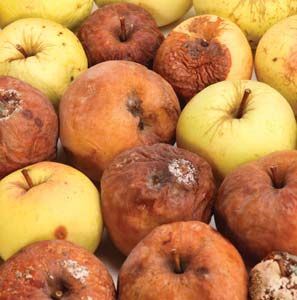
Packaging Waste
Packaging from all sources (industrial, commercial and household)
23 kg
is less than 3% of waste sent to landfill, measured by weight or volume.
waste
per week 60% of packaging from industry and households is recovered and
recycled.
Each household generates 23 kg of waste each week (recyclables and
residual waste) of which 4 kg (18%) is packaging.
Household waste is 9% of all solid waste generated. Household
packaging waste is therefore less than 2% of all solid waste.
Dustbins might look full of packaging because empty bottles, pots,
tubs and trays are full of air and take up a lot of space but these
18% containers are necessary to enable food and other goods to be safely
delivered. Most packaging is essential and the majority of it can be
recycled. Even if it isn’t recycled, it will be squashed in landfill to a
4 kg
tiny fraction of its original volume.
packaging
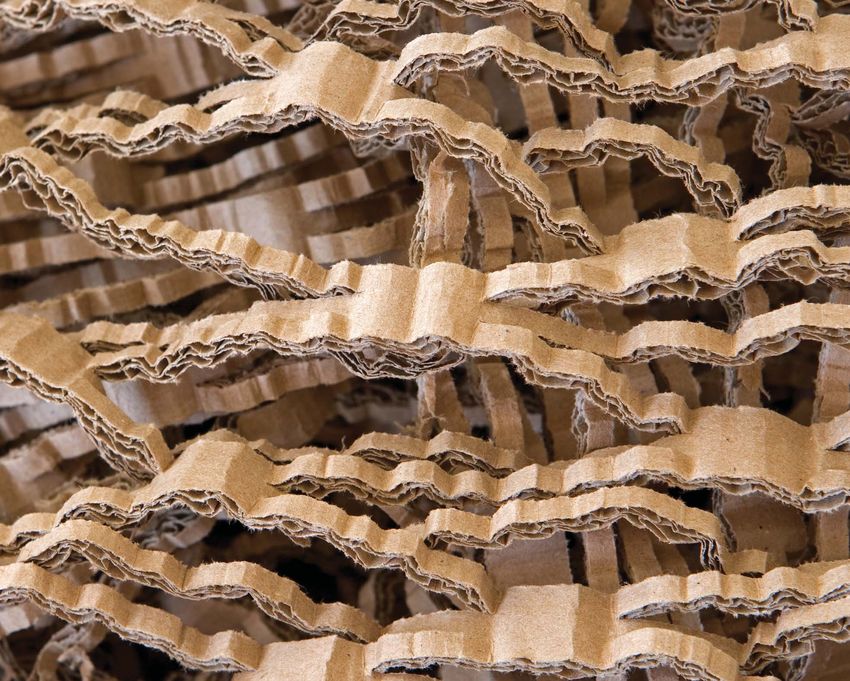
Packaging recovered and recycled
Most local authorities provide collection schemes for recycling the
majority of used household packaging – typically bring-banks and/or
kerbside collection for glass bottles and jars, cardboard, food and
drinks cans and plastics bottles. Some collect other things so it is
important to check locally what each local authority wants.
Some packaging can be left in with the mixed waste. In an increasing
number of areas energy will be recovered from the packaging in
energy-from-waste plants.
The UK compared with other European
countries
The UK uses less packaging per person than most other large EU
countries – less than Denmark, France, Germany, Ireland, Italy,
Netherlands, Spain.
The UK recycles more packaging waste than many other EU
countries – more than Finland, France, Greece, Italy, Portugal,
Spain, Sweden.
7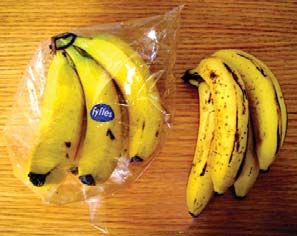
Challenges for industry
       Increase efforts to design product and packaging systems that
        minimise the use of materials, energy and water and minimise the
        environmental impact throughout the product lifecycle.
       Provide food and other goods in a wide range of portion sizes to suit
        the needs of different lifestyles and preferences.
       Design all packaging to be resource-efficient.

        – Design for recycling if an infrastructure is in place to collect, sort
          and clean the packaging in a way that will yield a net gain in
          resources.

        – Recycling does not currently make sense for packaging made from
          thin layers of mixed materials or plastic film because it requires
          more resources to collect and clean it than can be recovered. This
          sort of packaging has environmental advantages by allowing more
          product to be packaged onto one delivery vehicle which means
          less traffic and lower fuel use. At the end of its life energy can be
          recovered from it.
       Provide clear, reliable information to consumers and other
        stakeholders
       Continue to work together with local authorities and compliance
        schemes to fund increased availability of collection facilities.

8
Challenges for consumers
   Choose products in a type of packaging to suit requirements
    eg a bag of apples to make a pie, a “loose” single apple for lunch, a
    pack of four in a wrapped tray for the household fruit bowl.
   Support local recycling schemes.
   Think about:
    – Could the product have got to the shop without packaging?
    – Could it have been transported home without packaging?
    – Will it keep in good condition for as long as it needs to be stored?
   If a product seems to be excessively packaged:

    – Contact the retailer or manufacturer
    – Call or go on-line to Consumer Direct – 08454 04 05 06
      www.consumerdirect.gov.uk
    – Call or go on-line to www.recycle-more.co.uk

Challenges for government
   Ensure that policy on packaging enables businesses to respond to
    the varied needs of society with minimal environmental impact.
   Examine the options for increasing opportunities for consumers to
    recycle more.
   Provide training for local authorities to help all of them operate
    packaging collection schemes to the best practice standards.
   Set stretching targets for all stakeholders to ensure continued
    progress towards recycling more packaging.
   Encourage the development of a society that accepts recovery and
    recycling of waste as an everyday activity.
   Fund research into best practice for design, manufacture,
    distribution and recovery of packaging.
   Encourage collection and sorting methods to deliver high quality
    recyclables.

                                                                         9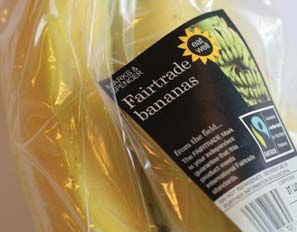
Facts and Figures
           Amount of Packaging Used
           The amount of packaging used in the UK has increased between 1998
           and 2007 by less than 8% (8.7 million tonnes to 9.4 million tonnes –
           excluding wood).

           In the same period, GDP rose by 28%                  (source: National Statistics).

           Population and economic activity has increased and therefore more
           products have been bought by consumers. Despite this, the total
           amount of packaging has increased at a much slower rate because
           companies have reduced the amount of material in each pack.

           UK Packaging Waste Generated
           Thousand tonnes                         1998        2001         2005          2006    2007

           glass                                 2,200        2,200        2,500        2,600     2,650

           plastics                              1,700        1,679        1,901        2,080     2,121

           metals                                   844         970           827          825      823
            (steel)                                                                      (683)    (679)
            (aluminium)                                                                  (143)    (144)

           paper and board                       4,000        3,855        3,726        3,763     3,801

           Total (ex wood and other)              8,744       8,604        8,954         9,268    9,395

           Wood                                  1,300          670        1,404        1,180     1,192

           Other                                                               22            23      23

           TOTAL                                 10,044       9,274       10,380         10,471   10,610

           Source: DEFRA (2007 figures from Consultation on recycling
           targets for packaging 2008 and thereafter, October 2007)

           The above table shows packaging used for industrial, commercial and
           household products. The Government’s Waste Strategy 2007 produced
           an estimate of the split between commercial and industrial, and
           household sources. For 2005 data, it showed that 44% of packaging ends
           up at households and 56% in industrial and commercial waste streams.

10
Packaging arising in UK Household and
Commercial/ Industrial waste streams
Commercial and
2005 total household stream
industrial stream
thousand tonnes thousand tonnes percent thousand tonnes percent
paper 3,726 931 25% 2,794 75%
glass 2,500 1,875 75% 625 25%
aluminium 142 134 95% 7 5%
steel 686 480 70% 206 30%
plastics 1,901 1,217 64% 685 36%
wood 1,404 0 0 1,404 100%
other 22 22 100% 0 0
Total 10,380 4,660 44% 5,720 56%
Source: Waste Strategy 2007
If this split still applies, (which is likely) this means that households
generated 4.7 million tonnes of used packaging in 2007.1
The role of packaging Product types purchased by
average household
in protecting products
type of product number of products
and preventing waste purchased (percent)
The average UK household is 2.3 people, 0.4 cats food and drink 66
and 0.3 dogs. In a year the average household
education, leisure, transport 19
buys over 4,300 items.
clothing and personal care 11
This means that the UK’s 26 million households
buy over 100 billion products each year of which home and interior 4
66% are food and drink.
(Source: Dr J M Kooijman for INCPEN,
derived from UK Family Expenditure Survey)
1 A figure of 5.9 million tonnes is sometimes used but this is derived from analysis of packaging waste (Source: Government agency WRAP – the
Waste and Resources Action Programme, based on local authority waste composition studies of household and civic amenity waste and waste
data flow information).
Note that the WRAP estimate will include moisture, residual product and contaminants. Level of contaminants varies per material. In 1991 a 11
major survey of contamination levels carried out by Government agency, AEA Technology concluded that on average across all waste packaging
materials, 14% was moisture and contamination. Applying this to the estimate of 5.9 million tonnes gives 5.1 million tonnes of actual material.Packaging Pyramid
Hampers
Fragrance Fragrance The packaging for most everyday items is extremely
Footwear
Mobile Phone
Mobile Phones and Accessories
Home Enhancement
Car Accessories
& Accessories efficient. However, there are concerns about
Pet Care
Sports Equipment
Furniture
excessive packaging. Often this is packaging for
Art, Craft & Stationery
Towels/Linen
Party / Occasions
Yearly luxury and gift products where the giver wants
Garden 3% Easter Egg
Easter Egg
Bottled (gl) alcoholic drinks gift box Bottled (gl) alcoholic the packaging to be special and these products
Small Electrical drinks gift box
Home Accessories
Books
Haberdashery
Small Electrical are typically seasonal or purchased
Travel
Computer Consoles
Optical Care
Computer Consoles infrequently. Nevertheless, there are also
Clothing accessories
Multimedia – Boxsets
Photography Goods
Computer Games & Accessories
Multimedia – Boxsets some examples of products that really are
Computer Games & Accessories
Herbs and Spices
Baby Accessories
Electrical Accessories Monthly
over-packaged and should be improved.
Cleaning Accessories 18%
Large Electrical Large Electrical
Clothing
Toys Toys
Dental products
Cooking & Baking The pyramid shows the amount of
Cleaning
Sauces (Jams, condiments, cooking)
Cheese
Dry Pasta / Noodles / Rice
packaging for 73 product
Frozen Fruit/Vegetables
Soup
Frozen Meat/Fish
categories grouped by the
Medicine
Frozen Desserts
Desserts
Weekly approximate frequency of
Cereals 18%
Toiletries/Cosmetics
Pet Food
Tea/Coffee
purchase. The items
Canned Food
Supermarket Misc
Deli highlighted in yellow are
Newspapers/Magazines
Organic Fruit/Vegetables
Confectionery multipack
Organic Fruit / Vegetables
Confectionery Multipacks
those that are sometimes
Snacks
Tobacco
Butter
Eggs
considered to be
Bread
Baby Food
Canned non-alcoholic drinks
Daily
61%
excessively packaged.
Bottled (gl) non-alcoholic drinks
Yoghurt
Drinks Carton
In total these account
Canned alcoholic drinks
Fresh Fruit/Vegetables
Fresh Meat/Fish for less than 3% of
Confectionery
Ready Meals
Milk
Bottled (pl) drinks
all used household
Bottled (gl) alcoholic drinks
packaging.
Actual and perceived Each household’s annual purchases weigh nearly 3 tonnes, and require
excessively packaged 110 GJ of energy to produce. To avoid wastage of these materials and
products. energy, they need to be protected so they safely survive the stresses
Products listed by and strains of being transported from farm and factory through to the
likely frequency of shops and then home. Less than 200 kg of packaging does this job. The
purchase. energy used to make the packaging is 7 GJ.
Source: Valpak
Of the total energy used in the food chain, 50% is used in food production,
10% on transport to the shops and retailing, 10% to make the packaging and
the remaining 30% used by shoppers to drive to the shops and store and
cook food.
12As well as making environmental sense, it is in companies’ commercial
interest to use as little packaging as possible. The following table
shows examples of packaging reduction over the years.
Packaging Reduction Examples
1950s 1960s 1970s 1990s 2000 2008 percent
change
washing-up liquid
120g 67g 50g 43g 64%
bottle 1 litre
soup can
90g 69g 57g 55g 49g 46%
400g
yogurt pot
12g 7g 5g 4g 67%
165g
plastics fizzy
58g 43g 40g 31%
drinks bottle 2litre
metal drinks
60g 21g 15g 14g 77%
can 330ml
glass beer bottle
450g 325g 176g 61%
275g
glass milk bottle
538g 397g 230g 186g 65%
1 pint
Source: INCPEN
Consumers are usually unaware of the various roles that packaging plays
in containing, protecting and preserving products, carrying vital
information, enabling easy use and helping them reduce their
environmental footprint.
Packaging for food prevents wastage of the significant resources that go
into growing, harvesting and transporting it. According to the Government,
UK consumers typically waste as much as 30% of the food that they buy.
Packaging plays a key role in preventing more waste.
In addition to reducing waste, packaging also provides protection from
contamination, which is particularly important for food that is often eaten
raw or straight from the pack.
13Cucumber
A cucumber is 96% water which it begins to lose as soon as it is picked.
After 3 days, it has lost so much water that it becomes dull, limp and
unsaleable. Wrapping it in just 1.5 grams of plastic film extends its
shelf life to 14 days and it lasts longer at home. (Source; Cucumber Growers Association)
Grapes
Traditionally grapes were sold in loose bunches in an open tray from
which the consumer selected and paid by weight at the checkout.
Some of the grapes inevitably fell off and would be discarded by the
shop. Any that fell on the floor were potentially hazardous if slipped on.
Grapes are now sold either in bags or sealed trays so that the loose
ones stay with the bunch and are sold and there’s no danger of
slipping. This has reduced waste in store typically by over 20%.
Prepared salads
Prepared salads typically contain three or four varieties of washed,
cut, ready-to-eat salad leaves in a bag specially designed to contain a
modified atmosphere which keeps the leaves fresh and extends their
shelf life. Without the bag and its modified atmosphere the edges and
stalks would quickly go brown.
If consumers bought individual lettuces to create the same mixture at
home, eleven times the amount of salad would be produced at four
times the cost and there would be five to ten times more waste.
Modified atmosphere bags make a significant contribution to reducing
food waste.
Bananas
Bananas have their own natural packaging: their skins. That makes
people think further wrapping in a plastic bag is wasteful and
unnecessary.
However, large amounts of bananas over-ripen and are thrown away.
WRAP (Waste and Resources Action Programme), a Government Agency,
reports that UK consumers throw away 1.6 million bananas a day.
14Wrapping in a modified atmosphere bag greatly reduces waste
because the bag:
absorbs the ripening substance, ethylene, that bananas give off,
extending shelf life by 2-3 days so fewer fruits become waste.
prevents the ethylene affecting other nearby fruit and vegetables,
stopping them ripening too quickly and going to waste.
prevents shoppers breaking bunches up, which bruises the fruit and
Bunches of identical bananas stored which leaves odd bananas that are unsold and get wasted.
for 7 days loose and in a modified
atmosphere bag
Avoiding waste of fruit helps keep costs down. Labels on the bags
also help consumers distinguish organic and Fair Trade bananas
(sticky labels often become loose).
Potatoes
If potatoes are sold loose, on average 3% are wasted in store because
of deterioration on exposure to light – they go green, and put out
shoots. New potatoes are particularly prone because they have thin
skins. Green potatoes contain glycoalkaloids which may cause food
poisoning and which are not destroyed by cooking.
If they are packed in a modified atmosphere plastic bag, their shelf life
in store is extended by 3 days.
A survey carried out with a large grower and major supermarket
showed that in-store wastage reduced from 3% for potatoes sold loose
to under 1% after modified atmosphere bags were introduced.
Wastage of potatoes at home is generally due to greening and
sprouting, which is why they should be kept in the dark. WRAP
estimates that 5.1 million potatoes are thrown away each day.
As early new potatoes are typically expensive, and air freighted, there
are cost and climate change benefits too (fewer replacement
deliveries are needed if there is less waste).
15Packaging and Carbon
Good packaging is packaging that protects products throughout their
journey from farm or factory to the final end user with minimum
environmental impact and minimum waste from product and used
packaging.
Packaging has to be considered alongside the product and how it will
be used. Sometimes it makes sense to use more packaging if, as a
CO2 emissions
from cooking result, the overall carbon footprint of the product is reduced.
For example, a 100g serving of chips can be bought in a box (weighing
19 grams) for cooking in a microwave oven or it can be taken from a
CO2 bag of frozen chips, where the packaging for that serving is much less
– just 1.2 grams. However the carbon dioxide emissions from cooking
the frozen chips in a regular oven are 10 times higher than the
emissions from the microwaved ones. (Note that this is only a partial
assessment but it shows that assessing packaging on just one factor
Oven Chips is not sufficient. It is important to take account of the materials, water,
452g energy, carbon used at all stages of the life of the product and its
packaging.)
Microwave Chips
41g
Single portion of chips from microwave pack
versus bag of oven chips
microwave chips oven chips
packaging weight 19g 1.2g
CO2 emissions from cooking 41g 452g
More packaging but less climate change impact
Source: INCPEN
16Packaging Recovery and Recycling
The Packaging and Packaging Waste Directive was adopted in Europe
in 1994, and is covered by two UK laws, see page 26. Over 60% of all
packaging – from industry, commerce and households – is currently
recovered and recycled. £1.5 billion has been paid by manufacturers and
retailers in the last ten years to increase the recovery and recycling of
packaging from 3 million tonnes to over 6 million tonnes.
Packaging Recovery and Recycling
2006 1998
sent for recovery recovered recovered
and recycling and recycled and recycled
thousand tonnes percent percent
paper 2,910 77% 47%
glass 1,303 50% 23%
aluminium 47 33%
23%
steel 391 57%
plastic 456 22% 7%
wood 845 72% 13%
total recycling 5,952 57% 28%
energy recovered 475 5%
total recovery 6,427 61% 33%
Source: DEFRA (1998 figures provided by UK to European Commission)
Most local authorities provide collection schemes for recycling the
majority of used household packaging – typically bring-banks and/or
kerbside collection for glass bottles and jars, cardboard, food and
drinks cans and plastics bottles. Some collect other items so
consumers need to check what their local authority wants.
In order to demonstrate that they have met their obligations to
contribute financially to the recovery and recycling of used packaging,
companies have to purchase Packaging Recovery Notes (PRNs). Most
companies belong to compliance schemes which buy PRNs on behalf
of their members.
17The country’s largest compliance scheme, Valpak, has estimated that
33% of the PRNs issued in 2006 contributed to recovery and recycling of
household packaging.
Household Packaging recycled
2006 Total PRNs Household Household
thousand tonnes thousand tonnes percent
glass 1,440 1,160 81%
aluminium 45 23 50%
steel 370 100 27%
plastic 460 150 33%
paper 2,785 225 8%
total 5,100 1,658 33%
Source: Valpak
Used Packaging in the context of all waste
Data on all waste should be used with caution. It is not collected
routinely or on a UK basis. According to DEFRA, waste arisings in
England in 2006/2007 were 285 million tonnes per annum. 90% of this
waste is non-municipal, roughly a third from construction and
demolition, a third from mining and quarrying activities2 and a quarter
from commercial and industrial sectors.
Total municipal waste in 2006/7 in England was 29 million tonnes – of
which 89% (26 million tonnes came from household sources).
Grossed up by population (England 49 million; UK 58.7 million)
household waste generated throughout the UK is 31 million tonnes. In
rounded numbers, household packaging is 5 million tonnes which equates
to 16% of household waste.
18 2 Not classified as a controlled waste under the Environment Protection Act
(Controlled Wastes) 1992Annual waste arisings Agriculture Sewage sludge
Dredged
England materialComparing the UK with other
European countries
Between 1997 and 2005, the average annual increase in the amount of
packaging placed on the market in the 15 “old” EU countries was
2.2%; in the UK it was 1%. The average annual growth in GDP over the
same period was 3.9%.
The overall EU packaging recycling rate increased by 11%. Largest
increases were Ireland – from 15% to 56% and the UK – from 24% to
54%. Germany’s recycling rate has fallen by 12% (from 80% to 68%).
Packaging recycling rates
80
80%
68%
60
56%
54%
40
20 24%
15%
1998 2005 1998 2005 1998 2005
0
Ireland UK Germany
20Amount of Packaging Packaging Recovered Packaging Recycled
used in 2005 1998 and 2005 1998 and 2005
Kg per Recovered Recycled
person percent percent
2005 2005 1998 2005 1998
Greece 90 Belgium 93 73 Belgium 77 64
Finland 91 Netherlands 92 84 Germany 68 80
Sweden 117 Denmark 90 89 Austria 67 65
Austria 123 Luxembourg 88 51 Luxembourg 63 42
Portugal 130 Germany 87 81 Netherlands 59 62
Belgium 138 Austria 85 70 Ireland 56 15
UK 147 Finland 68 55 UK 54 28
Italy 156 Italy 65 34 Italy 54 32
Germany 158 France 64 56 Denmark 53 50
Spain 158 UK 61 33 France 53 42
Denmark 158 Ireland 59 15 Spain 50 34
France 162 Sweden 56 82 Sweden 48 75
Netherlands 172 Spain 56 37 Portugal 44 35
Ireland 183 Portugal 51 35 Finland 43 45
Luxembourg 189 Greece 42 35 Greece 42 35
average EU 145 average EU 70 54 average EU 57 47
Source: EU Commission Source: EU Commision Source: EU Commision
21FAQs
Why is there so much packaging?
Most packaging is designed to use the minimum amount of material to get
goods and food safely from the farm or factory into people’s homes, and to
other industrial and commercial users, in prime condition. As well as
protecting goods and preserving food, it has to carry information about the
product and ensure it is safe and easy to use. Manufacturers are continuously
improving and reducing their packaging because it cuts their costs and
reduces environmental impact.
A very few items are excessively packaged and the industry encourages the
regulators to get rid of them. Some toys, for example, are not just excessively
packaged but are difficult to open. Most of these are made in the Far East for
a global market so all countries need to put pressure on the manufacturers
to improve.
Why aren’t things sold “loose” without packaging?
Consumers can choose to buy some products loose, eg fruit and vegetables,
delicatessen foods. It’s up to them to choose based on what suits their lifestyle
and how long they want the food to last. For example, a cucumber doesn’t
need packaging if it is picked for consumption that day. If it is kept for longer,
1.5 grams of thin plastic wrapping extends its shelf life from 3 to 14 days and
keeps it fresh for longer at home.
Many products would simply not be available without packaging. Drinks,
other liquids, gels and semi-solid items like paint have to be contained. Most
products need packaging to maintain their quality and condition and they all
need it to get products to the shops even if they don’t have packaging on them
when they are displayed.
Why do consumers have to pay for packaging twice –
at the checkout and for its disposal?
They don’t. Like delivery lorries, packaging is part of the system for getting
products to the shops. Without packaging, many foods and other goods would
not be available. All goods would be more expensive to compensate for the
high levels of waste from damaged goods and spoilt food.
Like old trainers, potato peelings, fish skins, uneaten food, junk mail and
everything else that ends up in municipal waste, consumers pay through
Council tax for waste collection and disposal – a service that is provided
primarily for public health reasons. Waste collection and disposal costs
depend on the amount of labour and vehicles used as well as the amount of
waste. Even if a household generates no waste, most of the costs are still
incurred because the service is still provided.
The cost of packaging depends on the amount of protection that a product
needs and how it is retailed. Products sold packaged sometimes cost more
than equivalent ones sold loose. This covers the extra cost of the packaging
and the labour needed to select and pack them but damage and wastage
in-store and at home is lower. On the other hand, the cost of sliced ham from
22a delicatessen counter is usually higher because of the labour to slice and wrap
and because more packaging is used to wrap any unsold ham every night. More
ham goes to waste because it does not last as long as packaged ham.
Why don’t companies use less packaging?
up to 50% They try to use the minimum amount because packaging costs them money
50
and because the Essential Requirements law requires that they do. A process
of continuous improvement and lightweighting has been happening for many
40 years and will continue in the future.
30 What would happen if there was no packaging?
Modern society would not be able to exist. In 2008, for the first time ever, more
20 people worldwide live in urban rather than rural environments. This means
that food and other goods have to be made at some distance from where they
are consumed. Packaging is needed to ensure the goods survive the journey
10
from production to consumption.
3% Food wastage in developing countries can be as high as 50%; by contrast in
0 the UK only 3% goes to waste before it reaches the shops.
Developing UK
countries Why is so much packaging used just to sell products?
Packaging is used for marketing and promoting brands alongside all its other
functions. The Essential Requirements law requires that the minimum is used
and it allows companies to use an appropriate amount for marketing
purposes.
Is there more and more packaging?
Since 1998 the UK population and the number of single-person households
waste have grown and GDP has increased by 28%. Consumers have therefore bought
more products. Despite this, the total amount of packaging has increased by
less than 8%, mainly as a result of companies reducing the amount of material
in each pack.
What should consumers do with packaging after it has been
emptied?
Support their local council’s waste collection and recycling schemes. To check
Recycling energy what can be recycled in specific areas see www.recyclenow.com and
recovery www.recycle-more.co.uk
Other packaging should be left in with the mixed waste. In an increasing
number of areas energy will be recovered from it in energy-from-waste plants.
23Why are households’ dustbins so full of packaging?
Government figures show that packaging is 18% of the weight of household
1.2 million waste. Consumers can reduce the amount sent for final disposal by separating
out the recyclable items for kerbside collection or to take to recycling centres.
tonnes There is more food waste than packaging in the average household bin.
clothing and Packaging waste has been reducing over the last 20 years unlike waste from
newspapers, junk mail, food and clothing which have been growing. According
textile waste to the Defra-funded Centre for Remanufacturing and Reuse, clothing and
textile waste is the fastest growing household waste stream with 1.2 million
tonnes ending up in landfill each year.
Demolition
and
construction
Why is packaging such a large proportion of waste?
32% It isn’t. According to Defra, industrial, commercial and household packaging is
less than 3% of the waste that goes to landfill. Household packaging is 1.5% of
all waste arisings. Demolition and construction is 32%, industrial 13%,
Others
35% commercial 11%, household 9% and others 35%.
Is doing something about packaging more important than global
warming?
Household No. The average household buys 4,300 items a year. These are protected by
packaging 1.5% 190 kg of packaging. Packaging is typically 9% of the weight of the packaged
Industrial product and uses on average 8% of the energy used in the production and
Household 13%
9% Commercial delivery of products.
11% Use of cars, home heating and hot water and use of appliances account for
53% of a household’s energy. Energy used to make packaging represents just
3%.
Household energy use
Are the recyclables that councils collect actually recycled?
3%
2% supply packaging All separated recyclable materials are sent to sorting centres and then sold to
chain transport 15% reprocessors for turning into new materials. Some recycled materials are
and retailing use of cars used for other goods and some for packaging. Packaging manufacturers have
a long history of using recycled materials eg over 80% of the material in
cardboard boxes has been recycled.
Why is some packaging waste exported to the Far East and is it
recycled there?
Far fewer products are made in the UK today than even ten years ago. Many
are imported from the Far East so that is where the demand for materials and
42% recycled materials is greatest. If the ships bringing packaged electronics from
production of the Far East did not take the old boxes back for recycling, they might well go
38%
goods and food home heating, back empty. There is a legal requirement that recycling that is done abroad is
hot water, done to standards equivalent to those in the UK.
use of appliances
24Why isn’t all packaging recyclable or compostable?
Packaging is designed first and foremost to protect products throughout the
supply chain. Manufacturers also have to design it so that it can be reused,
recycled or energy recovered from it after use.
Packaging is recycled if it can be collected, transported and cleaned using
less energy and resources than would be used to make virgin raw materials.
In areas where councils compost waste, dirty paper and board can also be
composted.
Some packaging, especially lightweight mixed material packs, which often
contain food residues, are not currently worth recycling because it takes more
energy and resources to do so than is recovered. However, this sort of
packaging often has environmental benefits earlier in its life because it is less
bulky and therefore fewer lorries are needed to deliver products, saving on
fuel used for transport. Value can still be recovered from it in – the increasing
number of – areas where councils have energy from waste plants.
Kerbside collection, bottle and can banks and recycling centres exist for
over 85% of packaging – glass, metals, paper and board and plastic bottles.
Composting often generates methane which has over twenty times the climate
change impact of carbon dioxide, so compostable packaging is not always a
better choice.
Does burning packaging waste increase global warming?
Energy generated from waste replaces the use of fossil fuel. Biodegradable
waste decomposes in landfill and gives off methane which is over twenty
times more powerful as a greenhouse gas than carbon dioxide. Energy from
waste plants have to conform to stricter pollution controls than regular
power generating plants. The UK has caught up with Europe on recycling
but is still behind on energy from waste. The government’s waste strategy is
addressing this.
The EU countries with the highest recycling rates also have high rates of
energy recovery from waste.
Does the UK use more packaging than anyone else in Europe and
recycle less?
No, the UK is roughly in the middle. In 2005, the European average for all
packaging put on the market was 145kg per person; the UK was 147kg.
The European average recycling rate was 57%; the UK was 54%.
25Sources Regulations
ACP – Advisory Committee on Packaging The Packaging & Packaging Waste Directive 94/62/EC was
adopted at the end of 1994 and subsequently amended by
AEA Technology – www.aeat.co.uk Directive 2004/12/EC. It was introduced to prevent European
BERR – Department of Business, Enterprise and Regulatory Member States from implementing measures that would
Reform www.berr.gov.uk discriminate between types of packaging and / or result in
restricting free trade of goods within the European Community.
British Glass – www.britglass.org.uk http://ec.europa.eu/environment/waste/packaging/legis.htm.
British Plastics Federation – www.bpf.co.uk In the UK it has been implemented by the following two laws:
Confederation of Paper Industries – www.paper.org.uk
The Producer Responsibility Obligations (Packaging Waste)
DEFRA – Department of Environment, Food and Rural Affairs Regulations 2007 (S.I. 2007 No. 871).
www.defra.gov.uk http://www.defra.gov.uk/environment/waste/topics/packaging/
index.htm.
Environment Agency – enforces the Producer Responsibility
Obligations (Packaging Waste) – www.environment- Most EU countries have adopted a “Green Dot system” to
agency.gov.uk implement the Directive’s recovery and recycling targets.
The UK has taken a “shared approach” where companies in all
INCPEN – Industry Council for Packaging and the Environment parts of the supply chain – raw material suppliers, packaging
www.incpen.org manufacturers, product manufacturers and retailers – take a
share of the financial obligation to meet the targets. Most
LACORS – coordinates Trading Standards Officers who enforce companies belong to one of roughly 20 “compliance schemes”
the Packaging (Essential Requirements) Regulations – which operate on behalf of their members to comply with the
www.lacors.gov.uk Regulations. The Regulations apply to all companies that handle
more than 50 tonnes of packaging a year and have a turnover in
LARAC – Local Authority Recycling Advisory Committee
excess of £2 million a year.
www.larac.org.uk
It is monitored through an online system developed between
LGA – Local Government Association www.lga.gov.uk industry and government known as the National Packaging
Metal Packaging Manufacturers Association – www.mpma.org.uk Waste Database. This unique development was designed and
installed in record time and has greatly improved the monitoring
Packaging and Films Association – www.pafa.org.uk of the process and reduced cost.
PRAG – Packaging Recovery and Recycling Action Group Companies have spent £1.5 billion in the last 10 years to
support recovery and recycling. Government funds have directly
Valpak – the largest UK compliance scheme for packaging supported research into new end markets for recyclables,
recovery www.valpak.co.uk training programmes, identification of best practice and other
investigations.
WRAP – the Waste and Resources Action Programme
www.wrap.org.uk The Packaging (Essential Requirements) Regulations 2003
(S.I. 2003 No. 1941), as amended by the Packaging (Essential
Requirements) (Amendment) Regulations 2006 (S.I. 2006 No.
1492). http://www.opsi.gov.uk/si/si2003/uksi_20031941_en.pdf
and http://www.opsi.gov.uk/si/si2006/uksi_20061492_en.pdf.
BERR (2007), Packaging (Essential Requirements) –
Government Guidance Notes.
http://www.berr.gov.uk/files/file36659.pdf .
These Regulations require companies to ensure that their
packaging is designed to be fit for purpose and is the minimum
weight and volume needed for safety, hygiene and consumer
acceptability. The packaging may be reusable and it must be
capable of being recovered through at least one of material
recycling, incineration with energy recovery or composting and
biodegradation. The combined concentration of cadmium, mercury,
lead and hexavalent chromium must not exceed 100 ppm.
26INCPEN – the Industry Council for Packaging and the
Environment is a research organisation established in
1974 to study the environmental and social impacts of
packaging. It draws together an influential group of
companies that operate throughout the supply chain, The Packaging Federation is the trade association
with a common interest in packaging, the environment for the UK packaging manufacturing industry.
and sustainable consumption and production. www.packagingfedn.co.uk
www.incpen.org
INCPEN Charter
members
Valpak is the UK’s leading provider of compliance
and recycling solutions. www.valpak.co.uk
The Advisory Committee on Packaging was set up by the Environment
Minister in 1996 to advise Government on the drafting of Regulations
implementing parts of the European Directive on Packaging and Packaging
Waste EC/94/62. This group which represents the key players in the
packaging supply chain with Government departments and devolved
administrations in attendance has made a number of important
recommendations for improved operation of the regulations.
ACP Communications Task Force
ACP Chair John Turner
BERR Peter Askew
BPI Andrew Green
© Copyright Advisory Committee on Packaging
Defra Ian Atkinson
First printed October 2008
INCPEN Jane Bickerstaffe
This material may be freely reproduced provided
Packaging Federation Dick Searle the source is credited
Valpak Steve Gough Design: www.jebensdesign.co.uk
WRAP Andy Dawe Printed on recycled stock using soya based inksYou can also read