CHANGE FOR THE BETTER, TIMARU KERBSIDE ORGANIC COLLECTION & COMPOSTING, 7 YEARS ON, 2006-2013: KEY LEARNING'S - WasteMINZ
←
→
Page content transcription
If your browser does not render page correctly, please read the page content below

CHANGE FOR THE BETTER,
             TIMARU KERBSIDE ORGANIC COLLECTION & COMPOSTING,
                   7 YEARS ON, 2006-2013: KEY LEARNING’S.
                      Brian Gallagher – Timaru Manager, Transpacific Waste Management.
                                         Brian.Gallagher@wastemanagement.co.nz
                       Ruth Clarke –Waste Minimisation Manager, Timaru District Council.
                                                 Ruth.Clarke@timdc.govt.nz

       The following paper has been prepared by the presenters and any comments are their personal opinion and may not be
                                      representative of the company or council they work for.

1   Abstract
    Transpacific Waste Management is contracted to the Council to provide the collection and
    processing of the organic waste for a 15 year term until 30 June 2021. With 2013 being half
    way through the contract, this paper provides some of the background information and
    experiences to date.

    In 1999 the people of the Timaru District said “we can’t go on the way we are with our
    current waste disposal and we need to do something about it”. What to collect and how was
    a big challenge for the Council, along with what sort of processing technology to use. Waste
    audits and trials provided likely tonnes to be collected and processed.

    For Timaru, the final option chosen was to provide 3 wheelie bins. Food and garden waste
    being collected weekly, with recyclables and rubbish collected fortnightly on alternate
    weeks. “One size does not fit all”. Extensive consultation was undertaken with the
    community. The community were given a choice on the size and type of containers. For
    organic waste, 91% have a 240 litre bin, 7% have a 140 litre bin with 1% being provided an
    Eco-Cart, which has a 45 litre crate collected weekly. As of September 2013 there are 18,989
    organic bins in service for 18,069 properties, with some having 2 bins. 72% of bins are in
    Timaru with 28% in the smaller rural townships and along collection routes.

    The composting technology chosen for the contract is the “Gore Cover” system. Operation
    of this system has proven to be successful in composting the food and garden waste, as well
    as enabling the site to comply with resource consent conditions. 14,000 tonnes are
    processed annually with a peak during spring to autumn. Transpacific is implementing
    further “Gore” sites in Australia after the successful experience of the Timaru facility.

    An initial issue with raised Arsenic levels in the compost from treated CCA timber and ash
    has been mitigated by a good public education campaign by the Timaru District Council. On-
    going traces of clopyralid in the compost have resulted in the maturation time and area
    being extended. On-going monitoring of bins and updated information and education is
    required to help maintain low contamination levels, which are currently less than 1%.

    A project group was established to develop compost trials which have shown beneficial
    results for yield and savings. The cost to compost is about $100/T +GST compared to landfill
    at $192.50/T. The current cost of the 3 bin service to residents is $318, or $2 per bin/week.
    Waste to landfill from the kerbside collection reduced 63% with the new collection service.

    Satisfaction of the 3 bin service in the Council Survey in 2011/12 was measured at 91%.

                                                                                                              1|P a ge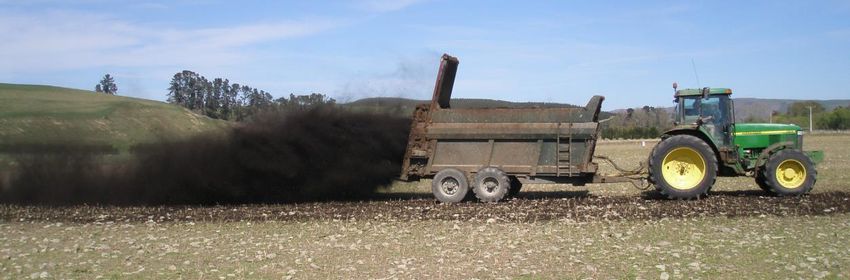
2 The Timaru District
2.1 Geography and Climate
The Timaru District covers 2,737 square kilometres of South Canterbury. Timaru District is
the third largest district by population and sixth largest by area in the Canterbury region. It
has a population density of 16.3 persons per square kilometre. The district enjoys a
temperate climate, with Timaru enjoying an annual average of 1,826 hours of sunshine and
573mm of rain.
2.2 Demographics
All statistics based on Stats NZ 2006 census or other Stats NZ data.
The estimated resident population of the Timaru District as at 30 June 2011 was 44,700.
Population projections indicate that over the next twenty years, Timaru District’s population
is likely to remain fairly static.
Around 80% of Timaru District residents live in or around the four main settlements -
Timaru, Temuka, Geraldine and Pleasant Point. Households are projected to increase in the
future to around 19,600 in 2016 from 18,300 in 2006. In the Timaru District, 68.8% of
households are one family households (NZ: 69.9%) with 27.2% one person households (NZ:
23%).
Average household size in 2006 was 2.4 people (NZ: 2.7). In 2006, median family income in
Timaru District was $50,300 (NZ: $59,000). Median personal income for people aged 15 and
over was $21,200 (NZ: $24,400).
2.3 Solid Waste Services & Facilities, Pre 2006
The Council provided a weekly 240 litre rubbish bin collection service, which started in 1990
with an initial 10 year term, being renewed until 2006. Four transfer stations service the
main urban areas, a landfill is located in Timaru and a small garden waste compost
operation processing about 2,500 tonnes per annum operated from 1995 to 2006.
Comprehensive waste audits were carried out from 1993 to 1998 of the various waste
streams. The organic waste composition varied as shown in Table 1. The organic waste
composition in 2005 was estimated at 35% of the quantity being landfilled. In addition to
the potential 18,000 tonne of organic waste, there was another 2,000 tonnes of putrescible
industrial/municipal sewage screenings.
Table 1. Timaru District, Estimated Potential Organic Waste for Diversion -2005.
240 litre Kerbside Transfer Stations Direct to Landfill Total
2005 tonnes
Collection
Total Waste 16,844 T 9,068 T 26,488 T 52,400 T
Garden 48.3% 35.3% 8.1%
Food 17.3% 1.0% 6.2%
Total 65.6% 36.3% 14.3%
Organic Waste 11,050 T 3,292 T 3,787 18,130 T (35%)
3 Drivers of Change
Pending renewal of the kerbside collection contract in 2000.
50% of residential wheelie bins comprised garden waste.
In 1997, a garden waste trial resulted in 96% support for a second bin for garden waste.
Only 12% indicated that they would prefer to compost at home instead of having a
garden waste collection.
2|P a ge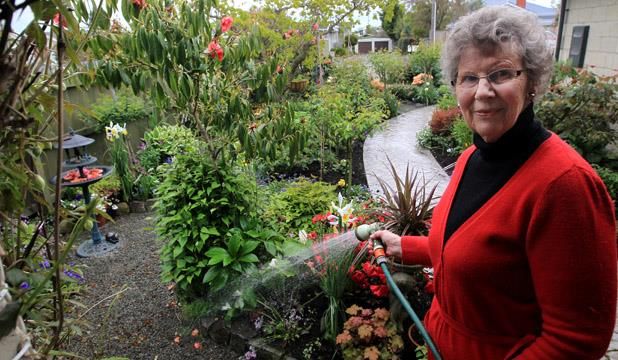
In 1999, 89% of the community indicated a preference for alternative waste options
instead of just landfilling the majority of waste.
94% wanted new initiatives implemented within 3-5 years.
Increasing landfill quantities. The Council landfill was estimated to only last 15 years from
2005. New waste minimisation initiatives would increase the landfill life.
2002, NZ waste strategy provided national targets for organic waste.
3.1 Three Bin System
The two main issues facing Council with the implementation of the new solid waste plan
were the strategic decisions on:
• What to collect and how?
• Options for organic waste processing.
The Council conducted an initial survey of residents with 5 collection options, which was
later narrowed down to 3 options. The initial preferred option from residents was for a 240
litre organic bin collected weekly, with a split 240 litre bin collected weekly for rubbish and
recycling. Using bags and crates were the least preferred, with bin options being more
favourable. Timaru residents have shown a preference for wheelie bin systems since the
initial bin trial in 1988, when 85% indicated their preference for a wheelie bin rubbish
collection. While recognising the resident’s choice of split bins, there are operational issues
with split bins due to cross contamination and bin damage due to materials getting stuck in
the bin. A 3 bin option was decided upon, subject to a trial.
To confirm if the residents were prepared to have 3 bins and pay the extra costs, a trial was
undertaken during December 2004 and January 2005.To maximise the diversion of organic
waste for composting, food waste was included in the trial.
Each participant was issued with:
• One 240-litre Organics bin with a green lid for garden and food waste.
• One 240-litre Recycle bin with a yellow lid and
• One 120-litre Rubbish bin with a red lid.
The organics bin was collected weekly and the recycling bin and rubbish bin were collected
fortnightly on alternate second weeks. Instructions for residents were provided on simple
A4 information sheets.
3.2 3 Bin Trial Results
• 87% supported the 3 bin system.
• 64% had no problems.
• Common problems found on the trial were:
Separation of waste in the kitchen.
Others in the house not educated.
Didn’t know what to put out.
Got collection days mixed up.
The majority of issues could be addressed by a proper information and education
programme with the main roll-out.
Residents were prepared to pay extra for a 3 bin service.
Based upon the outcome of the trial, the Council decided that the 3 bin system was the
preferred method for kerbside collection from 1 July 2006. This meant that a new phase of
work started to address the potential issues of the 3 bin system as identified by the 36% of
respondents. In particular, elderly people were most resistant to change.
3|P a ge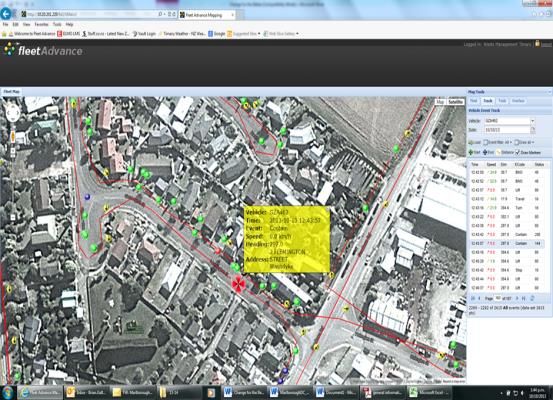
4 Collection Requirements
The trials indicated that a special collection would be required for some elderly people who
could not mange 3 bins. Audits of their waste showed that the following container sizes in
table 2 would meet their requirements on a weekly basis. As a result a special EcoCart was
provided to initially 183 premises. This number has reduced to 163 as of September 2013.
60 litre wheelie bins were not available in 2005. It is likely that we would have offered these
if they had been available instead of the Eco-Cart
Table 2. "Pensioner Waste Capacity Requirements"
Container Capacity Satisfied Weight
Rubbish 30 litre 97% 2.7kg
Recycle 45 litre 90% 3.6kg
Organic 60 litre 87% 8.0kg
One size does not fit all and to help satisfy the requirements of the community a range of
bin sizes was provided. The actual split of bins closely reflects the trial preferences. This
shows the importance of undertaking trials to provide an indication of what the overall
outcome will be.
Table 3. Organic Waste Container Preference
Preference from Trial Results Actual Split Sept 2013
240 litre 93% 91%
140 litre 7% 8%
Eco-Cart Not available 1%
5 From Concept to Contract
In calling for proposals in February 2005, Council was able to give to prospective contractor’s
some clear parameters:
A 15 year contract,
A 3 bin kerbside collection system, with a weekly collection of organic waste,
Food waste and garden waste to be collected.
The Council wanted one contractor to manage all the solid waste activities, including,
collection, recycling, landfill, transfer stations and the composting.
Allowing 15 years for the contract enables expensive plant to be amortised over a longer
period, reducing annual costs. This also coincides with 2 cycles of collection trucks and the
expected economic life of the wheelie bins.
Communication with contractors regarding tender timing and time for response is crucial to
ensure that contractors have plenty of time to submit a worthy bid.
The RFP process and contractor selection was carried out in-house by the Council. An initial
Memorandum of Understanding was signed to enable the project to develop while the final
contract was written by consultants, being finalised just before the commencement date.
As the actual quantities of waste for the various streams were unknown, annual lump sums
were used initially, changing to a combination of fixed and variable pricing based upon
variable quantities. A minimum return on compost sales is provided to Council, with a share
of revenue above the threshold.
There is now a kerbside collection contract template on the LGNZ website.
http://www.lgnz.co.nz/assets/Uploads/Our-work/WM-KerbsideCollectionContractTemplate.pdf
4|P a ge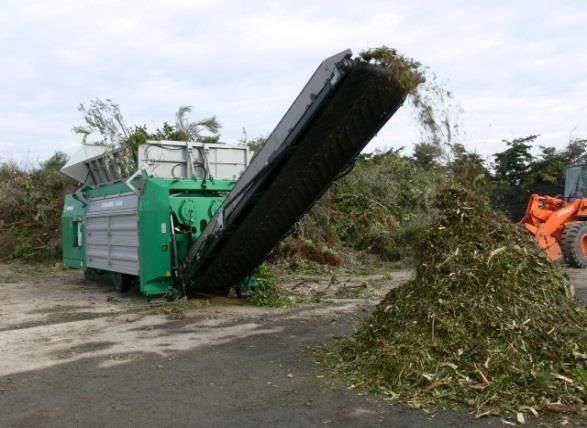
6   Initial Community Consultation
    A comprehensive community consultation and information programme was undertaken
    before the roll out. This included a range of media, including newspaper, radio, displays and
    brochures. Waste staff visited residents and businesses, as well as attending displays, giving
    talks, etc.

    A “comms” person was employed to specifically confirm options for businesses. As some
    businesses had little to no organic waste, they were given the option of 2 recycle bins
    instead of an organic bin. There was a lot of uncertainty at the start from people. There was
    a variety of responses from being organised, to leaving it to the last minute, to await the
    default bin supply and then ring up to complain as the bins delivered did not suit.

    There was concern from some rural people initially that they would not require an organic
    bin, however bins were delivered to all residents and this concern died down after the bins
    were delivered and in use. Some residents with large sections have 2 bins. People were
    hungry for information. There is a need to have good information to hand out early on.

7   Bins and Tonnes
    The first year of operation saw a large one-off amount of garden waste because of a snow
    storm. In subsequent years, quantities have slowly increased and are influenced by climatic
    conditions. There is sufficient capacity at the current site to process material for the
    remaining term of the contract.
                                    Table 4.Bin Numbers and Tonnes
          Sep-13           Rated Properties         18,069                 Year         Tonnes
             Garden waste only from transfer stations                     2005/06        2,500
        Organic Bins                Residential Bins                      2006/07       16,846
           Urban                13,606                72%                 2007/08       13,243
           Rural                 5,383                28%                 2008/09       13,703
                                18,989                                    2009/10       14,034
                                                                          2010/11       14,368
                                     CBD Areas Bins                       2011/12       14,880
            Urban                  268             65%                    2012/13       14,129
            Rural                  147             35%
                                   415

    As expected, the overall quantity of waste being generated did not change significantly as
    shown in table 5. The majority increase of organic waste came from the weekly 240 litre
    rubbish bins. There has been about 2.5% growth in overall waste over the past 7 years, while
    the organic waste from 2007/08 has increased between 6-12%.
                                      Table 5. Overall Waste Tonnes
                              2005/06             2007/08             Variance      2012/13
     Kerbside Collection       18,080               6,742               -63%          7,082
       Organic Waste            2,569              13,307              +418%         14,085
            Total              20,649              20,049                -3%         21,167

    The annual total of organic waste is approximately 14,000 tonnes. An increase in tonnes
    during summer takes the site to an equivalent 18,000 tonnes being a 29% increase above
    the annual total. It is interesting to note in figure 3 that July quantities have increased by
    35% each year over the past 2 years due to mild winter conditions.

                                                                                      5|P a ge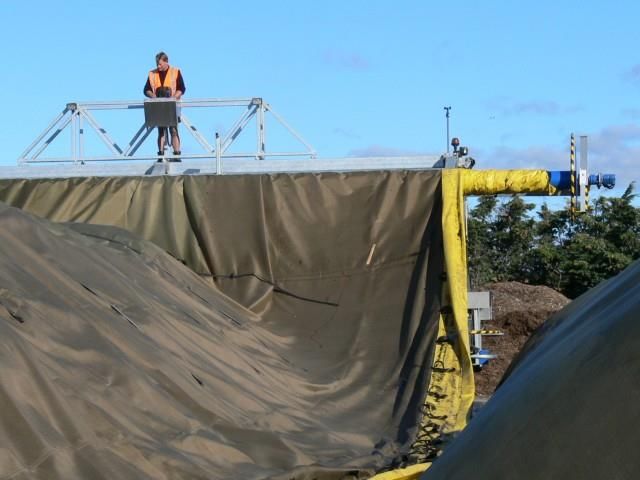
Figure 1. Monthly Compost Tonnes

                                                           Compost Tonnes
                                                                 FY12        FY13       FY14

                                            2,000

                   Gross Tonnes Processed
                                            1,500

                                            1,000

                                             500

                                               0

8     Compost Facility
8.1   Site and Technology
      As the Council wanted to compost food and garden waste, an “enclosed” composting
      system was required.

      Given the “smaller” quantities for Timaru, an enclosed building and tunnel system was
      considered too expensive for Timaru, even though this offered a reduced risk with possible
      odour. It was also not suitable to construct on the old landfill. The site is located
      approximately 500 metres to the nearest residential houses

      The initial technology considered was the “Ag-Bag” system. The bags similar to “silage
      sausages” could be placed on top of the existing compost site with limited capital outlay,
      although a new bag was required each time. A Team visited the USA and looked at a Gore
      Cover composting operation and an Ag-Bag operation. Council decided to proceed with the
      Gore Cover system. This decision was also based upon feedback from the US EPA and proven
      reputation of the Gore system. Information about the Timaru composting facility is on the
      Council website. http://www.eread.co.nz/oneplanet/#/110/

      The Gore system was more expensive to develop and consequently the decontamination
      picking line and a “wind sifter” to remove plastic on the trommel screen were not installed.
                                                    Figure 2. Timaru Gore Cover Composting Facility

                                                                                                      6|P a ge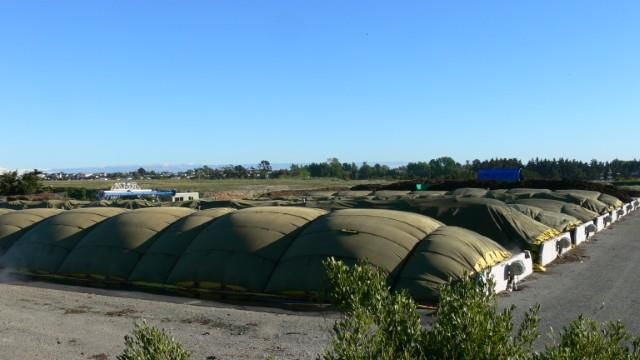
Figure 3. Timaru Composting Site
                                                           The Regional Council, granted approval to
                                                           develop the compost facility under the
                                                           existing landfill consent. This was assisted
                                                           by the track record of Gore technology
                                                           and then EPA evidence from the US site.
                                                           After the visit to the Gore Cover site in
                                                           Seattle, the operators there doubled the
                                                           quantities     they     were     processing
                                                           (>200,000 tonnes) and have subsequently
                                                           encountered adverse litigation claims.
                                                           There was scope to develop the new
                                                           Timaru compost facility on a green field
                                                           site adjacent to the proposed Council
                                                           waste water plant; however this was
                                                           subject to possible delay of several years
                                                           with consenting issues and did not fit into
                                                           the solid waste timeline.

                                                        There was concern about building the
                                                        new compost pads on top of the old
                                                        landfill. Additional reinforcing was placed
      in the concrete pads with an expectation to repair isolated settlement as required. The old
      surfacing at the unloading/reception area broke up and was replaced because of the heavy
      loader travelling along similar pathways on site. There has been some settlement with
      ponding of water on site after rain and the site is being monitored. All systems are still
      functioning satisfactorily. Compost leachate and site stormwater is reticulated through the
      landfill drainage systems.

      Based upon the success of the Gore system in Timaru, Transpacific is installing further Gore
      composting systems in Australia.

8.2   Process
      Quantities of organic waste are subject to seasonal influence as shown in figure 1. It is
      critical to achieve the correct carbon to nitrogen ratios, particularly from spring to autumn
      when the waste is nitrogen rich with grass and moisture levels are high. It is necessary to
      stockpile woody “carbon” material through winter to achieve the optimum ratio.

       Other key parameters to successful composting include turning, moisture, temperature,
      oxygen and the overall physical structure and composition of the heap. Maturation is
      important to ensure that the compost process has finished before sale.
                                       Figure 4 composting operations

                                                                                              7|P a ge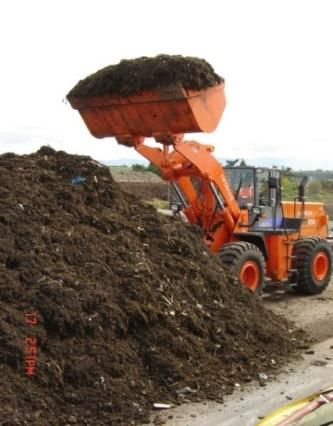
8.3   People
      Composting is an ever changing process and requires skilled people to manage the overall
      process. Training is important, but it is also crucial to have staff with a passion for the job
      and sense of care to ensure that good quality compost is produced for sale. Attention to
      detail, work procedures and changes in the waste stream which can happen over a week are
      required to avoid adverse effects. It is the people that operate the facility that must be
      relied upon to ensure that everything runs smoothly.

8.4   Odour
      There was a one-off issue with odour from the site in the first year of operation with too
      much moisture in the heaps. This occurred with a new compost operator during the
      transition from winter to the spring flush with lots of greenery in the waste stream. The
      mistake has not been repeated.

      Transpacific has a comprehensive operations plan, risk assessment register and procedures
      in place to reduce, mitigate and eliminate issues. An odour neutralising misting system was
      installed after the initial odour issue as a contingency. As part of the site operations, staff
      monitor wind direction and delay any work that may potentially give concern to odour
      dispersal until wind conditions drop. There have not been any significant odour complaints
      since the first year of operation and Transpacific has been compliant with the site consent
      conditions.

      The site was visited and monitored by a staff from the Odour Unit from Sydney in 2012.
      There were no issues to report and the smell on site from the heaps being likened to the
      discharge from a bio-filter.

8.5   Plant
      The on-site plant includes a loader, an excavator, shredder, trommel screen and cover
      winder. All plant and equipment has performed satisfactorily and meets the expectations of
      Transpacific.

      The Gore covers have an estimated life of 6-7 years and these have just been replaced for
      the second half of the contract. Improvements were made to the tie downs for the second
      set.

      There is no pre-sort line to remove contamination from the incoming feedstock. This is
      removed by hand and placed in a skip.

      In hindsight instead of the stationary trommel screen, a mobile screen may have been a
      better option to move to the stockpiled heaps furthest away in the maturation area to
      reduce travel time for the loader.

9     Health and Safety
      Transpacific has a comprehensive health and safety programme. Staff undergo regular
      health monitoring.

      Risks for the site have been identified, with work instructions and procedures developed to
      reduce, mitigate and eliminate adverse effects. To date there has not been any significant
      health and safety concerns.

                                                                                         8|P a ge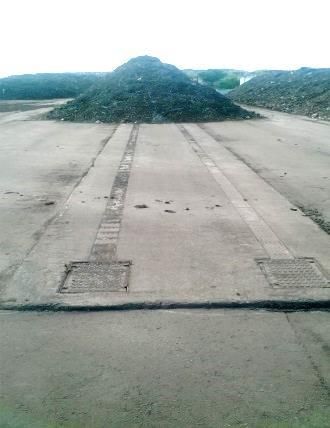
10 Quality Testing
A comprehensive testing programme is undertaken for every compost heap made. Tests
include;
Pre-composting, (Carbon : nitrogen, moisture).
Post-composting, full range of parameters,
Spray residues for organic certification, Clopyralid detection.
In addition further testing is carried out in accordance with the requirements of the New
Zealand compost standard NZS 4454.
Emphasis is given to ensuring that the compost is fit for the target market, taking into
consideration clopyralid levels and compliance with the compost standard.
Overall physical contamination complies with the compost standard. One market was
quashed as a small sliver of glass was visible in some compost. We cannot guarantee 100%
contaminant free in the larger 25mm grade, however positive customer feedback is helping
sales to grow.
11 Bin Audits
11.1 2007-2008 Audits
The Council conducted comprehensive wheelie bin audits in 2007 and 2008. This provided
an overall assessment on how people were going in regard to putting the right waste in the
organics bin. The audits in 2007 and 2008 were carried out in July and May respectively
when garden waste quantities were at lower winter levels.
Table 6. Correct/Incorrect Bin Contents
Organic Bin Correct Contents Incorrect Contents
2007 96% 4%
2008 97% 3%
11.2 Bin Composition
While placement of garden waste is easy for people to do, of concern was to see how
people were disposing of their food waste. With on-going information being provided from
the Council there was an improvement in the recovery of food waste from 2007 to 2008.
Table 7. Food Disposal
2007 2008
Food in plastic bags 11% of households 4% of households
Food in newspaper 42 % of households 38 % of households
bundles
Food loose in the bin 61 % of households 62% of households
NO FOOD AT ALL 22 % of households 19% of households
From the bin audits in 2007 to 2008, 53% to 60% of food waste was being recovered. This
will be further improved with greater promotion and use of kitchen caddies and bio-bags.
9|P a geTable 8. Bin Audit Weights
Organic Bin 2007 kg 2008 kg Variance
Garden 9.14 10.52 15.1%
Food 2.86 2.87 0.3%
Paper/Card 0.16 0.13 -18.8%
Food in plastic bag 0.11 0.08 -27.3%
Waste 0.42 0.4 -4.8%
12.69 14 10.3%
Rubbish Bin 2007 kg 2008 kg
Food 2.4 1.8 -25.0%
Total Food in organic and rubbish bin 5.37 4.75
Food Recovered via organic bin 2.86 2.87
% 53.3% 60.4%
11.3 Bio-bags/Kitchen Caddies
The Council considered kitchen caddies and bio-bags for the improved recovery of food
waste, however the Council had concerns about the extra cost, the on-going supply of bio-
bags and that if people ran out then they would use plastic bags. Bio-bags and caddies are
available for purchase and the Council has promoted the sale and use of these.
11.4 Visual Audit 2009
The bins that were audited were listed into four categories.
Table 9 Contamination
Category Description
Complying No contamination visible in the bin.
Minor Contamination Bin suitable for collection; some contaminants identified.
Major Contamination Bin suitable for collection; significant contaminants identified.
Reject Bin Bin not suitable for collection.
The audit results show that the Tuesday collection day had the lowest complying bins;
however the day for the worst contamination was the Thursday.
Table 10. Contamination by Day
Mon Tue Wed Thurs Fri
No. Bins Sampled 67 88 82 77 90 404 Total
Complying 100% 85% 92% 88% 97% 92.1%
Minor 6.7%
Contamination 0% 14% 7% 8% 3%
Major 1.0%
Contamination 0% 1% 1% 3% 0%
Reject Bin 0% 0% 0% 1% 0% 0.2%
10 | P a g eContaminants that were found included, plastic wrap and bags, food in plastic bags, plastic
containers, ash, clothing, general rubbish and wood off-cuts.
In addition common organic materials rejected for composting include, flax, bamboo, and
cabbage tree leaves.
12 Bin Inspections
Driver observation and recording of gross contamination has enabled the Council to focus
on the worst streets or repeat offenders. Phil Burridge from the Council, “Mr Bin” carries out
regular bin inspections of bins placed out for collection. This is approximately a 0.5 FTE role.
A three strike approach is undertaken by Council. A first letter provides notice of the
contamination found in the bin, with an information booklet to help inform the resident. A
second warning is provided similar to the first and the third is removal of the bin which is a
very rare event. Recognition of good presentation by letter is also provided to residents who
do everything correctly.
12.1 Contamination Level
The initial 3 bin trial in 2004/05 showed an indicative contamination rate of 2%. The
contamination level recorded for the first year was 1%, creeping up to 3% and for the past
few years has been below 1%.
13 On-Going Education/Information
Briony Woodnorth, the Council Zero Waste Advisor, runs tours of the compost facility and
other activities at the Redruth site, with many people and school tours visiting the facility
each year. This portion of her work is approximately a 0.5 FTE role. She also speaks
frequently in schools and to community groups, as well as visiting businesses and work
places.
The Timaru hospital changed over its entire waste system, separating out food, tissues,
paper towels which can all be composted. Some businesses that previously had 2 recycle
bins changed one over to place shredded paper and hand towels in the organic bin instead.
The Council provides bins for 3 way separation of waste at public events. All
info/bins/signs/stickers provided by the Council are colour coordinated. Food waste
separation is promoted. The use of bio-bins and green coloured bio-bags are supplied to
some businesses as an initial tool to assist with food waste separation.
Brochures and information supplied by the Council are regularly updated.
14 Collection GPS Tracking
All collection trucks were initially fitted with GPS (Satellite Tracking), however these were
not compatible with the change-over to Transpacific. With the replacement of new kerbside
collection trucks new systems have been installed. The benefits of tracking include:
Safety – the depot is always aware of a vehicle’s location and therefore can attend to
incidents quickly.
Council enquiries about current locations of vehicles relative to their daily collection
routes.
Proof of location for incident investigations. For example, “early starts” accidents,
contamination and bins not presented for collection.
The system will work in areas where 2-way radios have ‘blank spot’ or ‘no signal’.
11 | P a g eFigure 5. GPS Tracking
The system will provide additional substance to
reports regarding operational matters such as
monitoring and counting bin lifts
Historical enquiries about a particular vehicles
collection route will be recorded and the exact
location will be known in the event of vehicle
breakdowns. The image on the left has been
downloaded from live GPS data able to be
viewed on line by either Transpacific or the
Council.
14.1 RFID Tags in Bins
Council did consider the installation of RFID tags in wheelie bins and monitoring technology
prior to the implementation of the new 3 bin system in 2005. At the time there was no
robust track record of proven technology to implement this system. Even if tags were
inserted in the bins, the type of tag may not have been compatible with systems at a later
date. It is likely that Council will review inserting RFID tags in new bins that are supplied as
part of the on-going delivery of bins
15 Arsenic
During the winter of 2007 and 2008 testing indicated levels of arsenic in the compost above
the compost standard threshold as shown in figure 6. This was attributed to CCA (copper,
chrome, arsenic) treated timber and ash from treated timber burnt in domestic log fires.
A comprehensive public education programme was initiated to halt the disposal of CCA
waste into the organic bin and to inform the public about the danger of burning treated
timber. There were lots of phone calls to the Council from the public who wanted do the
right thing. This was a successful campaign in changing behaviour as the arsenic levels have
dropped below the threshold and have remained there.
Figure 6. Total Arsenic Levels
12 | P a g e16 Clopyralid
Some sprays used to kill broadleaf weeds in grass contain the chemical Clopyralid. These
include, Versatill, No Lawn Weeds Clover and Prickle, Tango, Contest, Radiate, Clout, Clopyd
300, Void, Vivendi 300, Multiple, Pirate 300, Cardo, AGPRO Cloralid 300 and Archer.
Small quantities even at 5 parts per million in compost may affect plants, particularly
tomatoes, potatoes, beans and other legume vegetables. Other vegetables, plants, lawn,
turf and general farming or horticultural situations are not normally affected.
When Clopyralid levels are zero we are able to submit compost for organic status approval.
The Environmental Risk Management Authority of New Zealand (ERMA) reassessed the use
of clopyralid on 17 August 2007. In summary, the following conditions have been imposed
on the use of Clopyralid:
whereby only approved handlers may purchase the chemical,
that the substance is not be used on “turf”,
that treated vegetation is not to be disposed via “greenwaste composting” systems.
The sprays containing Clopyralid are still being used in the community as people probably
have old spray bottles at home, or obtain spray from rural friends. Clopyralid levels are still
be detected in compost ranging up to 100ppm.
Commercial lawn mowing contractors have been contacted by the Council to inform them of
the issues of Clopyralid, as well as comprehensive information in various media sources has
been provided to the general public.
Figure 7. Clopyralid Levels
17 Maturation Area
With increased volumes of compost containing arsenic and clopyralid not being available for
sale, compost was stockpiled on the old landfill area adjacent to the compost site. This area
had low spots from settling and water had ponded, making this unsuitable to store compost.
In 2013 a new extension to the maturation area was developed using crushed glass as a sub-
base drainage layer, with crushed concrete as the top-course. This area has enabled an
improved surface for turning compost in favourable site conditions.
18 Other Organic Waste
There is approximately 2,000 tonnes of other industrial putrescible waste currently being
landfilled. Businesses are looking for alternative options compared to paying $192.50 per
13 | P a g etonne to landfill the waste. We will be undertaking a review of possible options for this
waste. Another 3 bays will be needed to accommodate this waste if was to be processed
through the Gore cover system. Pre-treatment would be required for de-odourising and
bulking.
Gib-board is currently separated and composted, although only a small quantity of about 15
tonnes per annum.
19 Compost Trials
Transpacific and the Council were part of a project group that helped sponsor compost trials
from 2007 to 2012. The research was carried out by Plant and Food Research.
The impact of municipal compost in pasture, forage crop, intensive vegetable and arable
crop rotations was tested in field trials in South and Mid-Canterbury. These trials assessed
the effect of compost on yield, soil health indicators and financial viability.
Results indicated that mature municipal compost can enhance crop production for at
least 2 years following a single application in arable, pastoral and forage cropping
systems.
The most profitable scenario in a 3-year arable rotation was 3 annual applications of
8t/ha.
In a forage brassica rotation, compost application rates of 12 t/ha with a 40% reduction
in Nitrogen fertiliser, increased yields by 18%. This 1-year scenario was financially viable
for freight costs up to $14/t, approximately 80km from Timaru.
A summary of the trials and full report can be found at:
http://www.mpi.govt.nz/environment-natural-resources/funding-programmes/sustainable-farming-
fund/sustainable-farming-fund-search.aspx : (Grant number 09/152).
Figure 8. Compost Trials
20 Sales and Marketing
Compost is sold by the bag ($5), the trailer load ($25 scoop) and in bulk truck and trailer
loads. Current grades include 10mm and 25 mm size, with a fine lawn mix as well. The sales
price varies depending upon quantity up to the equivalent of $75.00 per tonne when sold by
the scoop through the transfer stations. Variable discounts are available for bulk quantities.
Transpacific provides a guaranteed return to the Council from the sale of compost and the
parties share in sales above the minimum guaranteed level.
The Council is proactive in promoting the sales of compost. Word of mouth is spreading with
customers coming back for more compost.
Sales of organic approved compost are restricted by the Clopyralid levels.
14 | P a g e21 “Bloomin Gorgeous”
Figure 9.Compost key for garden winner.
Wensley Ashwell’s townhouse garden was
placed first in one of the five categories in
the Timaru Horticultural Society’s 2013
spring flower competition.
For Mrs Ashwell, the secret to good
gardening lies in the soil, and she swears
by the Timaru District Council's compost.
"It's all I use, and occasionally some sheep
pellets, but I think the compost is
amazing," she said.
22 Economics
22.1 Gate Fees
As waste to landfill has decreased over time, the cost to landfill waste for the Council has
had to be increased to make up for lost revenue. The current landfill disposal fee is $192.50
per tonne, inclusive of GST.
The cost to process the organic waste is about $100 per tonne, plus GST. The gate fee
charged by the Council for organic waste is $60 per tonne inclusive of GST which is offset by
a higher landfill gate fee. The lower fee is an incentive to encourage waste separation.
22.2 Kerbside Collection
The initial one bin kerbside collection in 2006 cost residents $104 per annum inclusive of
GST. This was increased to $249 with little fuss for the new 3 bin service. The current fee for
the service is $318, which is just over $6 per week for 3 bins, or $2 for each bin per week.
In providing the 3 bin service the number of small vehicles using the transfer stations has
reduced, which is a further community saving.
23 Conclusion
The Council undertook comprehensive waste audits to help determine waste composition
and quantities. While the community had a focus on recycling, it was the organic waste
stream that would provide the largest reduction of waste to landfill.
Extensive community consultation is required to ascertain the level of service and meet
individual requirements. The “one size fits all” approach does not work for the provision of a
good service. A trial of the proposed 3 bin service provided valuable insight to the
community requirements. Feedback on issues resulted in different bin sizes being provided,
along with an education programme to address their issues and questions.
Satisfaction of the kerbside collection service measured in The 2011/12 Council Survey was
91%.
15 | P a g eAllow plenty of time for the procurement of services and enable an interactive tender
period. At least 2 months should be allowed for tendering alone. Try and avoid any clashes
with other tenders. It took the Council 7 years from consideration of possible options in
1999 before the 3 bin service and associated facilities were operational in 2006. As potential
contracts are going to be long term, it is prudent to have longer tender timelines and avoid
trying to meet tight deadlines. It takes time not only to prepare tenders, but time to
consider these as they may be unique. As decisions revolve around Council and Committee
meeting allow plenty of time.
Ensure that the systems being proposed are robust, and proven with good track records.
The Gore Cover composting facility has provided the appropriate level of processing for the
organic waste resulting in good compost product for sale.
Follow up monitoring and enforcement is required to ensure separation and contamination
standards do not slip. Technology can help with the recording; however a personal visit will
still be required to maximise participation and build community response.
Clopyralid residue from spray has required extended maturation of compost for some
markets. A good community response helped reduce arsenic levels to below the threshold.
For return compost sales, quality is key.
Training and retention of compost staff is essential, as experience is valuable for good
operations.
While there have been some site settlement issues with the facility being located on an old
landfill, overall the Gore Cover composting system has achieved the required outcome for
composting.
With the implementation in 2006 of the organic collection and composting operations the
quantity of waste to landfill was significantly reduced. Council has continued to make
improvements on reducing waste to landfill.
Figure 10. Overall Waste to Landfill
Both the Council and Transpacific are happy with the current collection and composting
system, looking forward to the on-going successful completion of the contract.
16 | P a g eYou can also read