A Market Segmentation Analysis for an eVTOL Air Taxi Shuttle
←
→
Page content transcription
If your browser does not render page correctly, please read the page content below
A Market Segmentation Analysis for an
                 eVTOL Air Taxi Shuttle
                                   Conor Hill1 and Laurie A. Garrow2

                      Georgia Institute of Technology, Atlanta, GA, 30332-0355, U.S.A.

                This paper presents details of a market segmentation analysis conducted using data from
            a stated preference survey we designed to model competition among an electric air taxi
            service, autonomous ground vehicles, and traditional ground vehicles for an air taxi shuttle
            to major commercial airports in the United States. This paper is based on data collected
            from January 8 to April 7, 2021, and includes 2,439 responses from individuals who took at
            least two trips by air in 2019 before COVID-19; have annual household incomes of at least
            $75K; and live in the Atlanta, Boston, Chicago, Dallas–Ft. Worth, Los Angeles, New York,
            or San Francisco combined statistical areas (CSAs). Factor analysis of respondents’
            perceptions of electric vertical take-off and landing (eVTOL) aircraft identified two
            dimensions: Concern and Enthusiasm. Cluster analysis of the scores on these factors
            identified seven meaningful clusters, which differed on a variety of demographic, travel
            behavior, and attitudinal variables, as well as on respondents’ inclination to adopt eVTOL
            for traveling to a commercial airport.

                                            I. Introduction and Motivation
    In recent years, multiple companies have initiated development of prototypes for air taxis in the form of electric
vertical take-off and landing (eVTOL) aircraft. At the time of this writing, the Vertical Flight Society, which tracks
progress in eVTOL aircraft, has cataloged over 300 eVTOL aircraft in development by various organizations
worldwide (eVTOL News, 2021). Much of the existing research has focused on understanding market conditions for
an electric air taxi service in relation to differing commuting scenarios. That research includes two market
segmentation analyses we also have conducted based on 2018 and 2019 stated preference survey data from AIAA
conference proceedings that focus on market size and willingness to pay for on-demand commuting air taxi services;
these previous surveys focused on high-income individuals (over $75K) in five U.S. cities. The 2018 survey looked
at near-term scenarios, i.e., electric air taxi service versus traditional ground vehicles, while the 2019 survey looked
at longer term scenarios involving future market conditions, i.e., electric air taxis, autonomous ground vehicles, and
traditional ground vehicles (Binder et al., 2018; Garrow et al., 2019).
    Whereas a lot of prior research has focused on commuter trips, in this paper we provide one of the first market
segmentations based on an eVTOL airport shuttle. Throughout this paper, we define an airport shuttle as an eVTOL
vehicle that would transport a user to the airport from a vertiport located close to the user’s home; the air taxi can
have a pilot or be autonomous and has an alternative ride guarantee in the event of inability to travel. This airport
shuttle would be used in place of getting to the airport by another mode of transportation such as one’s own personal
vehicle, a ride-hailing service (e.g., taxi, Uber, Lyft, etc.), or public transit. In the present paper, we conduct a
market segmentation analysis based on a 2021 survey that looked at air travelers’ willingness to pay for an air taxi
shuttle to the airport with an origin near the individual’s residential location and the destination at the airport. The
survey was designed to explore differences in willingness to pay by trip purpose (i.e., reimbursed business trips and
self-paid leisure trips). The segmentation analysis we conduct in the current paper’s 2021 survey that is based on an
air taxi shuttle to the airport mission complements our two previous segmentation analyses that were based on a
commuter mission. Given that our 2021 market segmentation analysis overlaps in several ways with our prior two
surveys and market segmentation analysis, we draw text directly from our prior AIAA conference papers to provide

1   Former M.S. Student, School of Civil and Environmental Engineering.
2   Professor of Civil and Environmental Engineering and Co-Director for the Center for Urban and Regional Air Mobility.

                                                                1
the reader with a self-contained description of our 2021 analysis and approach (Binder et al., 2018; Garrow et al.,
2019).
With the collected data on perceptions of the proposed new services, as well as lifestyle/attitude attributes and
other socioeconomic and demographic (SED) characteristics, we conducted a marketing segmentation analysis
based on typical approaches (e.g., Pronello and Camusso, 2011). This involved factor analysis of the eVTOL
perceptions and a clustering of the sample based on the outcome of the factor scores. From there, the clusters were
analyzed based on attitudinal statements and SED characteristics.
In this paper, we begin by describing the empirical setting and overall design of the survey instrument. From
there, we present our market segmentation approach (i.e., factor and cluster analysis as described above). Finally, we
show the results of the market segmentation analysis and draw some conclusions relevant to the eVTOL air taxi
demand relative to trips to the airport.
II. Empirical Setting
The data analyzed in this study (hereafter referred to as the 2021 survey3) were collected from January 8 to
April 7, 2021, from an internet-based survey of commuters from seven large U.S. cities. Respondents were recruited
through an online opinion panel service provider. To minimize the nonresponse bias associated with people who
have a low interest in such a service declining to take a survey about it, the recruitment message simply told
individuals that the purpose of the survey was to “ask you about your attitudes, travel patterns, and air travel
experiences.” We did not explicitly refer to an air taxi service in the introduction. To ensure maximum use of our
limited resources in the survey, only those who were 18 years or older, took at least two round trips by air in 2019
(before COVID-19), had not moved since January 2020, and had an annual household income of at least $75K were
eligible to complete the study. Further, to be eligible, the individual must have either taken a reimbursed business
trip or a leisure trip paid in cash (not miles) in 2019 (before COVID-19). Individuals who worked in the aviation
industry or were full-time students were excluded. Finally, to be eligible individuals had to indicate that when
traveling by air, they typically traveled to the airport by driving themselves, taking a cab, or using a ride-hailing
service. The analysis database includes 2,439 respondents who reside in the Atlanta, Boston, Chicago, Dallas–
Ft. Worth, Los Angeles, New York, or San Francisco combined statistical areas (CSAs). Quotas were used to help
ensure a minimum number of responses was obtained for each CSA and different household incomes.
The survey instrument contained 11 parts. It included approximately 90 questions, though some questions were
not shown to all respondents, e.g., respondents were only asked if they paid for parking at the airport if they
indicated that they arrived at the airport via a private vehicle. In a parallel paper, we describe the survey instrument
in detail (Leonard et al., 2021). In this section, we provide descriptive statistics for parts of the survey including
SED characteristics (Table 1), a recent air trip (Table 2), and perceptions on self-driving cars and air taxis (Tables 3
and 4, respectively).
The 2021 survey complements the 2018 and 2019 surveys quite well. Whereas the two prior studies focused on
using eVTOL for commuter trips, the 2021 survey looks at using eVTOL as an air taxi shuttle to the airport. The
sample size of the 2021 survey (2,439) more closely models that of the 2018 survey (2,499) than the 2019 survey
(1,405).
3
Note that at the time of writing this paper, survey data were still being collected. Our analysis is based on 2,439 responses,
whereas the final survey contains 2,820 responses.
2Table 1 Socioeconomic and sociodemographic characteristics of the sample.
Characteristic Category Number (%)
Atlanta 270 (11.1)
Boston 189 (7.7)
Chicago 321 (13.2)
Combined statistical area (N=2,439) Dallas–Ft. Worth 264 (10.8)
Los Angeles 565 (23.2)
New York 565 (23.2)
San Francisco 265 (10.9)
$75K–$99.9K 289 (11.8)
$100K–$149.9K 671 (27.5)
Annual household income (N=2,439)
$150K–199.9K 721 (29.6)
$200K or more 758 (31.1)
Female 680 (27.9)
Gender (N=2,439) Male 1,755 (72.0)
Nonbinary/Prefer not to answer 4 (0.2)
18–24 years 32 (1.3)
25–34 years 359 (14.7)
35–44 years 1,068 (43.8)
Age (N=2,439)
45–54 years 380 (15.6)
55–64 years 308 (12.6)
65+ 292 (12.0)
1 adult 219 (9.0)
Number of adults in household (N=2,439) 2 adults 1,894 (77.7)
3 or more adults 326 (13.4)
No children 888 (36.4)
1 child 457 (18.7)
Number of children in household (N=2,439)
2 children 826 (33.9)
3 or more children 268 (11.0)
African/African American/Black 84 (3.4)
Caucasian/White 2,081 (85.3)
Ethnicity (N=2,439) Hispanic/Latino 52 (2.1)
Asian/Asian American 199 (8.2)
Other/Prefer not to answer 23 (0.9)
Some college or less 130 (5.5)
Associate degree 74 (3.0)
Highest educational level (N=2,439) Bachelor’s degree 863 (35.4)
Master’s degree 1,000 (41.0)
Professional or doctorate degree 369 (15.2)
No vehicle 56 (2.3)
One vehicle 1,005 (41.2)
Number of household vehicles (N=2,439)
Two vehicles 1,111 (45.6)
Three or more vehicles 267 (10.9)
Owns hybrid 765 (31.4)
Owns a hybrid vehicle (N=2,439)
Does not own hybrid 1,618 (66.3)
Table 1 shows the SED characteristics for the 2021 sample. Overall, the sample contains a large number of
Caucasian/White males ages 35–44 who are highly educated and come from high-income households. For example,
72% of respondents are male, 44% are between the ages of 35–44, 41% have a master’s degree, and 61% are from
households that earn more than $150K per year. The SED characteristics are not representative of the general
population of the United States, but are reflective of the survey design, which targeted high-income households with
full-time workers who frequently traveled by commercial airline service before COVID-19.
3Table 2 Most recent air trip.
Characteristic Category Number (%)
Business 1,811 (74.2)
Trip purpose (N=2,439)
Leisure 628 (25.8)
$1–$249 274 (11.2)
$250–$499 854 (35.0)
$500–$999 607 (24.9)
Airfare (N=2,439) $1,000–$2,499 375 (15.4)
$2,500–$4,999 92 (3.8)
$5,000 or more 66 (2.7)
I don’t know 171 (7.0)
I traveled alone 1,156 (47.4)
I traveled with 1 other person 767 (31.4)
I traveled with 2 other people 266 (10.9)
Travel party size (N=2,439)
I traveled with 3 other people 131 (5.4)
I traveled with 4 other people 65 (2.7)
I traveled with 5 or more other people 54 (2.2)
0 nights 38 (1.6)
1 night 174 (7.1)
2 nights 466 (19.1)
3 nights 579 (23.7)
Nights away on trip (N=2,439)
4 nights 350 (14.4)
5 nights 266 (10.9)
6 nights 147 (6.0)
7 or more nights 419 (17.2)
Economy or coach 963 (39.5)
Class of service (includes upgrades) (N=2,439) Premium economy 663 (27.2)
Business or first class 813 (33.3)
I drove myself 884 (36.2)
I had a friend or family member drive me 293 (12.0)
I took a taxi cab 330 (13.5)
Mode used to travel to origin airport (N=2,439)
I used a ride-hailing service (Lyft, Uber, etc.) 885 (36.3)
I took public transit 21 (0.9)
Other 26 (1.1)
Yes 722 (81.7)
Did they pay for parking at airport (N=884)
No 162 (18.3)
Less than $10 per day 120 (16.6)
$10–$19 per day 300 (41.6)
$20–$29 per day 143 (19.8)
Amount paid to park at airport (N=722)
$30–$39 per day 86 (11.9)
$40–$49 per day 42 (5.8)
$50 or more per day 31 (4.3)
My home 2,216 (90.9)
Other residence 36 (1.5)
Origin (N=2,439)
Business or office 180 (7.4)
Other 7 (0.3)
Little to no congestion 903 (37.0)
Amount of traffic congestion experienced in getting to the Minor congestion 980 (40.2)
airport (N=2,439) Moderate congestion 493 (20.2)
Heavy congestion 63 (2.6)
Picked up by someone else 553 (22.7)
Rental vehicle 530 (21.7)
Ride-hailing service (Uber, Lyft, etc.) 717 (29.4)
Mode used to arrive at final destination when landed at Taxi 362 (14.8)
destination airport Limo/executive car/town car 102 (4.2)
Shuttle/van 104 (4.3)
Public transit (bus, rail, trolley, etc.) 50 (2.1)
Other, please specify 18 (0.7)
4Table 2 analyzes data regarding the individual’s most recent air trip taken. Individuals who indicated in the
screening questions that they had taken at least one business-related trip paid for by their company or an
organization in 2019 would be asked about their most recent business-related trip of this nature until a minimum
number of responses for business travel was obtained. Otherwise, the individual would be asked about their most
recent leisure trip that they paid for personally. Based on the responses collected as of April 7, 2021, 74.2% were
based on a most recent reimbursed business trip.4 A majority of the airfare for the respondents fell in the range of
$250–$999 and 47.4% of respondents traveled alone. Most respondents were away from home for three nights
(23.7%) or less than three nights. While 39.5% of respondents flew in economy/coach class, almost two thirds of the
sample (60.5%) flew premium economy or first class; such a high proportion of respondents flying with more
premium services makes sense given the SED characteristics uncovered in Table 1. With respect to modes used to
travel to the origin airport, 36.2% of respondents drove themselves, 12% had a family member drive them, and
36.3% used a ride-hailing service. Of those who paid to park at the airport, 58.2% paid $19 or less per day. The
majority of respondents (90.9%) started the trip to the airport from their home. Upon arrival to their destination after
the flight, 21.7% used a rental vehicle, 22.7% were picked up by someone else, and 29.4% used a ride-hailing
service.
Table 3 Perceptions of features of eVTOL in the sample.
Characteristic Category Number (%)
Much less likely 132 (5.4)
Less likely 119 (4.9)
How much more or less likely would you be to fly in an eVTOL
Would not affect my decision 908 (37.2)
aircraft if it uses both fuel and batteries?
More likely 740 (30.3)
Much more likely 540 (22.1)
How much more or less likely would you be to fly in an eVTOL Much less likely 105 (4.3)
aircraft if it has a large parachute for the entire aircraft, so that you Less likely 102 (4.2)
and the aircraft could descend safely to the ground if there were an Would not affect my decision 617 (25.3)
emergency? More likely 872 (35.8)
Much more likely 743 (30.5)
Much less likely 107 (4.4)
How much more or less likely would you be to fly in an eVTOL
Less likely 79 (3.2)
aircraft if it has multiple propellers for redundancy in case of
Would not affect my decision 605 (24.8)
failures?
More likely 878 (36.0)
Much more likely 770 (31.6)
Much less likely 108 (4.4)
How much more or less likely would you be to use an air taxi to Less likely 69 (2.8)
travel to the airport if it had a ride guarantee? Would not affect my decision 660 (27.1)
More likely 917 (37.6)
Much more likely 685 (28.1)
Much less likely 466 (19.1)
Less likely 435 (17.8)
How much more or less likely would you be to fly in an air taxi if
Would not affect my decision 531 (21.8)
it were operated with certified autonomy?
More likely 561 (23.0)
Much more likely 446 (18.3)
Very unappealing 373 (15.3)
Somewhat unappealing 329 (13.5)
How appealing do you find the idea of using such a service for
Neither appealing/unappealing 523 (21.4)
daily commuting?
Somewhat appealing 699 (28.7)
Very appealing 515 (21.1)
Very unappealing 269 (11.0)
Somewhat unappealing 193 (7.9)
How appealing do you find the idea of using such a service for
Neither appealing/unappealing 484 (19.8)
occasional commuting?
Somewhat appealing 893 (36.6)
Very appealing 600 (24.6)
4
The final stage of the data collection obtained a larger proportion of responses for leisure trips.
5Table 3 Perceptions of features of eVTOL in the sample. (Continued)
Characteristic Category Number (%)
Very unappealing 215 (8.8)
Somewhat unappealing 176 (7.2)
How appealing do you find the idea of using such a service for
Neither appealing/unappealing 482 (19.8)
travel to a concert, sports event, or other large venue?
Somewhat appealing 858 (35.2)
Very appealing 708 (29.0)
Very unappealing 159 (6.5)
Somewhat unappealing 93 (3.8)
How appealing do you find the idea of using such a service for
Neither appealing/unappealing 365 (15.0)
sightseeing?
Somewhat appealing 899 (36.9)
Very appealing 923 (37.8)
Very unappealing 230 (9.4)
Somewhat unappealing 196 (8.0)
How appealing do you find the idea of using air taxis to travel
Neither appealing/unappealing 488 (20.0)
from home or work to your local airport?
Somewhat appealing 844 (34.6)
Very appealing 681 (27.9)
Very unappealing 202 (8.3)
Somewhat unappealing 151 (6.2)
How appealing do you find the idea of using air taxis to travel
Neither appealing/unappealing 486 (19.9)
from the airport you land at to your final destination?
Somewhat appealing 906 (37.1)
Very appealing 694 (28.5)
Very unappealing 192 (7.9)
How appealing do you find the idea of using air taxis to travel Somewhat unappealing 164 (6.7)
from your hotel/other destination to the airport for the flight Neither appealing/unappealing 469 (19.2)
home? Somewhat appealing 905 (37.1)
Very appealing 709 (29.1)
Never 232 (9.5)
In the 1st year of operation 748 (30.7)
Assuming air taxis are affordable, how long after air taxis enter
In the 2nd or 3rd year of operation 788 (32.3)
the market would you consider using one?
In the 4th or 5th year of operation 427 (17.5)
In the 6th year of operation/more 244 (10.0)
Would you move to a different location if you could regularly take I would move further from work 545 (22.3)
an eVTOL aircraft to and from work and the service were reliable I would move closer to work 274 (11.2)
and affordable? I would not move 1620 (66.4)
Very likely to own fewer 298 (12.2)
Would you change the number of vehicles your household owns Somewhat likely to own fewer 322 (13.2)
or leases if you could regularly take an eVTOL aircraft to work Most likely to own the same 1352 (55.4)
and the service were reliable and affordable? Somewhat likely to own more 233 (9.6)
Very likely to own more 234 (9.6)
Table 3 shows the distribution of responses associated with questions related to individuals’ perceptions about
eVTOL features, how appealing individuals find the idea of using an eVTOL for various trip purposes, how long
after market entry individuals may consider using an air taxi, and whether individuals would change their residential
location or auto ownership if they used an air taxi to regularly commute to work. With regard to eVTOL features,
52.4% of individuals noted they would be more likely or much more likely to take an eVTOL if it operated on both
batteries and fuel, 66.3% if it had a whole-aircraft parachute, 67.6% if it had multiple propellers for redundancy,
65.7% if it came with a ride guarantee, yet only 41.3% if the air taxi operated with certified autonomy. With respect
to different trip purposes, almost half (49.8%) stated they would find using an eVTOL for regular commuting
somewhat appealing or very appealing; 61.2% for occasional commuting; 64.2% for travel to a concert, sports event,
or other large venue; 74.7% for sightseeing; 62.5% for travel from home or work to a local airport; 65.6% for travel
from the destination airport to the final destination; and 66.2% for the return trip home traveling from a hotel/other
destination to the inbound airport. This indicates that individuals view the potential for using air taxis for a variety of
different trip purposes. With respect to adoption timeline, 9.5% indicated they would never use an air taxi, 30.7% in
the first year of operation, 32.3% in the second or third year of operation, 17.5% in the fourth or fifth year of
operation, and 10.0% in the sixth or later year of operation. This is important as it suggests that accounting for the
adoption timeline will be important for break-even analysis related to new air taxi service. Finally, there were
individuals who indicated they would move further from work (22.3%) and others who indicated they would move
6closer to work (11.2%) if they could regularly take an eVTOL aircraft to work. Similarly, there were individuals
who indicated they were very likely or somewhat likely to own fewer vehicles (25.4%) if they could regularly take
an eVTOL aircraft to work and other individuals who indicated they were very likely or somewhat likely to own
more vehicles (19.2%). This is important, as it indicates that the introduction of air taxi service may lead to
additional urban sprawl (through moving residences further from work), yet in other cases increase efficiency and
reduce emissions (through individuals moving closer to work and/or reducing the number of vehicles they own or
lease). However, the overall impacts on residential location choices and vehicle ownership remain unclear and
would be an interesting avenue for future research.
Table 4 Perceptions of features of self-driving cars in the sample.
Characteristic
How much more or less likely would you be to travel in a self- Category Number (%)
driving car, compared to a traditional car if…
Much less likely to take self-driving car 244 (10.0)
Less likely to take self-driving car 139 (5.7)
You own the self-driving car? Would not affect my decision 503 (20.6)
More likely to take self-driving car 765 (31.4)
Much more likely to take self-driving car 788 (32.3)
Much less likely to take self-driving car 249 (10.2)
Less likely to take self-driving car 252 (10.3)
You arrange for a pick-up from a rideshare company (such as
Would not affect my decision 721 (29.6)
Lyft or Uber) and travel alone?
More likely to take self-driving car 778 (31.9)
Much more likely to take self-driving car 439 (18.0)
Much less likely to take self-driving car 238 (9.8)
Less likely to take self-driving car 245 (10.0)
You arrange for a pick-up from a rideshare company (such as
Would not affect my decision 697 (28.6)
Lyft or Uber) and share with people you know?
More likely to take self-driving car 830 (34.0)
Much more likely to take self-driving car 429 (17.6)
Much less likely to take self-driving car 439 (18.0)
Less likely to take self-driving car 464 (19.0)
You arrange for a pick-up from a rideshare company (such as
Would not affect my decision 684 (28.0)
Lyft or Uber) and share with strangers?
More likely to take self-driving car 524 (21.5)
Much more likely to take self-driving car 328 (13.4)
Much less likely to take self-driving car 189 (7.7)
Less likely to take self-driving car 129 (5.3)
You could use your phone to talk, text, and access the internet? Would not affect my decision 594 (24.4)
More likely to take self-driving car 843 (34.6)
Much more likely to take self-driving car 684 (28.0)
Much less likely to take self-driving car 178 (7.3)
Less likely to take self-driving car 126 (5.2)
You could do work on your laptop? Would not affect my decision 651 (26.7)
More likely to take self-driving car 815 (33.4)
Much more likely to take self-driving car 669 (27.4)
Much less likely to take self-driving car 213 (8.7)
Less likely to take self-driving car 162 (6.6)
You could sleep? Would not affect my decision 652 (26.7)
More likely to take self-driving car 741 (30.4)
Much more likely to take self-driving car 671 (27.5)
7Table 4 Perceptions of features of self-driving cars in the sample. (Continued)
Characteristic Category Number (%)
Very unappealing 255 (10.5)
Somewhat unappealing 196 (8.0)
Based on the description provided so far, how appealing do
Neutral 279 (11.4)
you find self-driving cars?
Somewhat appealing 760 (31.2)
Very appealing 949 (38.9)
Very unlikely 318 (13.0)
Somewhat unlikely 260 (10.7)
Carefully considering your circumstances, how likely would
Neutral 311 (12.8)
you be to use a self-driving car for your own local travel?
Somewhat likely 789 (32.3)
Very likely 761 (31.2)
Very unlikely 430 (17.6)
Somewhat unlikely 292 (12.0)
Carefully considering your circumstances, how likely would
Neutral 348 (14.3)
you be to own a self-driving car for your own local travel?
Somewhat likely 707 (29.0)
Very likely 662 (27.1)
Never 222 (9.1)
In the 1st year of operation 685 (28.1)
Assuming self-driving cars are affordable, how long after self-
In the 2nd or 3rd year of operation 847 (34.7)
driving cars enter the market would you consider using one?
In the 4th or 5th year of operation 458 (18.8)
In the 6th year of operation/more 227 (9.3)
I would move further from work 505 (20.7)
Would you move to a different residential location if you could
I would move closer to work 280 (11.5)
regularly take a self-driving car to and from work?
I would not move 1654 (67.8)
Very likely to own fewer 379 (15.5)
Would you change the number of vehicles your household Somewhat likely to own fewer 362 (14.8)
owns or leases if you could regularly take a self-driving car to Most likely to own the same 1157 (47.4)
and from work? Somewhat likely to own more 289 (11.8)
Very likely to own more 252 (10.3)
Table 4 shows the distribution of responses associated with questions related to individuals’ perceptions about
self-driving car features. In general, individuals are more likely to take a self-driving car if they own the vehicle or if
they can arrange for a pick-up from a ride-hailing company and either travel alone or share with people they know.
The percentage of individuals who responded more likely or much more likely to take a self-driving car from a ride-
hailing service was 50% if traveling alone, 52% if traveling with people they knew, and just 35% if traveling with
strangers; in comparison, 64% were more likely to use a self-driving car if they owned it. Respondents were also
generally enthusiastic about the ability to be productive or do things other than driving in a self-driving car, with
63% responding likely or more likely to take a self-driving car if they could talk, text, or access the internet, 61% if
they could work on a laptop, and 58% if they could sleep. Overall, 70.1% of individuals indicated that they found
self-driving cars to be somewhat or very appealing (compared to 50% to 75% for air taxis depending on the trip
purpose). This is important, as it indicates that self-driving cars may compete more heavily with air taxis than
traditional cars. Interestingly, the adoption timelines and longer term residential location and vehicle ownership
decisions are similar for the introduction of air taxis and self-driving vehicles.
III. Methodology
Following the methodology described in Garrow et al. (2021), we first conducted two exploratory factor analyses
(EFAs): one involving the conceptual constructs related to eVTOL aircraft, and the second involving general
opinions about travel as well as personality and lifestyle constructs. Our related paper (Leonard, Garrow, and
Newman, 2021) provides a detailed description of each of these constructs along with references of related work that
have used these constructs.
In designing the attitudinal portion of the survey and conducting the subsequent analyses of this paper, we
followed the methodology used by Mokhtarian, Ory, and Cao (2009) in that we included at least one positively
oriented and at least one negatively oriented statement for each construct; the only exceptions were for the motion
sickness and travel productivity constructs, which did not naturally lend themselves to generating two statements.
Although the literature recommends including three to five statements for each construct (e.g., Fabrigar et al., 1999),
in view of the large number of constructs included on the survey, we followed the approach of Mokhtarian, Ory, and
8Cao (2009), consistent with the discussion in Dolnicar (2013), and limited the number of statements per initial
construct to two in most cases to reduce respondent fatigue. We also took into account the expectation that, since
some of the constructs were related, they were likely to combine in the empirical analysis, and indeed, all but two of
our final factors have three or more statements loading on them.
To condense the larger sets of interrelated statements into smaller sets of more distinct constructs that we could
include in later models, common factor analyses using oblique rotation were conducted using the SPSS® software
(IBM, 2021). To select a preferred factor solution, we first identified the number of factors with initial eigenvalue
greater than or close to 1 and examined the scree plot, which graphs the factor number against the percentage of
variance explained by the associated factor. The “elbow rule” was used with the scree plot to determine at which
point additional factors did not explain much variability in the data. We used information about the eigenvalues and
the scree plot to suggest a maximum number of factors to include in the final solution. We examined the pattern
matrix of the obliquely rotated factor loadings to evaluate whether the factor interpretations were intuitive, and we
inspected the factor correlation matrix to determine if any factors were highly correlated. We iterated through
several choices for number of factors to deal with interpretability issues, removed two items that had highly skewed
distributions for which more than 80 percent of respondents answered agree or strongly agree, and removed items
that did not load highly on any factor. Eventually, we settled on a final preferred solution for which all retained
items had loadings of at least 0.30 in magnitude on at least one factor; the 0.30 threshold for factor loadings is
consistent with the cutoff suggested by a number of factor analysis scholars in the context of exploratory attitudinal
measurement, including Child (1990) and Fabrigar, Wegener, MacCallum, and Strahan (1999). Bartlett scores on
each factor for each person were then produced and saved for subsequent analysis.
For the aircraft constructs, two factors had initial eigenvalues greater than 1 and the scree plot also revealed a
clear elbow at two factors. Given that the pattern matrix for this two-factor solution was intuitive and all statements
had loadings of 0.30 or higher, this was selected as our final preferred solution. The correlation between the
resulting two factor scores is −0.38; the correlation was −0.41 in the 2018 survey. Eigenvalues greater than 1,
loadings of 0.30, and this level of correlation are all within reason (see our working paper [Garrow et al., 2021] for
additional details on this methodology, including references from the literature justifying these values).
A. Calculation of Non-Mean-Centered Factor Scores
When factor scores are created, they are nearly always mean-centered (and often fully standardized). One
motivation for mean centering is the supposition that attitudes, being subject to context effects, social desirability
biases, and other sources of volatility, do not have an “absolute zero,” but rather can only be measured relative to the
attitudes of other people. We used the non-mean-centered (NMC) approach in our 2018 and 2019 surveys (Garrow
et al., 2021; Garrow et al., 2020), and that approach has been used by other researchers (Deng, Mokhtarian, and
Circella, 2015), as well. For consistency, we also used NMC scores for the 2021 airport taxi shuttle study.
To compute NMC factor scores, variables were first standardized by converting them to Z-items. Then the
original variables’ means were added back onto the Z-items so that the transformed variables still had unit variances,
but their distributions were now centered around the original means of the raw variables (rather than centered around
zero). Finally, because a simple horizontal shift does not change the association of the item with the factor, the un-
mean-centered Z-items were linearly combined, applying the same factor-score coefficients used to create the mean-
centered factors, to compute the NMC factors.
B. Cluster Analysis
Once the factor analysis was completed, we conducted a cluster analysis using the K-means clustering technique
in SPSS (IBM, 2021) on the aircraft constructs to identify market segments that differed along two factor
dimensions labeled Concern and Enthusiasm for eVTOL air taxis. In order to compare results with the 2018 and
2019 surveys, we estimated a six-cluster solution, which we present in Section IV.
C. Chi-square Analysis and ANOVA
We conducted statistical tests of the differences found between clusters. For discrete-valued characteristics, such
as gender, we used a Pearson’s χ2 test to identify whether the distribution of the characteristics differed by cluster.
For (quasi-)continuous-valued variables, a one-way analysis of variance (ANOVA) was performed to determine
whether the means of each characteristic differed across clusters.
9IV. Results
In this presentation of results, we first discuss the factor analyses, then the cluster analysis, and finally how the
market segments relate to: (1) sociodemographic characteristics; (2) current air travel patterns; (3) perceptions of
eVTOL and self-driving car features; and (4) travel, personality, and lifestyle constructs.
A. Factor Analysis for Aircraft Constructs
Consistent with the 2018 and 2019 surveys, the factor analysis empirically identified two factors related to
eVTOL perception constructs: one which captured all the negatively oriented items (Concern) and one which
captured the positively oriented ones (Enthusiasm). As shown in Table 5, the statements “I would be concerned to
travel in a battery-operated aircraft,” “I would be concerned to fly in an aircraft that takes off and lands vertically
within a city with tall buildings,” and “These aircraft would cause more problems than they would solve” all loaded
onto the eVTOL Concern factor. Conversely, the statements “I like the idea of battery-powered aircraft for helping
the environment,” “I like that these aircraft can take off and land close to my home and work locations,” and “I
would find it exciting to travel in one of these eVTOL aircraft” all loaded onto the eVTOL Enthusiasm factor.
Table 5 Descriptive statistics, pattern matrix factor loadings, and factor score coefficients for eVTOL
Enthusiasm and Concern factors.
Concern Enthusiasm
Concern Enthusiasm
Factor Factor Std.
Description (Initial Construct) Factor Factor Mean
Score Score Dev.
Loading* Loading*
Coefficient Coefficient
I like the idea of battery-powered
aircraft for helping the 0.037 0.294 0.355 0.594 3.71 1.06
environment (Battery technology)
I would find it exciting to travel in one
of these eVTOL aircraft (Overall −0.020 0.448 0.330 0.715 3.67 1.13
impressions)
I like that these aircraft can take off
and land close to my home and −0.006 0.537 0.358 0.736 3.82 1.02
work locations (Proximity)
I would be concerned to travel in a
battery-operated aircraft (Battery 0.567 0.011 0.568 −0.478 3.50 1.14
technology)
These aircraft would cause more
problems than they would solve 0.397 −0.040 0.433 −0.515 3.25 1.17
(Overall impressions)
I would be concerned to fly in an
aircraft that takes off and lands
0.460 0.047 0.581 −0.371 3.62 1.13
vertically within a city with tall
buildings (Proximity)
*Note: Rotated pattern matrix loadings (N=2,439).
B. Factor Analysis for Travel, Personality, and Lifestyle Constructs
The 2021 air taxi survey contained 32 attitudinal statements associated with 14 travel, personality, and lifestyle
statements, as shown in Table 6. Twelve statements were added related to Opinions about Travel, eleven statements
were added related to Opinions about Air Travel, and nine statements were related to Lifestyle and Attitudes. For
details about these statements, see our related paper by Leonard, Garrow, and Newman (2021).
10Table 6 Rotated factor loadings (pattern matrix) by original statement category for travel opinions,
personality, and lifestyle constructs (N=2,439).
Factor Loadings
Car
Survey Statement Sociable Need
Tech. Pro- Over Time
and for Pro-Car
Cautious Ride-hail Self- Anxious
Techy Control
Drive
(1) Pro-Collective Modes
I am fine with not owning a car, as long
– – – – – – −0.407
as I can use/rent one any time I need it
Using a ridesharing service, such as Lyft
– – 0.532 – – – –
or Uber, is more convenient than driving
Whenever practical, I prefer to drive
– – – – – – –
rather than take transit**
(2) Travel Sociability
I like meeting new people through
0.529 – – – – – –
ridesharing
I'm uncomfortable traveling in the same
– – – – 0.593 – –
car with strangers
I don’t mind sharing a ride with strangers
– – – – – – −0.595
if it reduces my costs
(3) Motion Sickness
I would tend to feel sick if I tried to read
– – – – 0.464 – –
while in a moving vehicle
(4) Pro-Environment
I rarely consider the impact on the
– – – – – – –
environment in my travel choices*
I limit my driving to help improve air
0.380 – – – – – –
quality
(5) Productivity
Even if I can use my travel time
productively, I still expect to reach my – – – – – – –
destination as fast as possible**
(6) Control
I would usually rather have someone else
– – – – – – –
who is trustworthy do the driving**
Being in a car makes me nervous if
– – – – 0.614 – –
someone else is driving
(7) Airport Mode Preference
I prefer to drive and park at or near the
– – −0.532 – – – –
airport
I prefer to take a ride-hailing service such
– – 0.731 – – – –
as Lyft or Uber to the airport
I prefer to have family or friends drop me
– – – – – – –
off at the airport*
I prefer to take public transit to the airport – – – – – – −0.411
(8) Air Mode Preference
I like traveling by airplane** – – – – – – –
Traveling by air makes me nervous – – – – 0.495 – –
Notes: Items marked with * did not load strongly on any factor and were removed from the final specification. Items marked with **
were excluded as more than 67% of respondents agreed or strongly agreed with the item.
11Table 6 Rotated factor loadings (pattern matrix) by original statement category for travel opinions,
personality, and lifestyle constructs (N=2,439). (Continued)
Factor Loadings
Car
Survey Statement Sociable Need
Tech. Pro- Over Time
and for Pro-Car
Cautious Ride-hail Self- Anxious
Techy Control
Drive
(9) Cost Sensitivity
I am willing to spend extra time getting to
and from the airport in order to save – – – – – – −0.421
money
I like getting to and from the airport as
quickly as possible, even if it costs – – – – – – –
more**
(10) Pro-AV Attitude
Self-driving cars are appealing to me
because they will allow me to use my
– – – −0.593 – – –
travel time to the airport more
productively
Self-driving cars are appealing to me
since I would not need to park at or near – – – −0.948 – – –
the airport
Driving is safer overall than using a self-
– – – 0.372 – – –
driving car
(11) Early Adopter
I like to wait a while rather than being the
– 0.659 – – – – –
first to buy a new product
I often introduce new trends to my friends
0.714 – – – – – –
or family
(12) Privacy Concern
I like that companies can tailor products
to my preferences, even if it requires me – – – – – – –
to provide personal information**
I’m concerned that technology invades
– 0.548 – – – – –
my privacy too much
(13) Status-Oriented
For me, a lot of the fun of having
0.671 – – – – – –
something nice is showing it off
When making a purchase, I value
functionality more than the status of its – – – – – – –
brand**
(14) Time Pressure
I feel as if I need to make the most of
0.629 – – – – – –
every minute
Having to wait can be a useful pause in a
– 0.404 – – – −0.351 –
busy day
Having to wait is an annoying waste of
– – – – – 0.688 –
time
Notes: Items marked with * did not load strongly on any factor and were removed from the final specification. Items marked with
** were excluded as more than 67% of respondents agreed or strongly agreed with the item.
As part of the exploratory analysis, we excluded seven items for which more than 67% of individuals responded
agree or strongly agree. These included the following statements: (1) “I would usually rather have someone else who
is trustworthy do the driving”; (2) “Whenever practical, I prefer to drive rather than take transit”; (3) “Even if I can
use my travel time productively, I still expect to reach my destination as fast as possible”; (4) “I like getting to and
from the airport as quickly as possible, even if it costs more”; (5) “I like traveling by airplane”; (6) “I like that
companies can tailor products to my preferences, even if it requires me to provide personal information,” and
(7) “When making a purchase, I value functionality more than the status of its brand.” These variables have strong
weights to the ‘agree’ and ‘strongly agree’ responses and draw away from the ability to select meaningful factors
12from the data; the data would be overfitted if included. Additionally, two statements—“I rarely consider the impact
on the environment in my travel choices” and “I prefer to have family or friends drop me off at the airport”—did not
have a loading on any factor higher than 0.30 in magnitude, and were thus excluded from final iterations. All
excluded variables are still shown in Table 6 for completeness.
Table 6 is helpful for evaluating the results of the factor analysis, specifically by visualizing the relationships
between the initially conceived constructs and the empirically derived ones, as well as which statements loaded onto
factors and how many times a particular statement loaded onto multiple factors.
Table 7 organizes the results by factor. The first, “Sociable, Techy, and Environmental,” includes statements that
show individuals in this group are more likely to be social, enjoy technology, and be concerned about the
environment. The second, “Technologically Cautious,” includes statements that indicate individuals associated with
this factor have more cautious attitudes toward new technology. There are several factors that indicate a preference
for a particular mode, including the Pro-Ride-hail factor, the Car Over Self-Drive factor, and the Pro-Car factor.
Two other factors are associated with Need for Control and Time Pressure.
Table 7 Description of the item loadings on the seven empirically identified factors.
Factor
Original survey statements organized by the seven empirically identified factors
Loadings
Sociable, Techy, and Environmental
I often introduce new trends to my friends or family 0.714
For me, a lot of the fun of having something nice is showing it off 0.671
I feel as if I need to make the most of every minute 0.629
I like meeting new people through ridesharing 0.529
I limit my driving to help improve air quality 0.380
Technologically Cautious
I like to wait a while rather than being the first to buy a new product 0.659
I’m concerned that technology invades my privacy too much 0.548
Having to wait can be a useful pause in a busy day 0.404
Pro-Ride-hail
I prefer to take a ride-hailing service such as Lyft or Uber to the airport 0.731
Using a ridesharing service, such as Lyft or Uber, is more convenient than driving 0.532
I prefer to drive and park at or near the airport −0.532
Car Over Self-Drive
Self-driving cars are appealing to me since I would not need to park at or near the airport −0.948
Self-driving cars are appealing to me because they will allow me to use my travel time to the airport
−0.593
more productively
Driving is safer overall than using a self-driving car 0.372
Need for Control
Being in a car makes me nervous if someone else is driving 0.614
I'm uncomfortable traveling in the same car with strangers 0.593
Traveling by air makes me nervous 0.495
I would tend to feel sick if I tried to read while in a moving vehicle 0.464
13Table 7 Description of the item loadings on the seven empirically identified factors. (Continued)
Factor
Original survey statements organized by the seven empirically identified factors
Loadings
Time Pressure
Having to wait is an annoying waste of time 0.688
Having to wait can be a useful pause in a busy day −0.351
Pro-Car
I don’t mind sharing a ride with strangers if it reduces my costs −0.595
I am willing to spend extra time getting to and from the airport in order to save money −0.421
I prefer to take public transit to the airport −0.411
I am fine with not owning a car, as long as I can use/rent one any time I need it −0.407
Overall, although the factors did not reproduce the hypothesized constructs completely faithfully, the original
constructs recombined in logical ways to form the seven factors. These results are also generally consistent with
those found in our prior two surveys.
C. Cluster Analysis
Cluster analysis is used to identify market segments that have different profiles—in our case, specifically
profiles defined by attitudes toward eVTOL. The results of the factor analysis for the aircraft constructs provide a
useful framework for conceptualizing potential market segments. For example, individuals who have high
Enthusiasm and low Concern may be more likely to be early adopters of air taxi service, whereas those with high
Enthusiasm but high Concern may need incentives, and those with low Enthusiasm and high Concern may be late
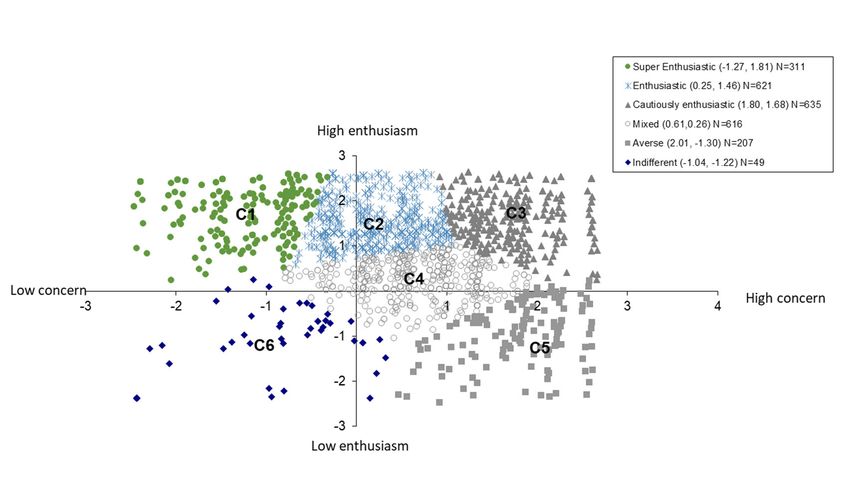
adopters or never adopt air taxi service. Those with low Concern and low Enthusiasm may be indifferent.
Figure 1 shows the six-cluster non-mean-centered solution for the 2021 survey. Compared to the 2018 and 2019
surveys, the 2021 survey has a larger percentage of individuals in the Cautiously Enthusiastic and Mixed segments
(51% compared to 34% and 41%) and smaller percentages in the Super Enthusiastic and Enthusiastic segments
(38% compared to 57% and 46%). The percentage of respondents in each of the six segments is shown in Table 8.
Figure 1 Six clusters using non-mean-centered factor scores (N=2,439) on 2021 survey.
14Table 8 Percentage of respondents in each cluster across the 2018, 2019, and 2021 surveys.
2018 Survey 2019 Survey 2021 Survey
Super Enthusiastic 22 19 13
Enthusiastic 35 27 25
Cautiously Enthusiastic 15 22 26
Mixed 19 19 25
Averse 6 11 8
Indifferent 3 1 2
D. Market Segmentation Analysis
We use χ2 and ANOVA analyses to identify whether particular segments have a higher or lower percentage of
individuals with a particular characteristic than other segments. Here, we focus on the interpretation of results,
summarized in Table 9. We omit a discussion of the Indifferent cluster, as it represents just 49 observations.
The Super Enthusiastic cluster is more likely to have younger individuals who are constantly on their smart
phones and who like the battery-powered features of the air taxis. These individuals are also more likely to be
associated with the Pro-Ride-hail segment and less likely to be associated with the Technologically Cautious, Car
Over Self-Drive, and Need for Control segments. The Enthusiastic cluster shares several characteristics with the
Super Enthusiastic cluster but does not have as many distinguishing features. Those in the Cautiously Enthusiastic
cluster are more likely to be between the ages of 35–44, have children, and be frequent ride-hailing and air travel
users. They are also more likely to own a hybrid and score lower on the Pro-Car factor. In contrast, the Mixed and
Averse clusters share several characteristics. Both groups are more likely to be older, have no children, be infrequent
users of ride-hailing services, and travel by air infrequently. The Averse group is more likely to be female and rarely
use smart phones or wearable devices, and never post to Twitter, Facebook, or Instagram. Those in the Mixed
cluster are slightly more likely to use these technologies compared to those in the Averse cluster. Those in the
Averse cluster tend to have higher scores on several factors including Car Over Self-Drive, Pro-Car, and
Technologically Cautious. Those in the Averse group are also more likely to have lower scores on the Pro-Ride-hail
factor and the Sociable, Techy, and Environmental factor.
15Table 9 Characteristics associated with the NMC six-cluster solution.
Super Cautiously
Enthusiastic Mixed Averse
Enthusiastic Enthusiastic
Gender Female
Age 18–24 35–44 Older Older
Children Yes Yes No No
Hybrid vehicle More likely to own a Less likely to own Less likely to own
ownership hybrid a hybrid a hybrid
Air taxi features Battery-powered Battery-powered
Once per week or
Ride-hail Less than once a
two to three times Never
frequency month or never
per month
Air travel Less than one Less than one RT*
Frequent air travel
frequency RT* per year per year
Constantly use smart
Rarely use smart
phone or wearable
Sometimes or phone or wearable
device; constant or
Constantly use Constantly use often use smart device; never post
Technology use daily posts to Twitter
smart phone smart phone phone; rarely use to Twitter,
and Instagram;
wearable device Facebook, or
constant posts to
Instagram
Facebook
Higher scores on
Car Over Self-
Lower scores on
Drive, Pro-Car,
Tech Cautious,
and Tech. Cautious
Car Over Self-
Higher score on factors; lower
Drive, and Need Lower score on
Constructs Pro-Ride-hail scores on Pro-
for Control Pro-Car factor
factor Ride-hail factor
factors; higher
and Sociable,
score on Pro-Ride-
Techy, and
hail factor
Environmental
factors
*RT=round trip.
In summary, the market segments are quite intuitive and consistent between the 2018 and 2019 surveys. In
general, those who are more enthusiastic and less concerned about eVTOL are more comfortable with technology
and have pro-ride-hailing and pro-environmental attitudes; the latter is consistent with the findings from Airbus
(Thompson, 2018). We also find evidence that likely early adopters are more apt to be frequent ride-hail users and
frequent air travelers. Those who are most averse to using air taxis tend to be older; women; rarely travel by ride-
hailing or air; and rarely or never use smart phones or wearable devices, or post to Twitter, Facebook, or Instagram.
V. Limitations and Future Research Directions
The focus of this paper is to describe potential market segments of demand for an urban air taxi commuting
solution. Respondents were drawn from seven cities representing somewhat distinctive characteristics, but results
may not generalize beyond these seven cities. Given that we oversampled individuals who have annual incomes
above $75K, our results may also not generalize to lower-income households. The segments identified in this study
have face validity and are based on the responses of a diverse sample within the target population. The segments are
also fairly consistent with those found in two prior studies we conducted.
The market segmentation developed in this paper will be valuable to the development of future quantitative
demand models. As a next step using the current survey results, we plan to estimate discrete choice models of
demand to understand consumers’ willingness to pay for an air taxi shuttle to the airport where self-driving cars are
in the market.
Acknowledgments
Funding for this research was provided by the National Institute of Aerospace, Contract NNL13AA08B, Task
Order Number 80LARC18F0000T with Laurie Garrow as Principal Investigator. The authors are grateful to Sharon
Dunn who copy edited the document prior to submission.
16References
[1] Binder, R., Garrow, L. A., German, B. J., Mokhtarian, P., Daskilewicz, M. J., and Douthat, T.D. “If You Fly It,
Will Commuters Come? Predicting Demand for eVTOL Urban Air Trips.” Proceedings from the American
Institute of Aeronautics and Astronautics, Atlanta, GA, 2018a pp. 1–41.
[2] Child, D. The Essentials of Factor Analysis, 2nd ed. Cassell Educational Limited, London, 1990.
[3] Deng, H., Mokhtarian, P. L., and Circella, G. Modeling the Adoption of Full-day, Part-day, and Overtime
Telecommuting: An Investigation of Northern California Workers Using Non-mean-centered Factor Scores to
Segment on Built Environment Attitudes. Paper presented at the 94th Annual Meeting of the Transportation
Research Board, Washington, DC, 2015 (available from the authors).
[4] Dolnicar, S. “Asking Good Survey Questions.” Journal of Travel Research, Vol. 52, No. 5, 2013, pp. 551–
574.
[5] eVTOL News™. Electric VTOL News™ by the Vertical Flight Society, 2021, URL: http://evtol.news/.
[6] Fabrigar, L. R., Wegener D. J., MacCallum, R. C., and Strahan, E. J. “Evaluating the Use of Exploratory
Factor Analysis in Psychological Research.” Psychological Methods, Vol. 4, 1999, pp. 272–299.
[7] Garrow, L. A., Mokhtarian, P. L., German, B. J., and Glodek, J. S. Market Segmentation Analysis for an
Electric Vertical Take-off and Landing Air Taxi Commuting Service in Five Large U.S. Cities. Atlanta, GA,
2021 (working paper, under review).
[8] Garrow, L. A., Mokhtarian, P. L., German, B. J., and Boddupalli, S. -S. “Commuting in the Age of the Jetsons:
A Market Segmentation Analysis of Autonomous Ground Vehicles and Air Taxis in Five Large U.S. Cities.”
Proceedings from the American Institute of Aeronautics and Astronautics, Reno, NV, 2020, p. 18.
[9] Garrow, L. A., Mokhtarian, P., German, B. J., Glodek, J., and Boddupalli S. -S. “If You Fly It, Will
Commuters Come? Predicting Demand for eVTOL Urban Air Trips.” Proceedings from the American Institute
of Aeronautics and Astronautics, Dallas, TX, 2019, pp. 1–45.
[10] IBM. SPSS® Statistics. Version 26, 64-bit edition, 2021.
[11] Leonard, C. E., Garrow, L. A., and Newman, J. P. “A Survey to Model Demand for eVTOL Trips to Airports.”
Proceedings from the American Institute of Aeronautics and Astronautics Sci-Tech Forum (virtual event),
2021, pp. 47.
[12] Mokhtarian, P. L., Ory, D. T., and Cao, X. “Shopping-related Attitudes: A Factor and Cluster Analysis of
Northern California Shoppers.” Environment and Planning B: Planning and Design, Vol. 36, 2009, pp. 204–
228. Included in Cluster Analysis, eds. David Byrne and Emma Uprichard, Sage Benchmarks in Social
Research Methods series, Sage Publications, 2011.
[13] Pronello, C., and Camusso, C. “Travellers’ Profiles Definition using Statistical Multivariate Analysis of
Attitudinal Variables.” Journal of Transport Geography, Vol. 19, 2011, pp. 1294–1308.
[14] Thompson, M., “Panel: Perspectives on Prospective Markets.” Proceedings of the 5th Annual AHS
Transformative VTOL Workshop, San Francisco, CA, 2018, URL: https://vtol.org/news/5th-annual-
transformative-vtol-workshop.
17You can also read