DNA Chips: Genes to Disease - Using Microarrays to Study Genes Involved in Lung Cancer
←
→
Page content transcription
If your browser does not render page correctly, please read the page content below
21-1520

  DNA Chips:
Genes to Disease
Using Microarrays to Study Genes
    Involved in Lung Cancer
      TEACHER’S MANUAL WITH STUDENT GUIDE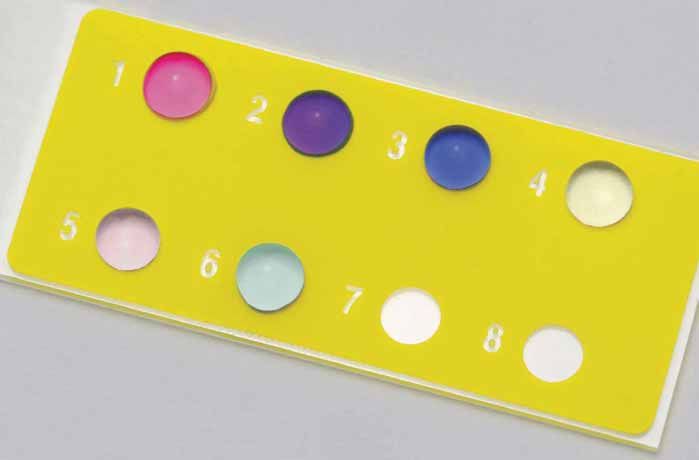
DNA Chips: Genes to Disease
Teacher’s Manual
Objectives . . . . . . . . . . . . . . . . . . . . . . . . . . . . . . . . . . . . . . . . . . . . . . . . . . . . . . . . . . . . . . . . . . . . 3
Curriculum Alignment . . . . . . . . . . . . . . . . . . . . . . . . . . . . . . . . . . . . . . . . . . . . . . . . . . . . . . . . . . 3
Background . . . . . . . . . . . . . . . . . . . . . . . . . . . . . . . . . . . . . . . . . . . . . . . . . . . . . . . . . . . . . . . . . . . 3
Kit Components . . . . . . . . . . . . . . . . . . . . . . . . . . . . . . . . . . . . . . . . . . . . . . . . . . . . . . . . . . . . . . . 5
Microarray Unit Overview . . . . . . . . . . . . . . . . . . . . . . . . . . . . . . . . . . . . . . . . . . . . . . . . . . . . . . . 5
   Timetable . . . . . . . . . . . . . . . . . . . . . . . . . . . . . . . . . . . . . . . . . . . . . . . . . . . . . . . . . . . . . . . . . . 5
   Teacher Information for the Microarray Simulation on Day 2 . . . . . . . . . . . . . . . . . . . . . . . . . 6
      Expected Experimental Results . . . . . . . . . . . . . . . . . . . . . . . . . . . . . . . . . . . . . . . . . . . . . . 7
      Teacher Preparation on the Day of the Lab. . . . . . . . . . . . . . . . . . . . . . . . . . . . . . . . . . . . . 7
Copy of Student Guide for the Microarray Simulation (with teacher notes and answers italicized)
   Prelab Review Questions . . . . . . . . . . . . . . . . . . . . . . . . . . . . . . . . . . . . . . . . . . . . . . . . . . . . . . 7
   Procedure . . . . . . . . . . . . . . . . . . . . . . . . . . . . . . . . . . . . . . . . . . . . . . . . . . . . . . . . . . . . . . . . . . 8
      Prepare the simulated microarray slide . . . . . . . . . . . . . . . . . . . . . . . . . . . . . . . . . . . . . . . . 8
      Hybridize your microarray . . . . . . . . . . . . . . . . . . . . . . . . . . . . . . . . . . . . . . . . . . . . . . . . . . 9
      Visualize your labeled microarray results . . . . . . . . . . . . . . . . . . . . . . . . . . . . . . . . . . . . . . . 9
      Cleanup . . . . . . . . . . . . . . . . . . . . . . . . . . . . . . . . . . . . . . . . . . . . . . . . . . . . . . . . . . . . . . . 10
   Extensions of the Microarray Unit . . . . . . . . . . . . . . . . . . . . . . . . . . . . . . . . . . . . . . . . . . . . . 10
   Analysis of Results . . . . . . . . . . . . . . . . . . . . . . . . . . . . . . . . . . . . . . . . . . . . . . . . . . . . . . . . . . 10
Answer Keys
   Microarray Worksheet . . . . . . . . . . . . . . . . . . . . . . . . . . . . . . . . . . . . . . . . . . . . . . . . . . . . . . . 12
   Using Microarrays to Study Genes Involved in Cancer: A Paper Microarray Exercise . . . . . 13

Photocopy Masters for the Student Guide
Background . . . . . . . . . . . . . . . . . . . . . . . . . . . . . . . . . . . . . . . . . . . . . . . . . . . . . . . . . . . . . . . . . S-1
Using Microarrays to Study Genes Involved in Cancer: A Paper Microarray Exercise . . . . . . . S-3
The Microarray Simulation—Wet Lab . . . . . . . . . . . . . . . . . . . . . . . . . . . . . . . . . . . . . . . . . . . S-11

This kit was developed by Ben Kittinger and A. Malcolm Campbell, Davidson College Biology Department,
with modifications by Genisphere.
The paper microarray exercise was developed by Carolyn A. Zanta, who retains copyright for that portion.

© A. Malcolm Campbell and Genisphere
TEACHER’S MANUAL DNA CHIPS: Genes to Disease
Objectives
The purpose of this simulation activity is to teach the following:
• DNA microarrays are a powerful emerging technology that scientists use to measure the activity
(transcription) of thousands of genes at one time.
• Genes are “differentially regulated”: All cells in an organism contain the same genes*, but different genes
are expressed (transcribed) in different tissues under different conditions. This is what gives different
tissues their different phenotypes (appearance and function).
*Note: Gametes contain half of the genes that somatic cells do, and enucleated cells (such as mature red
blood cells) do not contain genes.
• Even genes that are not highly expressed (transcribed) may play an important role in the cell. The lack of
expression of a certain gene may also play an important role in the cell.
• Microarrays highlight important connections between genetics, cell biology, genes, DNA, chromosomes,
gene expression, transcription, cancer biology, proteins, technology, and bioethics. Microarray analysis can
also be used to integrate math into the biology curriculum.
Curriculum Alignment
Integration of DNA Microarrays into the High School Curriculum
Microarray activities can be easily integrated into secondary school biology units on genetics, cell biology, DNA, or
biotechnology. Since microarrays touch upon a variety of concepts (including transcription, differences in gene
expression, genetics, cell biology, biotechnology, DNA hybridization, new technologies, cancer biology, and
bioethics), a microarray unit can provide a framework to help students understand the connections between these
concepts. As described in this laboratory, a complete microarray unit can be carried out in two short class periods.
Content Standards
The concept of microarrays and their use integrates many different areas of science typically covered in the
high school curriculum, including genetics/heredity, cell biology, DNA/biotechnology, technology and society,
mathematics, and computer science. In addition to content knowledge, the science skills addressed in the
activities include applying scientific knowledge, analyzing and interpreting data to solve problems, working
together in a group with a common goal, and communication skills. Additional extension activities could
include ethical debates on the use of microarray data. These concepts are the framework of most state science
content standards and can be aligned to the 1996 National Science Education Standards (NSES) for Science
Content developed by the National Research Council. The microarray activities align to the following NSES
Science Content Standards for grades 9–12: Science as Inquiry (A), Life Sciences (C), Science and Technology
(E), Science in Personal and Social Perspectives (F), and History and Nature of Science (G).
Background
Microarray analysis is a powerful new research tool that enables technicians to view and interpret at one time, on
one small surface, the extent to which thousands of genes have been expressed in cells. Researchers developed
and continue to refine the technology by merging strides in genomics, computer science, and nanotechnology.
Detecting patterns or changes in transcription in cells is a way to understand both normal and abnormal
aspects of cell function. A researcher who wanted to look for changes in transcription in a specific cancer tissue
3DNA CHIPS: Genes to Disease TEACHER’S MANUAL
could use microarray analysis. As the first step in this process, a gene chip would be created. DNA chip,
microarray, gene chip, and genome chip are all terms that describe a solid matrix, such as a glass slide, that is
imprinted with a precisely arranged pattern of spots, each made up of many copies of a specific oligonucleotide
representing part of a genome (e.g., a human genome).
As the next step, the DNA chip would be used to analyze complementary DNAs (cDNAs) that were made from
mRNA isolated from cancerous and noncancerous parts of the same tissue. The cancerous and noncancerous
DNA samples are flagged with dyes and applied to the prepared chip. The extent to which each flagged gene
adheres to its complement on the chip directly indicates the extent to which transcription occurred. Computer
analysis of the DNA chip reveals which genes were transcribed in the cancerous tissue and which in the normal
tissue, and thus indicates which genes might be important in the development of the cancer. The use of a
microarray in this application allows suspect genes to be identified years sooner that would have been possible
with previous technologies that were unable to analyze so many genes so precisely at one time.
Gene Expression = Transcription into RNA and Translation into Protein
Transcription Translation
DNA (gene) RNA Protein
(Phenotype / Appearance)
Induced (Expressed) Gene: Repressed (not Expressed) Gene:
×
Transcription
Gene X Lots of mRNA X Gene Z no mRNA Z
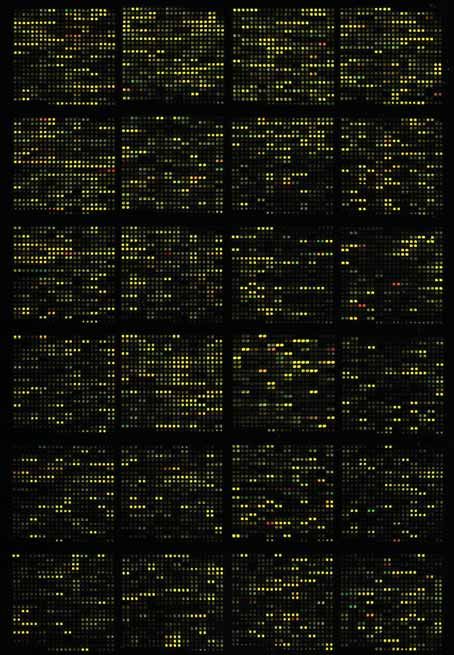
Gene Expression and Cancer
A single microarray can contain more than 30,000 spots of DNA, each representing a different gene in an
organism. In this laboratory, you will use a DNA microarray (“gene chip”) to study the expression of six
different genes in normal lung cells and lung cancer cells. These results will show how these six genes are
transcribed in normal vs. cancerous lung cells.
Scientists have found that some genes are not transcribed as much in cancer cells as in normal cells. These
repressed genes may play an important role in allowing the cancer cells to spread and grow. Other genes are
transcribed more in cancer cells than normal cells. These genes may also play an important role in making the cells
cancerous. There are also many genes that are transcribed at the same level in both cancer cells and normal cells.
These genes probably do not play a significant role in causing cells to become cancerous. There are also some genes
that may not be expressed at all in normal or cancerous lung cells. Can you think of any examples of these?
Additional Background
Dr. Malcolm Campbell's yeast microarray animation
http://www.bio.davidson.edu/courses/genomics/chip/chip.html
Longer, interactive DNA microarray animation
http://gcat.davidson.edu/Pirelli/index.htm
The Genome consortium for Active Teaching
www.bio.davidson.edu/GCAT
4TEACHER’S MANUAL DNA CHIPS: Genes to Disease
DNA Chips: From Genes to Disease at GCAT
http://www.bio.davidson.edu/projects/GCAT/HSChips/Hschips.html
Realistic DNA Chip Animation
http://gslc.genetics.utah.edu/units/biotech/microarray/
Mrs. Kathleen Gabric's Microarray Background Introduction
http://www.hinsdale86.org/staff/kgabric/labsOnline/Microarrayer2.doc
Data Analysis web page for DNA Chips: From Genes to Disease
(Quantifying Gene Chip Colors-math exercise)
http://www.bio.davidson.edu/projects/GCAT/HSChips/hs_kit_math_module_v2.pdf
HHMI Microarray Resources (BioInteractive)
www.hhmi.org/biointeractive/genomics/genechipdata/index.html
Kit Components
• 10 glass slides (can be washed and reused; must be dry before reusing)
• 6 dropper bottles, Genes 1–6 (contents represent gene sequence for spotting onto the “DNA chips”)
• 2 dropper bottles, hybridization solution (each containing the same labeled “cDNA mixture”)
• Microarray Worksheets
• Student Guide is a reproducible portion of this manual (Duplicate as needed for your class.)
Warning: The Hybridization Solution contains 0.4 M sodium hydroxide (NaOH), which is toxic and can
cause burns. Do not get the solutions in eyes, on skin, or on clothing. Wear suitable eye
protection and gloves.
First Aid: In case of contact: flush with water. Ingestion or eye contact: seek medical attention
Additional Materials Required
• blue and red markers
• red and blue paper (optional)
• scissors
• hot water bath, or hotplate with shallow pan for water (for melting agarose solutions)
• gloves and goggles (for safety with hot agarose and with hybridization solution)
• camera, or colored pencils/markers (for recording results and documenting data)
• float or rack (for holding dropper bottles upright while heating)
Microarray Unit Overview
The major parts to this microarray unit are an introduction, a pre-lab paper activity, and a hands-on
“microarray” lab that mimics a real DNA microarray. Thorough coverage of these microarray activities requires
two 45-minute class periods.
5DNA CHIPS: Genes to Disease TEACHER’S MANUAL
Timetable
Day 0:
Homework: To introduce the students to the concept of microarrays, have them view online microarray
animations (e.g., http://www.bio.davidson.edu/courses/ genomics/chip/chip.html, or others listed in the
Additional Background section.). After students view the animations, have them read and complete the
Microarray Worksheet on an experiment comparing gene expression in soybean plants grown in high CO2
levels to gene expression in those grown in normal air. You can also use the worksheet as a final assessment
of what the students have learned.
Day 1:
Class Activity (35–40 minutes): Working in small groups, students carry out a paper microarray
simulation, “Using Microarrays to Study Genes involved in Cancer.” Upon completion, groups discuss the
results and answer questions about the activity.
Class Discussion (10–15 minutes): With input from the class, record how many paper strips (cDNAs) of
each color were hybridized to each spot. Then, facilitate a discussion of how the paper microarray showed
differences in gene expression, why gene expression is important, and how gene expression relates to
cancer. This guided discussion is critically important for the students' understanding of microarrays and
gene expression.
Homework: Give students instructions for the lung cancer “microarray” laboratory and have them
complete the Pre-lab Review Questions and outline the laboratory procedure.
Day 2:
Class Activity (20–25 minutes): Have students carry out the lung cancer “microarray” wet-lab activity.
At the end of class, have groups share their results.
Class Discussion (10–15 minutes): Facilitate a discussion of what the results mean, and which genes are
most likely involved in lung cancer.*
Assessment Option: Use the Microarray Worksheet as a post-lab test to assess student understanding.
*It is important that you facilitate a thorough discussion of microarray results with the students. Regarding
the cancer cell example, often students have a naïve view that the only important genes with respect to
cancer are those that are highly expressed in cancer cells. Without adequate discussion, this misconception
may be perpetuated. You must ensure that the following points are addressed:
• Genes that are highly expressed in normal cells (but not expressed in cancer cells) may play an
important role in preventing cancer from developing (e.g., P53).
• Genes that are expressed at low levels may still play an important role in the cell; their mRNA and
protein may be needed only at low levels (e.g., P450 oxidases).
• Housekeeping genes are those that are important for basic cellular functioning and are expressed in
both types of cells. These genes are described as being “constitutively expressed.”
Teacher Information for the Microarray Simulation on Day 2
Introduction to the Lab
The wet-lab activity on Day 2 will simulate some of the basic elements of a real DNA microarray experiment,
but on a macro scale. Of course, on a real microarray, the spots are so small that they must be analyzed using
6TEACHER’S MANUAL DNA CHIPS: Genes to Disease
special equipment. To contain cost, this simulation does not use DNA. The colors observed (pink and blue) are
different from those seen in real microarray experiments. Conceptually, though, the simulation is similar to the
real experiment.
The six genes represented by the six samples are described on page S-12 of the Student Guide. The expected
experimental results are as follows:
Expected Experimental Results
Gene 1 = deep pink (gene induced in cancerous cells)
Gene 2 = purple (mixed pink and blue; gene equally transcribed in both cancerous and noncancerous cells)
Gene 3 = blue (gene repressed in cancerous cells)
Gene 4 = blank (gene not transcribed in either cancerous or noncancerous cells)
Gene 5 = light pink (gene slightly induced in cancerous cells)
Gene 6 = light blue (gene slightly repressed in cancerous cells)
Teacher Preparation on the Day of the Lab
Before the lab, completely melt the contents of the bottles containing Genes 1–6.* Do not use a microwave
oven. You can melt the agarose by standing or floating the dropper bottles in 70° C water for 15–45 minutes.
Make sure that the caps are tightly closed to avoid water leaking in. To avoid pressure buildup (and possible
bursting), vent the caps as the bottles warm. If the bottles start to bulge, vent them again. Closely monitor
and periodically swirl the bottles as the agarose is melting.
Allow 45 minutes of melting time before the students arrive. Then, maintain the bottles at 70° C to keep the
contents melted until the students use them.
*Do not heat the hybridization buffer!
Copy of Student Guide
for the Microarray Simulation
(with teacher notes and answers italicized)
Prelab Review Questions
1. What are the major steps in preparing a microarray experiment? List them in order.
a. Print DNA gene sequences onto a slide. (This is a time-consuming step that first requires the identification of
thousands of gene sequences. Most scientists purchase microarray slides from a company or university
biotechnology center that produces large quantities.)
b. Isolate mRNA from normal and “experimental” cells (in this lab activity, normal and cancer cells).
c. Prepare labeled cDNA from each of these mRNA samples.
d. Hybridize (bind) labeled cDNAs to the gene sequences printed on the slide. Complementary sequences will
bind to each other (G with C / A with T).
7DNA CHIPS: Genes to Disease TEACHER’S MANUAL
e. Visualize the results by viewing the different colors on the microarray.
f. Analyze the results and carry out further studies of the genes that are expressed or repressed under the
experimental conditions.
2. In this lab, we will study gene expression (transcription) in lung cancer cells as compared to that in normal
lung cells. The cDNA from lung cancer cells will be labeled pink, and the cDNA from normal cells will be
labeled blue. We are using atypical colors for our simulated microarrays. What three colors are seen in most
microarrays used in scientific research?
Red, green, and yellow.
3. If the cDNAs made from the lung cancer cells’ mRNA are labeled red, and the cDNAs made from the
normal cells’ mRNA are labeled green, for each of the situations below, describe what color you expect the
gene spot to be on a microarray:
GENE DESCRIPTION COLOR OF SPOT
A gene was expressed (transcribed) more in lung
Red (Pink, in our lab)
cancer cells than in normal lung cells
A gene was transcribed the same in both cells Yellow (Purple, in our lab)
A gene wasn't transcribed at all in either cell Black (Colorless, in our lab)
A gene was expressed (transcribed) more in normal
Green (Blue, in our lab)
lung cells than in lung cancer cells
Procedure
Part 1: Prepare the simulated microarray slide.
First, you will prepare your DNA microarray by spotting each of the six different gene sequences onto a glass
slide. For real microarrays, scientists actually print thousands of microscopic DNA spots onto a slide, one spot
for each gene they want to examine. Your spots will be much larger than those in a regular microarray, and you
will be able to view them without specialized equipment.
1. Do not touch the surface of your slide (handle it only by the edges). If the clear spots on the slide are not
already labeled, use the permanent marker to number six of them (1–6). Also, write your group number on
the frosted labeling area of the slide.
2. Bring your labeled slide to the waterbath area.
3. Method 1: Using the dropper bottles, carefully spot the appropriate gene solution onto each of the labeled
spots of your slide. Be sure to place the correct DNA sequence in the correct spot (i.e., Gene 6 needs to be
spotted on spot 6, etc.) and to place the same amount on each spot. Once the spots are hardened and dry,
your microarray has been successfully “printed” with the 6 genes!
or (your instructor will let you know which protocol to use)
Method 2: Set a micropipet to 30 µL. Measure 30 µL of solution from each of the numbered bottles and
place onto the corresponding spots on your slide. Use a different tip for each spot! Be sure to replace the
appropriate dropper bottle end into each bottle when you are finished.
8TEACHER’S MANUAL DNA CHIPS: Genes to Disease
Teacher Notes:
• If the dropper tip gets clogged, tap the bottle on a paper towel to dislodge the clog, or use a pin or paper clip to
break the agarose plug.
• The goal is to use a small drop that fills a circle on the slide but does not overflow. If a drop builds up to a dome,
that is fine, but not necessary.
• Tell the students that these spots are DNA sequences from six different genes. In spotting the slide this way, they
have performed the major steps of printing their own DNA microarray.
• The spots will harden in less than 1 minute. The microarray is ready to use as soon as all the drops harden.
Part 2: Hybridize your microarray with labeled cDNAs from normal lung tissue and lung
cancer tissue.
mRNA was isolated from normal lung cells, and the cDNA created for this mRNA was labeled with a blue dye.
mRNA from lung cancer cells was isolated, and its cDNA was labeled with a pink dye. You have been given a
bottle (to be shared between groups) containing a solution of labeled cDNAs from lung cancer cells and
normal cells mixed together. You will not be able to see these dyes until you visualize your results at the end of the
experiment.
In a real microarray, the principle behind the hybridization step is as follows: You cannot see the color because
the cDNA is very dilute. When added to the printed microarray slide, the labeled cDNAs in the solution will
base pair with the complementary DNA for each gene spotted onto the microarray. As each cDNA binds to
the appropriate DNA spot on the slide, the labeled cDNA becomes concentrated in that spot, allowing them to
be visualized by means of a sophisticated device.
Note: You must wear gloves and goggles. The hybridization solution contains 0.4 M sodium hydroxide
(NaOH), which is caustic and causes burns. Do not get it in your eyes, on your skin, or on clothing. If you feel
an itching sensation, wash that area of your skin in plenty of running water. Be sure to wash your hands after
the lab. If you get hybridization solution in your eyes, flood them with water and seek medical attention. Also
seek medical attention if you ingest any.
4. Carefully drop 1–2 drops of “Hybridization Solution” from the dropper bottle onto each spot. Do not allow
the dropper bottle to touch the DNA spots!
Teacher Note: Students must wear gloves and eye protection when handling the solution used in this simulation.
Part 3: Visualize your labeled microarray results.
Teacher Notes:
• The light blue and light pink spots may be very faint, but lightly colored when compared to the colorless spot.
• In a real microarray, the colors must be viewed by using a fluorescent scanner to measure the intensity of each spot
(to compare the extent to which a gene was expressed in each of the two samples).
• The colors in this simulated microarray are clear, pink, blue, and purple (to varying degrees). Actual microarrays
are black, red, green, and yellow, due to the colors of the fluorescent dyes used.
• The “gene spots” will slide off the glass if shaken or jolted. We recommend getting a photo as soon as
possible.
5. Record your results by writing a description of the color of each spot or drawing the results below. Your
teacher may also take a photo of your slide (be sure your group number is on the slide).
9DNA CHIPS: Genes to Disease TEACHER’S MANUAL
Clean up.
6. Use a paper towel to wipe off the six spots on your slide. Rinse your slide in water and dry it using a paper
towel. Wear gloves and eye protection; there is NaOH on the slide!
Extensions of the Microarray Unit
• Learn how to quantitate the results of your microarray by going to the following Web sites, which provide a
good way to integrate math into the lesson:
http://www.bio.davidson.edu/projects/GCAT/HSChips/hs_kit_math_module_v2.pdf
• Learn more about medical applications of microarrays in the diagnosis of two types of leukemia, AML and
ALL, from an activity in DNA Chips: A Genetics Lab in the Palm of Your Hand (in Modern Biology for
High School Classrooms - Snapshots of Science and Medicine Magazine):
http://science.education.nih.gov/newsnapshots/index.html
• Debate the ethical issues of DNA microarray use for medical and genetic testing. Affymetrix has supported
the development of several activities that can be accessed at the following Web site:
http://www.affymetrix.com/corporate/outreach/educator.affx.
• The genes that we used in this activity are actual genes. To learn more about these genes, you can search
for each gene name in the following database: http://www.ncbi.nlm.nih.gov/entrez/query.fcgi?db=gene.
• Analyze the gene expression profiles for the six genes used in the lung cancer activity by using the Stanford
Microarray Database (http://genome-www5.stanford.edu/MicroArray/SMD/) or by looking at the gene
sequences in the following database: http://www.ncbi.nlm.nih.gov/entrez/query.fcgi?db=gene.
• The actual microarray study of these genes is described in the following paper:
Garber, M. E., Troyanskaya, O. G., Schluens, K., Petersen, S., Thaesler, Z., Pacyna-Gengelbach, M., van de
Rijn, M., Rosen, G. D., Perou, C. M., Whyte, R. I., Altman, R. B., Brown, P. O., Botstein, D., and Petersen,
I. (2002) Diversity of gene expression in adenocarcinoma of the lung. Proc. Natl. Acad. Sci. 99(2): 1098.
Analysis of Results
See the front of the manual for a picture of expected results.
1. Which gene(s) were expressed (transcribed) in the lung cancer cells? How do you know?
Any spots that are pink or purple were expressed. In this lab, these are the following:
Gene 1. C4BPA (deep pink—gene highly expressed in lung cancer cells, but not expressed in normal lung cells)
Gene 2. ODC1 (purple—gene expressed both in lung cancer cells AND in normal lung cells)
Gene 5. SIAT9 (light pink—gene slightly expressed in lung cancer cells, but not expressed in normal lung cells)
2. Which gene(s) were not expressed in the lung cancer cells? How do you know?
Any spots that are not pink or purple were not expressed. In this lab, these are the following:
Gene 3. FGG (deep blue—gene highly expressed in normal lung cells, but not expressed in lung cancer cells)
Gene 4. HBG1 (colorless—gene NOT expressed in either lung cancer cells or normal lung cells)
Gene 6. CYP24 (light blue—gene slightly expressed in normal cells, but not expressed in lung cancer cells)
3. Were there any genes not expressed in either cell type? Explain what kind of gene this could be.
10TEACHER’S MANUAL DNA CHIPS: Genes to Disease
Yes. Gene 4. HBG1 (colorless—gene not expressed in either lung cancer cells or normal lung cells)
This represents a gene that is not expressed in lung tissue but is expressed in other tissues. For instance, Hemoglobin
(HBG1) would be expressed in bone marrow tissue. Also, the insulin gene would be expressed in pancreas tissue,
but not lung tissue.
4. Were there any genes expressed in both cell types? Explain what kind of gene this could be.
Yes. Gene 2. ODC1 (purple—gene expressed both in lung cancer cells and in normal lung cells)
This may represent a “housekeeping gene,” also called a constitutively expressed gene, which is necessary for basic
cellular functioning and is thus expressed in both types of cells. For instance, all cells require functioning
mitochondria for the production of energy. A mitochondrial gene would be considered a “housekeeping gene.”
5. Which genes may play a role in causing cancer in lung cells? Explain why you chose these genes and not
other genes.
Note: This is difficult for students to understand and requires explanation by the teacher.
Any spots that are expressed differently in normal vs. lung cancer cells. This includes genes expressed only in
normal cells and not in lung cancer cells, which may play an important role in preventing cancer from developing
(such as P53). It also includes genes that are expressed at low levels, since some gene products (proteins) are needed
in only very small quantities to produce a large effect (such as Cytochrome P450).
The only genes to be discounted would be the purple one (Gene 2) and clear one (Gene 4).
From our results, the following genes may play a role in cancer:
Gene 1. C4BPA. (deep pink—gene highly expressed in lung cancer cells, but not expressed in normal lung cells)
Gene 3. FGG. (deep blue—gene highly expressed in normal lung cells, but not expressed in lung cancer cells)
Gene 5. SIAT9. (light pink—gene slightly expressed in lung cancer cells, but not expressed in normal lung cells)
Gene 6. CYP24. (light blue—gene slightly expressed in normal cells, but not expressed in lung cancer cells)
6. Describe another microarray experiment that you would like to carry out. Be sure to include how you will
set up your experiment, what cells you will use, etc.
This is an open-ended question. Make sure students include an adequate control tissue.
11DNA CHIPS: Genes to Disease TEACHER’S MANUAL
Answer Keys
Microarray Worksheet
1. What is a microarray?
A microarray is a glass slide onto which distinct spots of different DNA sequences have been evenly spotted. Many
spots are present on a single microarray, and they are microscopic in size.
2. Describe one use of a microarray.
Answers may vary, but should include a subset of the following information or something very similar. Microarrays are
used to analyze the gene expression levels in two different populations of cells (i.e., to look at gene expression in plants
grown under different conditions, to look at gene expression in normal cells vs. cancer cells, etc.). This is done by
labeling cDNAs from two different groups of cells with two different dyes and hybridizing them to the microarrays.
3. Dr. Flora is studying the effects of high CO2 levels on soybeans. She grew one group of soybeans in regular
air and another group of soybeans in air with high CO2 levels. She
labeled the cDNA from soybeans grown in high-CO2 air with red dye 1 2 3
and the cDNA from soybeans grown in normal air with green dye.
Here are the results that she obtained from an experiment using a
soybean gene microarray:
4 5 6
Which spot or spots represent genes that were induced by elevated CO2.
The gene represented by spot 3 is induced by elevated CO2 .
Which spot or spots represent genes that do not show a difference in gene
expression in high CO2 levels vs. normal air. (Which sequences can Dr. Flora eliminate from further studies?)
Spots 2, 4, and 5 should be circled. Dr. Flora can eliminate genes 2, 4, and 5 from her study.
Explain your reasoning.
The spots representing sequences 2 and 4 are yellow. This indicates that both red and green cDNAs have bound to
this spot; thus, these genes are expressed in both the soybeans grown in high CO2 and in those grown in normal air.
The spot representing gene 5 is black (clear), indicating that this gene is not expressed under either condition.The
genes that will be most informative to study are those expressed differently under the two different conditions.
Put the following microarray technology steps in order. Write the numbers in the spaces below:
6 4 3 5 7 1 2
1. Analyze results by comparing colors of the spots on the microarray.
2. Identify genes that are expressed or repressed by high CO2 levels.
3. Isolate mRNA from soybeans grown in high CO2 levels and in normal air.
4. Spot soybean gene sequences onto a glass slide.
5. Create fluorescent-labeled cDNAs by reverse transcription.
6. Grow soybeans in high CO2 and normal atmospheric conditions for 1 month.
7. Bind cDNAs to complementary gene sequences on a glass slide.
12TEACHER’S MANUAL DNA CHIPS: Genes to Disease
Using Microarrays to Study Genes Involved in Cancer:
A Paper Microarray Exercise
Answers to the “Paper Microarray Analysis—Student Procedure” section.
1. Each research group will work with two different tissue samples (one normal, and one cancerous). First,
you must extract the mRNA from each sample. A problem with mRNA is that it is very unstable. Also, the
mRNA from the different samples cannot be distinguished. In order to distinguish the two sets of mRNA,
the mRNA must be converted into labeled cDNA (complementary DNA), through a process similar to the
transcription of mRNA from DNA. In this process, called “reverse transcription,” the cDNA is copied from
the mRNA template. In preparation for hybridizing to microarrays, the cDNA from the two types of tissue
is labeled with different fluorescent nucleotides (in this kit, either blue dye or red dye).*
*Note: In a real microarray, the dyes are green and red, and yellow is the color that indicates expression of both genes.
In this paper lab and the simulated wet lab in this kit, blue is used rather than green, and purple will indicate the
expression of both genes.
To review the process of converting mRNA to cDNA, complete the following problem in the space
provided. You extracted the following mRNA sequence (among thousands of other mRNAs) from
cancerous cells:
5′-CCUAUUGGAAUCGG-3′
What is the cDNA sequence that would be synthesized from this mRNA? Designate which end is 3′ and
which is 5′.
The cDNA sequence should be 3′-GGATAACCTTAGCC-5′
3. Your research group of 4–6 scientists has obtained a microarray slide containing 6 spots of DNA
oligonucleotides representing different human genes with unknown functions. How does this compare with
an actual microarray slide?
This paper “microarray slide” represents a simplified, close-up view of a real microarray slide. A real microarray
slide would be glass (or some other hard substance), would have thousands of spots on it, and the spots would be
microscopic in scale. In addition, each spot on a real microarray has multiple copies of the same cDNA on it, rather
than just the one representative copy shown on the paper microarray.
6. Read the microarray using an instrument that measures the fluorescence of each spot at the two different
wavelengths for blue (Cy3) or red (Cy5). Analyze the data to determine which genes (as represented by the
cDNA-bound oligos on the spots on the slide page) are expressed in each tissue sample and which are
expressed in both. On the microarray slide sheet, use markers to color each spot. The colors of the spots
will be as follows:
blue = The spot is bound to Cy3-labeled cDNA. What do these spots represent?
red = The spot is bound to Cy5-labeled cDNA. What do these spots represent?
purple = The spot is equally bound to both Cy3- and Cy5-labeled cDNA. These represent genes such as
“housekeeping genes” that are required by all cells.)
The blue spots represent genes that are expressed only in normal tissue. The red spots represent genes that are only
expressed in cancerous tissue.
©2004 Carolyn A. Zanta, UIUC-HHMI Biotechnology Education and Outreach Program (BEOP)
www.life.uiuc.edu/hughes/footlocker 13DNA CHIPS: Genes to Disease TEACHER’S MANUAL
7. Your group has obtained interesting results that may be useful in determining how cancer cells differ from
normal cells! The next step is to study those genes that appear to be important in your experimental cells
(in this case, the cancer cells.)
a. Which unknown gene sequences (#1–6) appear to belong to genes used in all cells?
The gene sequences on spots 3 and 5 appear to belong to genes used in all cells.
b. Which unknown gene sequences (#1–6) might belong to cancer-preventing genes?
The gene sequences on spots 1, 4, and 5 might belong to genes that are cancer preventative. (Note: The gene
represented by spot 5 is expressed in cancer cells, but the expression level is reduced.)
c. Which unknown gene sequences (#1–6) might be from genes that cause cells to become cancerous?
The gene sequences on spot 6 belong to genes that might cause cancer.
d. Are all of the genes expressed at the same level? How do you know this? What could this mean?
No, not all genes are expressed at the same level, as indicated by the fact that different numbers of cDNAs are
bound to the spots representing different genes. Students may come up with variations on the following answer
for the last part of this question. The observation that different genes are expressed at different levels, especially
with respect to the different levels seen in cancer cells vs. normal cells, suggests that the level of gene expression
is very important in regulating the cell.
©2004 Carolyn A. Zanta, UIUC-HHMI Biotechnology Education and Outreach Program (BEOP)
14 www.life.uiuc.edu/hughes/footlocker1 2 3
TEACHER’S MANUAL
www.life.uiuc.edu/hughes/footlocker
5′-GGGTAGCCTTGG-3′ 5′-CATGCATCCATG-3′ 5′-GGGGCCCTTTAA-3′
BLUE BLACK PURPLE
Highly expressed in normal cells only NOT expressed in either normal or Expressed equally in normal and
4 blue labeled cDNAs bound cancer cells cancer cells
Answer Key for Microarray Slide Sheet
No cDNAs bound 2 blue labeled and 2 red
labeled cDNA’s bound
4 5 6
©2004 Carolyn A. Zanta, UIUC-HHMI Biotechnology Education and Outreach Program (BEOP)
5′-GCATTTTAAAGG-3′ 5′-CCATCCTTATAG-3′ 5′-TATATATATATA-3′
LIGHT BLUE PURPLE/BLUE RED
Expressed in normal cells only Expressed in normal cells (4 blue Highly expressed in cancer cells only
2 blue labeled cDNAs bound labeled cDNAs bound) and 6 red labeled cDNAs bound
cancer cells (2 red labeled
cDNAs bound)
DNA CHIPS: Genes to Disease
15STUDENT GUIDE DNA CHIPS: Genes to Disease
DNA Chips:
Genes to Disease
Using Microarrays to Study Genes
Involved in Lung Cancer
STUDENT GUIDE
Background
Microarray analysis is a powerful new research tool that enables technicians to view and interpret at one time, on
one small surface, the extent to which thousands of genes have been expressed in cells. Researchers developed
and continue to refine the technology by merging strides in genomics, computer science, and nanotechnology.
Detecting patterns or changes in transcription in cells is a way to understand both normal and abnormal
aspects of cell function. A researcher who wanted to look for changes in transcription in a specific cancer tissue
could use microarray analysis. As the first step in this process, a gene chip would be created. DNA chip,
microarray, gene chip, and genome chip are all terms that describe a solid matrix, such as a glass slide, that is
imprinted with a precisely arranged pattern of spots, each made up of many copies of a specific oligonucleotide
representing part of a genome (e.g., a human genome).
As the next step, the DNA chip would be used to analyze complementary DNAs (cDNAs) that were made from
mRNA isolated from cancerous and noncancerous parts of the same tissue. The cancerous and noncancerous
DNA samples are flagged with dyes and applied to the prepared chip. The extent to which each flagged gene
adheres to its complement on the chip directly indicates the extent to which transcription occurred. Computer
analysis of the DNA chip reveals which genes were transcribed in the cancerous tissue and which in the normal
tissue, and thus indicates which genes might be important in the development of the cancer. The use of a
microarray in this application allows suspect genes to be identified years sooner that would have been possible
with previous technologies that were unable to analyze so many genes so precisely at one time.
Gene Expression = Transcription into RNA and Translation into Protein
Transcription Translation
DNA (gene) RNA Protein
(Phenotype / Appearance)
© A. Malcolm Campbell and Genisphere
S-1STUDENT GUIDE DNA CHIPS: Genes to Disease
Induced (Expressed) Gene: Repressed (not Expressed) Gene:
×
Transcription
Gene X Lots of mRNA X Gene Z no mRNA Z
Gene Expression and Cancer
A single microarray can contain more than 30,000 spots of DNA, each representing a different gene in an
organism. In this laboratory, you will use a DNA microarray (“gene chip”) to study the expression of six
different genes in normal lung cells and lung cancer cells. These results will show what genes have been
transcribed (expressed) to produce more messenger RNA in lung cancer cells than in normal lung cells and
what genes have been repressed from producing mRNA in the lung cancer cells (i.e., transcription is reduced).
Scientists have found that some genes are not transcribed as much in cancer cells as in normal cells. These
repressed genes may play an important role in allowing the cancer cells to spread and grow. Other genes are
transcribed more in cancer cells than normal cells. These genes may also play an important role in making the cells
cancerous. There are also many genes that are transcribed at the same level in both cancer cells and normal cells.
These genes probably do not play a significant role in causing cells to become cancerous. There are also some genes
that may not be expressed at all in normal or cancerous lung cells. Can you think of any examples of these?
Additional Background
Dr. Malcolm Campbell's yeast microarray animation
http://www.bio.davidson.edu/courses/genomics/chip/chip.html
Longer, interactive DNA microarray animation
http://gcat.davidson.edu/Pirelli/index.htm
The Genome consortium for Active Teaching
www.bio.davidson.edu/GCAT
DNA Chips: From Genes to Disease at GCAT
http://www.bio.davidson.edu/projects/GCAT/HSChips/Hschips.html
Realistic DNA Chip Animation
http://gslc.genetics.utah.edu/units/biotech/microarray/
Mrs. Kathleen Gabric's Microarray Background Introduction
http://www.hinsdale86.org/staff/kgabric/labsOnline/Microarrayer2.doc
Data Analysis Web page for DNA Chips: From Genes to Disease
(Quantifying Gene Chip Colors-math exercise)
http://www.bio.davidson.edu/projects/GCAT/HSChips/hs_kit_math_module_v2.pdf
HHMI Microarray Resources (BioInteractive)
www.hhmi.org/biointeractive/genomics/genechipdata/index.html
S-2STUDENT GUIDE DNA CHIPS: Genes to Disease
Using Microarrays to Study Genes Involved in Cancer:
A Paper Microarray Exercise
Objective
To offer students an interactive way to visualize how microarrays are used to study gene expression.
Below is a brief description of how microarrays are used in research labs. Following that, is a simplified
procedure for a paper microarray activity that mimics the procedure of the wet lab. In this paper activity, you
will experience the main concepts of working with DNA microarrays.
General Microarray Analysis Procedure
1. Obtain a microarray slide containing 70 bp oligonucleotide (DNA) sequences, each of which represents a
gene sequence in the genome of your favorite organism. Most scientists purchase these slides already
prepared. The DNA is bound in spots approximately 100 microns in diameter. Each slide contains
thousands of microscopic spots of DNA (each spot corresponds to a different gene sequence in the genome
of the cell type or organism you are examining; humans have ~25,000 genes). While the function may be
known for some of these gene sequences, many genes have unknown functions.
2. Extract mRNA from your experimental organism and your control organism for comparison. For example,
corn growing under drought conditions vs. corn growing in normal conditions, or tumor cells vs. normal
cells. Each sample will contain thousands of different mRNA sequences representing all of the genes
expressed in those cells.
3. Prepare fluorescently labeled cDNA copies of this mRNA. Label the cDNA created from each sample of
mRNA with different fluorescent nucleotides (either green Cy3 dye or red Cy5 dye). Denature the cDNA
to produce single-stranded DNA prior to the next step.
4. Hybridize the microarray slide with both the green- and red-labeled cDNAs. Each cDNA will bind to the
spots that have complementary sequences. Stringent conditions are used to ensure that the various cDNAs
are entirely complementary to the microarray spot sequences to which they hydridize.
5. Wash the slide to remove excess fluorescent cDNAs not bound to spots.
6. Read the microarray using an instrument that measures the fluorescence of each spot at the two different
wavelengths (for green Cy3 and red Cy5). Two images are created for each spot, but the instrument is
connected to a computer that integrates the data into a single image. The colors of the spots are as follows:
green = The spot is bound to Cy3-labeled cDNA. These spots represent genes that are
expressed in the tissue of cells whose mRNA was reverse transcribed into cDNA
labeled with Cy3 (the green dye).
red = The spot is bound to Cy5-labeled cDNA. These spots represent genes that are
expressed in the tissue of cells whose mRNA was reverse transcribed into cDNA
labeled with Cy5 (the red dye).
yellow = The spot is bound to BOTH Cy3- and Cy5-labeled cDNA. These represent
genes such as “housekeeping genes” that are required by all cells.
7. Analyze the data to determine which genes (represented by spots on the slide) are expressed in each cell
sample and which are expressed in both. The next step in functional genomic studies is to study in more
detail those genes that are differentially expressed in control vs. experimental conditions.
©2004 Carolyn A. Zanta, UIUC-HHMI Biotechnology Education and Outreach Program (BEOP)
www.life.uiuc.edu/hughes/footlocker S-3STUDENT GUIDE DNA CHIPS: Genes to Disease
Prepare cDNA Probe Prepare Microarray
“Normal” Tumor
RT/PCR
Label with
Fluorescent Dyes
Combine
Equal
Amounts
Hybridize
probe to
microarray SCAN
Microarray Technology
Figure 1. Using Microarray Technology to Study Gene Expression in Normal and Tumor Cells
(Daryl Leja, National Human Genome Research Institute)
©2004 Carolyn A. Zanta, UIUC-HHMI Biotechnology Education and Outreach Program (BEOP)
www.life.uiuc.edu/hughes/footlocker S-4STUDENT GUIDE DNA CHIPS: Genes to Disease
Paper Microarray Analysis—Student Procedure
You are part of a research group studying human genes involved in cancer. You have assisted with the Human
Genome Project and have identified genes likely to be involved in cancer by means of genetic database
comparisons and other computer analyses. You are aware of some genes with similar sequences in other
organisms, and you know the proteins they code for. On this basis, you can predict likely functions of the
human genes you have identified. However, you find many sequences with unknown functions. Your research
group believes that many of these unknown genes play a role in either the prevention of cancer in normal cells
or the proliferation of cancer cells in abnormal tissues.
In these post-genomics studies (research done after the human genome was sequenced), your group has
decided to use microarrays to compare gene expression in normal cells vs. abnormal, cancerous cells. Your goal
is to identify the genes that are expressed differently.
1. Each research group will work with two different tissue samples (one normal, and one cancerous). First,
you must extract the mRNA from each sample. A problem with mRNA is that it is very unstable. Also, the
mRNA from the different samples cannot be distinguished. In order to distinguish the two sets of mRNA,
the mRNA must be converted into labeled cDNA (complimentary DNA), through a process similar to the
transcription of mRNA from DNA. In this process, called “reverse transcription,” the cDNA is copied
from the mRNA template. In preparation for hybridizing to microarrays, the cDNA from the two types of
tissue is labeled with different fluorescent nucleotides (in this kit, either blue dye or red dye.)*
*Note: In a real microarray the dyes are green and red, and yellow is the color that indicates expression of both genes.
In this paper lab and the simulated wet lab in this kit, blue is used rather than green, and purple will indicate expression
of both genes.
To review the process of converting mRNA to cDNA, complete the following problem in the space
provided. You extracted the following mRNA sequence (among thousands of other mRNAs) from
cancerous cells:
5′-CCUAUUGGAAUCGG-3′
What is the cDNA sequence that would be synthesized from this mRNA? Designate which end is 3′ and
which is 5′.
Note: Remember that because of the chemical nature of individual nucleotides, DNA is synthesized from
the 5′ to the 3′ end. Also, remember that complementary DNA strands pair with each other in antiparallel
fashion, such that the 5′ end of one strand pairs with the 3′ end of the other strand.
2. Your group has done an excellent job carefully extracting mRNA and preparing fluorescently labeled
cDNA from your tissue samples! Your teacher will give you copies of these labeled, single-stranded cDNAs.
The cDNA from normal cells was labeled with Cy3 (blue), and the cDNA from the cancerous cells was
labeled with Cy5 (red).
©2004 Carolyn A. Zanta, UIUC-HHMI Biotechnology Education and Outreach Program (BEOP)
www.life.uiuc.edu/hughes/footlocker S-5STUDENT GUIDE DNA CHIPS: Genes to Disease
3. Your research group of 4–6 scientists has obtained a microarray slide containing 6 spots of DNA
oligonucleotides representing different human genes with unknown functions. How does this compare with
an actual microarray slide?
4. Mix the fluorescently labeled cDNA from the two cell samples (if they aren’t already mixed). Hybridize the
microarray slide with these labeled cDNAs. Each cDNA will bind to the spots that have complementary
sequences. The DNA oligonucleotides are shorter than the cDNA sequence, so the oligos will bind with
only a portion of the cDNA sequence. However, for binding to occur, the entire sequence of the oligo must
be complementary to a sequence in the cDNA. Try to find the complementary sequence for all of the
cDNAs. Neatly stacking your hybridized cDNAs will keep the microarray sequence in view. You may tape
the hybridized cDNA onto the microarray slide using a small piece of removable tape.
5. Wash the slide to remove excess fluorescent cDNA not bound to spots. (Simply remove the unbound
cDNAs left on the slide sheet.)
6. Read the microarray using an instrument that measures the fluorescence of each spot at the two different
wavelengths for blue or red. Analyze the data to determine which genes (as represented by the cDNA-bound
oligos on the spots on the slide sheet) are expressed in each tissue sample and which are expressed in both.
On the microarray slide sheet, use markers to color each spot. The colors of the spots will be as follows:
blue = The spot is bound to Cy3-labeled cDNA. What do these spots represent? (These are green in an
actual microarray.)
red = The spot is bound to Cy5-labeled cDNA. What do these spots represent?
purple = The spot is bound to both Cy3- and Cy5-labeled cDNA. These represent genes such as
“housekeeping genes” that are required by all cells. These are yellow in an actual microarray.
7. Your group has obtained interesting results that may be useful in determining how cancer cells differ from
normal cells! The next step is to study those genes that appear to be important in your experimental cells
(in this case, the cancer cells.)
a. Which unknown gene sequences (#1–6) appear to belong to genes used in all cells?
©2004 Carolyn A. Zanta, UIUC-HHMI Biotechnology Education and Outreach Program (BEOP)
www.life.uiuc.edu/hughes/footlocker S-6STUDENT GUIDE DNA CHIPS: Genes to Disease
b. Which unknown gene sequences (#1–6) might belong to cancer-preventing genes?
c. Which unknown gene sequences (#1–6) might be from genes that cause cells to become cancerous?
d. Are all of the genes expressed at the same level? How do you know this? What could this mean?
e. What additional questions do you have regarding your microarray results?
f. In the space below, describe further research that your group would like to accomplish using
microarrays. Your study can be related to the cancer study that you just carried out, or it can be
unique. Be sure to describe what samples you will use and what will be spotted on the microarray.
©2004 Carolyn A. Zanta, UIUC-HHMI Biotechnology Education and Outreach Program (BEOP)
www.life.uiuc.edu/hughes/footlocker S-7ACCCAT CGGAACC T TAG
3′-ACCCATCGGAACCTTAG-5′ ACCCAT CGGAACC T TAG
3′-ACCCATCGGAACCTTAG-5′
ACCCAT CGGAACC T TAG
3′-ACCCATCGGAACCTTAG-5′ ACCCAT CGGAACC T TAG
3′-ACCCATCGGAACCTTAG-5′
STUDENT GUIDE
Cut out each cDNA.
www.life.uiuc.edu/hughes/footlocker
3′-TTATCCCCGGGAAATT-5′
T TAT CCCCGGGAAAT T 3′-TTATCCCCGGGAAATT-5′
T TAT CCCCGGGAAAT T
AGCGTAAAAT T T CCAT T T
3′-AGCGTAAAATTTCCATTT-5′ 3′-AGCGTAAAATTTCCATTT-5′
AGCGTAAAAT T T CCAT T T
3′-GAGAGGTAGGAATATCAATTT-5′
GAGAGGTAGGAATA T CAAT T T 3′-GAGAGGTAGGAATATCAATTT-5′
GAGAGGTAGGAATA T CAAT T T
Single-stranded, Blue-labeled cDNA from normal cells
©2004 Carolyn A. Zanta, UIUC-HHMI Biotechnology Education and Outreach Program (BEOP)
3′-ATAGCGCGCCCGCGCGCG-5′
ATAGCGCGCCCGCGCGCG 3′-ATAGCGCGCCCGCGCGCG-5′
ATAGCGCGCCCGCGCGCG
Run a BLUE line down the end of each strip (or copy the strips onto blue paper).
3′-GAGAGGTAGGAATATCAATTT-5′
GAGAGGTAGGAATA T CAAT T T 3′-GAGAGGTAGGAATATCAATTT-5′
GAGAGGTAGGAATA T CAAT T T
Combine these cDNAs with one sheet of the red cDNAs from tumor cells for each student or team.
ATATAT T TAACAAGT TGCGC
3′-ATATATTTAACAAGTTGCGC-5′ ATATAT T TAACAAGT TGCGC
3′-ATATATTTAACAAGTTGCGC-5′
DNA CHIPS: Genes to Disease
S-8CCATATATATATATGGC
3′-CCATATATATATATGGC-5′ CCATATATATATATGGC
3′-CCATATATATATATGGC-5′
CCATATATATATATGGC
3′-CCATATATATATATGGC-5′ CCATATATATATATGGC
3′-CCATATATATATATGGC-5′
STUDENT GUIDE
Cut out each cDNA.
www.life.uiuc.edu/hughes/footlocker
CCATATATATATATGGC
3′-CCATATATATATATGGC-5′ CCATATATATATATGGC
3′-CCATATATATATATGGC-5′
CCCCAGTAGTAGTAG
3′-CCCCAGTAGTAGTAG-5′ CCCCAGTAGTAGTAG
3′-CCCCAGTAGTAGTAG-5′
T TAT CCCCGGGAAAT T
3′-TTATCCCCGGGAAATT-5′ T TAT CCCCGGGAAAT T
3′-TTATCCCCGGGAAATT-5′
©2004 Carolyn A. Zanta, UIUC-HHMI Biotechnology Education and Outreach Program (BEOP)
3′-ATACCCCGATCCCCC-5′
ATACCCCGAT CCCCC 3′-ATACCCCGATCCCCC-5′
ATACCCCGAT CCCCC
Single-stranded, Red-labeled cDNA from abnormal tumor cells
Run a RED line down the end of each strip (or copy the strips onto red paper).
GAGAGGTAGGAATA T CAAT T T
3′-GAGAGGTAGGAATATCAATTT-5′ GAGAGGTAGGAATA T CAAT T T
3′-GAGAGGTAGGAATATCAATTT-5′
Combine these cDNAs with one sheet of the blue cDNA from normal cells for each student or team.
3′-CCCCAGTAGTAGTAG-5′
CCCCAGTAGTAGTAG CCCCAGTAGTAGTAG
3′-CCCCAGTAGTAGTAG-5′
DNA CHIPS: Genes to Disease
S-91 2 3
STUDENT GUIDE
www.life.uiuc.edu/hughes/footlocker
Microarray Slide Sheet
5′-GGGTAGCCTTGG-3′
GGGTAGCC T TGG CATGCAT CCATG
5′-CATGCATCCATG-3′ 5′-GGGGCCCTTTAA-3′
GGGGCCC T T TAA
4 5 6
©2004 Carolyn A. Zanta, UIUC-HHMI Biotechnology Education and Outreach Program (BEOP)
5′-GCATTTTAAAGG-3′
GCAT T T TAAAGG 5′-CCATCCTTATAG-3′
CCAT CC T TATAG 5′-TATATATATATA-3′
TATATATATAT A
DNA CHIPS: Genes to Disease
S-10STUDENT GUIDE DNA CHIPS: Genes to Disease
The Microarray Simulation—Wet Lab
Prelab Review Questions
1. What are the major steps in preparing a microarray experiment? List them in order.
2. In this lab, we will study gene expression (transcription) in lung cancer cells as compared to that in normal
lung cells. The cDNA from lung cancer cells will be labeled pink, and the cDNA from normal cells will be
labeled blue. We are using atypical colors for our simulated microarrays. What three colors are seen in most
microarrays used in scientific research?
3. If the cDNAs made from the lung cancer cells’ mRNA are labeled red, and the cDNAs made from the
normal cells’ mRNA are labeled green, for each of the situations below, describe what color you expect the
gene spot to be on a microarray:
GENE DESCRIPTION COLOR OF SPOT
A gene was expressed (transcribed) more in lung
cancer cells than in normal lung cells.
A gene was transcribed the same in both cells.
A gene wasn't transcribed at all in either cell.
A gene was expressed (transcribed) more in normal
lung cells than in lung cancer cells.
S-11STUDENT GUIDE DNA CHIPS: Genes to Disease
The six genes that you will study using a “microarray”:
Gene 1. C4BPA—Complement component 4 binding protein, alpha
The protein this gene codes for helps initiate part of our immune system to kill pathogens.
Gene 2. ODC1—Ornithine decarboxylase 1
The protein this gene codes for is an enzyme in the polyamine biosynthesis pathway. The pathway catalyzes the
conversion of ornithine to putrescine. Growth-promoting stimuli can cause the activity level of the enzyme to vary.
Gene 3. FGG—Fibrinogen, gamma polypeptide
The protein encoded by this gene is a part of fibrinogen, a protein found in the blood. When blood vessels are
injured, fibrinogen is cleaved to form fibrin, the most abundant component of blood clots. In addition, other
pieces of fibrinogen and fibrin control how cells adhere to other tissues and cells within the body, how they
spread (the kind of spreading that involves “flattening” of the individual cell), and how they move in response
to chemical signals.
Gene 4. HBG1—Hemoglobin, gamma A
HBG1 is one of two γ-globulin genes (HBG1 and HBG2) normally expressed in the fetal liver, spleen, and bone
marrow. The two γ-chains coded for by these genes combine with two α-chains to form the fetal hemoglobin
protein. Fetal hemoglobin is usually replaced by adult hemoglobin at birth.
Gene 5. SIAT9—Sialytransferase 9
The protein encoded by this gene catalyzes the formation of another protein called GM3. Ganglioside GM3 is
known to play a role in inducing cell differentiation, controlling cell growth, and in maintaining the shape of
cells called fibroblasts. It also plays a role in communication pathways within the cell, and in certain types of
cell adhesion. Mutation of SAIT9 has been associated with a disease called Amish infantile epilepsy syndrome.
Gene 6. CYP24 (also called CYP24A1)—Cytochrome P450, family 24, subfamily A,
polypeptide 1
The cytochrome P450 proteins are enzymes called monooxygenases that catalyze many reactions involved in
drug metabolism and the making of cholesterol, steroids, and other lipids. The protein coded for by the CYP24
gene controls the level of vitamin D3 (the physiologically active form of vitamin D) and thus plays a role in
regulating calcium and the vitamin D endocrine system.
S-12You can also read