MRI-Visible Perivascular Spaces in the Centrum Semiovale Are Associated with Brain Amyloid Deposition in Patients with Alzheimer Disease-Related ...
←
→
Page content transcription
If your browser does not render page correctly, please read the page content below
Published May 13, 2021 as 10.3174/ajnr.A7155

                                                                                                                                        ORIGINAL RESEARCH
                                                                                                                                                ADULT BRAIN

         MRI-Visible Perivascular Spaces in the Centrum Semiovale
         Are Associated with Brain Amyloid Deposition in Patients
           with Alzheimer Disease–Related Cognitive Impairment
                                                 H.J. Kim,        H. Cho,        M. Park,    J.W. Kim,     S.J. Ahn,    C.H. Lyoo,     S.H. Suh, and      Y.H. Ryu

      ABSTRACT
      BACKGROUND AND PURPOSE: The association of perivascular spaces in the centrum semiovale with amyloid accumulation among
      patients with Alzheimer disease–related cognitive impairment is unknown. We evaluated this association in patients with Alzheimer
      disease–related cognitive impairment and b -amyloid deposition, assessed with [18F] florbetaben PET/CT.

      MATERIALS AND METHODS: MR imaging and [18F] florbetaben PET/CT images of 144 patients with Alzheimer disease–related cogni-
      tive impairment were retrospectively evaluated. MR imaging–visible perivascular spaces were rated on a 4-point visual scale: a score
      of $3 or ,3 indicated a high or low degree of MR imaging–visible perivascular spaces, respectively. Amyloid deposition was eval-
      uated using the brain b -amyloid plaque load scoring system.

      RESULTS: Compared with patients negative for b -amyloid, those positive for it were older and more likely to have lower cognitive
      function, a diagnosis of Alzheimer disease, white matter hyperintensity, the Apolipoprotein E « 4 allele, and a high degree of MR
      imaging–visible perivascular spaces in the centrum semiovale. Multivariable analysis, adjusted for age and Apolipoprotein E status,
      revealed that a high degree of MR imaging–visible perivascular spaces in the centrum semiovale was independently associated with
      b -amyloid positivity (odds ratio, 2.307; 95% CI, 1.036–5.136; P ¼ .041).
      CONCLUSIONS: A high degree of MR imaging–visible perivascular spaces in the centrum semiovale independently predicted
      b -amyloid positivity in patients with Alzheimer disease–related cognitive impairment. Thus, MR imaging–visible perivascular spaces
      in the centrum semiovale are associated with amyloid pathology of the brain and could be an indirect imaging marker of amyloid
      burden in patients with Alzheimer disease–related cognitive impairment.

      ABBREVIATIONS: AD ¼ Alzheimer disease; ADCI ¼ AD-related cognitive impairment; APOE ¼ Apolipoprotein E; BAPL ¼ b -amyloid plaque load; [18F] FBB
      ¼ [18F] florbetaben; MMSE ¼ Mini-Mental State Examination; PVS ¼ perivascular spaces; PVS-CS ¼ perivascular spaces in the centrum semiovale; SUVr ¼ stand-
      ardized uptake value ratios; WMH ¼ white matter hyperintensity

A    ccumulating evidence suggests that MR imaging–visible
     perivascular spaces (PVS) are not innocent lesions but may
be a neuroimaging marker of cerebral small-vessel disease.1-3 The
                                                                                            perivascular space is a potential space filled with interstitial fluid
                                                                                            surrounding penetrating vessels. It is involved in the drainage of
                                                                                            interstitial fluid and solutes from the brain.4 Therefore, several clin-
                                                                                            ical conditions that reduce the clearance of solutes from the brain
Received June 18, 2020; accepted after revision January 21, 2021.
                                                                                            interstitial fluid such as aging, hypertension, and inflammation can
From the Departments of Nuclear Medicine (H.J.K., Y.H.R.), Neurology (H.C., C.H.L.), and
Radiology (M.P., J.W.K., S.J.A., S.H.S.), Gangnam Severance Hospital, Yonsei University     result in MR imaging–visible PVS.5 MR imaging–visible PVS are
College of Medicine, Seoul, South Korea; and Department of Nuclear Medicine (H.J.K.),
Yongin Severance Hospital, Yonsei University College of Medicine, Yongin-si, South Korea.
                                                                                            also associated with various diseases, such as traumatic brain
H.J. Kim and H. Cho contributed equally to this work.                                       injury, Parkinson disease, and dementia.6-9 The location of MR
This research was supported by the Basic Science Research Program through the               imaging–visible PVS is an important factor to consider when pre-
National Research Foundation of Korea funded by the Ministry of Education, Science          dicting disease status because MR imaging–visible PVS in the basal
and Technology (NRF-2017R1D1A1B03034388), the National Research Foundation of
Korea grant funded by the Korean government (Ministry of Science and ICT) (No.              ganglia may be associated with markers of arteriolosclerosis,
NRF-2020R1C1C1005724), and Yonsei University College of Medicine (6-2019-0059).
                                                                                            whereas MR imaging–visible PVS in the centrum semiovale (PVS-
Please address correspondence to Mina Park, MD, Department of Radiology,
Gangnam Severance Hospital, Yonsei University College of Medicine, Eonjuro 211,             CS) are linked to diseases involving amyloid pathology, such as
Gangnam-gu, Seoul, South Korea; e-mail: to.minapark@yuhs.ac                                 Alzheimer disease (AD) and cerebral amyloid angiopathy.10,11
     Indicates open access to non-subscribers at www.ajnr.org                                   Many different studies on cerebral amyloid angiopathy have
     Indicates article with online supplemental data.                                       demonstrated a strong relationship between MR imaging–visible
http://dx.doi.org/10.3174/ajnr.A7155                                                        PVS-CS and cerebral amyloid angiopathy.12-15 Some studies have
                                                                                                          AJNR Am J Neuroradiol :     2021   www.ajnr.org       1

                                         Copyright 2021 by American Society of Neuroradiology.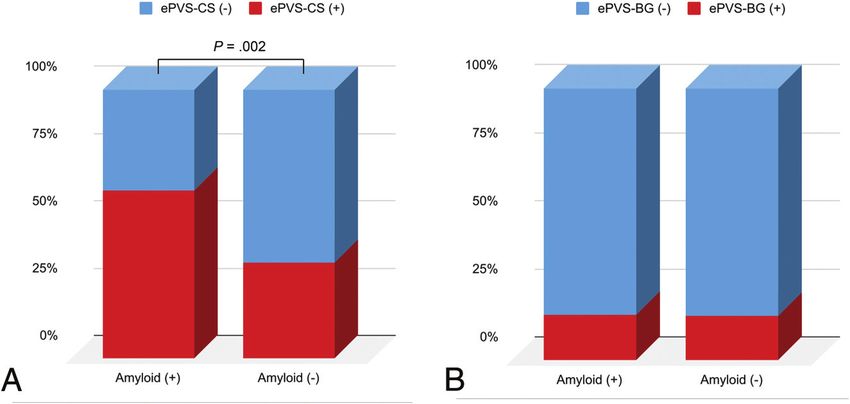
that labels in vivo amyloid deposits, in
                                                                                                    patients with cognitive impairment.

                                                                                                    MATERIALS AND METHODS
                                                                                                    Participants
                                                                                                    The need for written informed consent
                                                                                                    from patients was waived by the institu-
                                                                                                    tional review board of Gangnam
                                                                                                    Severance Hospital due to the retrospec-
                                                                                                    tive nature of this study. Data were
                                                                                                    reviewed from 153 consecutive patients
                                                                                                    with cognitive impairment and clinical
                                                                                                    indications of AD-related cognitive
                                                                                                    impairment (ADCI). All patients under-
                                                                                                    went an [18F] FBB PET/CT and brain
                                                                                                    MR imaging within a 3-month interval
                                                                                                    from June 2017 to July 2019. Of the 153
                                                                                                    patients with ADCI, we excluded 3
                                                                                                    patients with inadequate image acquisi-
                                                                                                    tion, 2 with image artifacts, 2 with intra-
                                                                                                    cranial hemorrhage, 1 with a large
                                                                                                    territorial infarction, and 1 with an
FIG 1. Patient-inclusion flowchart.                                                                  old traumatic contusion. Therefore, 144
                                                                                                    patients with ADCI were finally
                                                                                                    included in the analysis; among them,
                                                                                                    66 patients had probable AD and 78
suggested that the dilation of PVS and failure in the drainage of      had mild cognitive impairment. Figure 1 shows the patient-inclu-
interstitial fluid may result from deposition of b -amyloid in the     sion flowchart. The criteria for probable AD, proposed by the
cortical and leptomeningeal arteries.16 Furthermore, evidence          National Institutes of Neurological and Disorders and Stroke and by
indicates that MR imaging–visible PVS-CS are associated with in        the Alzheimer’s Disease and Related Disorders Association23, and
vivo b -amyloid deposition in the brain, based on amyloid PET          the Petersen criteria,24 were used for the clinical diagnosis of mild
scanning,14,17 which enables the visualization of brain amyloid        cognitive impairment.
deposition and measures the distribution and density of b -amy-
loid plaques.18                                                        Clinical Evaluation
    Failure in the perivascular clearance of b -amyloid may also be    We assessed all available patient information, such as basic demo-
involved in the accumulation of b -amyloid in AD.19 In patients        graphic characteristics, other medical conditions (including a his-
with AD, MR imaging–visible PVS-CS may reflect impaired peri-          tory of vascular risk factors), global cognitive assessment scores
vascular clearance of b -amyloid, and several studies have indicated   (eg, Clinical Dementia Rating Scale–Sum of Boxes score, Mini-
a link between MR imaging–visible PVS and AD.7,20 However,             Mental State Examination [MMSE] score, and a standardized
unlike evidence for the association between MR imaging–visible         neuropsychological battery called the Seoul Neuropsychological
PVS-CS and cerebral amyloid angiopathy, scant evidence exists          Screening Battery25), and Apolipoprotein E (APOE) « 4 genotyp-
regarding the association between b -amyloid deposition and MR         ing. APOE genotyping was performed using the polymerase chain
imaging–visible PVS in the population with dementia.                   reaction. Individuals with at least 1 « 4 allele were classified as
    Several compounds labeled with radioisotopes have been             APOE « 4-positive.
developed to image amyloid deposition. In patients with cogni-
tive impairment, PET scans using these tracers are widely used         MR Imaging Acquisition and Analysis
for diagnosis and follow-up.21 Among the radiopharmaceuticals,         The MR imaging sequences were performed on a 3T scanner
[18F] florbetaben ([18F] FBB) is widely used for PET imaging to        (Discovery MR750; GE Healthcare) with a 16-channel head coil.
evaluate AD and other causes of dementia. [18F] FBB has a proper       All patients underwent axial T2-weighted imaging, sagittal T1-
half-life and also allows high-resolution image acquisition, diag-     weighted imaging, sagittal 3D-FLAIR, and axial 3D susceptibility-
nostic capability, and quantification.22 For these reasons, [18F]      weighted angiography. Axial 2D T2-weighted images were
FBB is suitable for evaluating amyloid accumulation and its asso-      acquired using the FSE sequence (TR/TE, 5320/102 ms; flip angle,
ciation with enlarged PVS in patients with dementia.                   142°; section thickness, 4 mm; gap, 1 mm; FOV, 230 mm; matrix,
    We hypothesized that MR imaging–visible PVS-CS would be            352  352). The actual TR/TE ranged from 5289/104 ms to 6028/
associated with brain amyloid deposition in cognitively impaired       97 ms due to the autoTR setting and specific absorption rate
patients, as it is in patients with cerebral amyloid angiopathy. We    adjustment. Sagittal 3D T1-weighted images were obtained using
also evaluated the association using [18F] FBB, a PET radiotracer      the 3D fast-spoiled gradient echo sequence (TR/TE, 8.2/3.2 ms;
2    Kim    2021   www.ajnr.org
flip angle, 12°; section thickness, 1 mm; FOV, 240 mm; matrix, In addition to the visual assessment, we also performed a
256 256). Sagittal 3D-FLAIR images were obtained using semi-quantitative analysis to evaluate the cortical [18F] FBB reten-
the Cube sequence (GE Healthcare) (TR/TE, 6000/89 ms; tion in the PET/CT scans, as follows: Cortical regional standar-
TI, 1741 ms; section thickness, 1.2 mm; FOV, 260 mm; matrix, dized uptake value ratios (SUVr) were calculated for each patient
256 224). Axial 3D susceptibility-weighted angiography images in the 6 cortical ROIs (frontal, parietal, lateral temporal, precu-
were obtained using the following parameters: TR/TE, 30.9/ neus, and anterior and posterior cingulate cortex regions). We
23.4 ms, 46.8 ms, and 70.2 ms; flip angle, 10°; section thickness, used the cerebellar gray matter as the reference for SUVr calcula-
2 mm; gap, 1 mm; FOV, 230 mm; and matrix, 320 224. tion. The global composite florbetaben SUVr was calculated as
The PVS that were visible on MR imaging were assessed in the average of the SUVr value in each ROI.29,31 On the basis of
line with the STandards for ReportIng Vascular changes on the SUVr analysis, an [18F] FBB PET was defined as positive
nEuroimaging recommendations.26 Based on the axial T2- (SUVr-positive) when the global composite florbetaben SUVr
weighted MR images, MR imaging–visible PVS were rated in the was .1.42, which was assessed against the histopathologic deter-
basal ganglia and centrum semiovale using a validated 4-point mination of b -amyloid in previous research.32
visual rating scale: 0 ¼ no PVS; 1 ¼ #10 PVS; 2 ¼ 11–20 PVS;
3 ¼ 21–40 PVS; and 4 ¼ $40 PVS.12,27 The numbers refer to MR Statistical Analyses
imaging–visible PVS on 1 side of the brain (ie, the side/section Baseline characteristics were compared using the x 2 or Fisher
with the highest number of PVS after all relevant slices for each exact test for categoric variables, independent t tests for normally
anatomic area were reviewed). We prespecified a dichotomized distributed continuous variables, and Mann–Whitney U tests for
classification of MR imaging–visible perivascular space degree as continuous variables that were not normally distributed. MR
“high degree” (ie, score of .2) or “low degree” (ie, score of #2). imaging–visible PVS in both the basal ganglia and centrum semi-
This definition is in line with the perivascular space burden used ovale were considered categoric variables, respectively. They were
in previous studies and may be characteristic of amyloid subdivided by severity, as described previously. We explored the
pathology.10,12 independent and pathophysiologically relevant predictors of
White matter hyperintensities (WMHs) were defined as brain amyloid deposition using logistic regression analyses based
hyperintense white matter lesions on FLAIR images based on the on our prespecified hypothesis and the results of univariable anal-
STandards for ReportIng Vascular changes on nEuroimaging cri- yses (including variables with P , .05). Multivariable logistic
teria and were graded using the Fazekas scale as “deep WMHs” regression analyses, including age, sex, APOE « 4 allele status,
(0 ¼ absent; 1 ¼ punctate; 2 ¼ early confluent; 3 ¼ confluent) or and high degree of MR imaging–visible PVS-CS were performed.
“periventricular WMHs” (0 ¼ absent; 1 ¼ caps or pencil-thin lin- The variables of interest in univariable analysis were included in
ing; 2 ¼ smooth halo; 3 ¼ irregular WMHs extending into the the multivariable models using the enter method. Positive WMH
deep white matter).26,28 The total Fazekas score was calculated by was not included in the analysis because it was significantly asso-
adding the periventricular and deep WMH scores. A score of .3 ciated with a high degree of MR imaging–visible PVS-CS
was considered WMH-positive.28 Lacunes were defined as small (P , .001, based on the x 2 test).
lesions that were hypointense on T1-weighted images and hyper-
intense on T2-weighted images and had perilesional halos on Random Forests Analysis
FLAIR images.26 Microbleeds were defined as small signal voids A total of 13 demographic and radiologic features, excluding
with associated blooming on susceptibility-weighted angiography WMH, were evaluated; these features included age, sex, hyperten-
images. The presence and number of lacunes and microbleeds sion, diabetes, hyperlipidemia, previous stroke, APOE « 4 allele,
were recorded as previously described.26 MR imaging–visible PVS in the basal ganglia, MR imaging–visi-
ble PVS-CS, lacunes, cortical superficial siderosis, lobar cerebral
[18F] FBB PET Imaging Acquisition and Analysis
microbleeds, and deep cerebral microbleeds. The random forests
PET images were obtained using a Biograph mCT PET/CT scan-
model was trained with demographic and radiologic features to
ner (Siemens). At 90 minutes after we injected 307.0 (SD, 32.2)
classify the amyloid positivity of the brain. The diagnostic ability
MBq of [18F] FBB, PET data were acquired for 20 minutes. After
of the random forests model using receiver operating characteris-
we conducted attenuation and scatter correction, 3D-PET images
tic analysis and the area under the receiver operating characteris-
were reconstructed in a 256 256 223 matrix with a voxel size
tic curve was calculated.
of 1.591 1.591 1 mm using the ordered-subsets expectation
maximization algorithm.
We defined the results of amyloid PET as “positive” when the RESULTS
visual assessment of [18F] FBB PET was scored as 2 or 3 on the Study Participants
brain b -amyloid plaque load (BAPL) scoring system based on In this study, the total number of patients with ADCI was 144,
the following: 1 ¼ no tracer uptake, 2 ¼ moderate tracer uptake, comprising 67 patients with a BAPL score of one, 11 with a BAPL
and 3 ¼ pronounced tracer uptake.29,30 The decision was based score of 2, and 66 with a BAPL score of 3. On the basis of the cri-
on visual assessment of each section on the axial plane. All scans teria of the BAPL scoring system, 67 patients were negative for
were independently evaluated by 2 experienced nuclear medicine b -amyloid deposition and 77 were positive for it. According to
physicians, who reread all the studies while blinded to the original the SUVr analysis, 74 patients were negative for b -amyloid depo-
clinical reports and clinical information and reached a consensus. sition and 70 patients were positive for it.
AJNR Am J Neuroradiol : 2021 www.ajnr.org 3Among the 144 patients with ADCI, 3 had a PVS in the basal 7.6] years versus 71.3 [SD, 10.6] years; P ¼ .010). The prevalence
ganglia score of zero, 85 had a score of 1 in MR imaging–visible of the APOE « 4 allele (P ¼ .001), WMH (P ¼ .013), and AD
PVS in the basal ganglia, 32 had a score of two, 17 had a score of (P , .001) was higher in patients with b -amyloid positivity than
3, and 7 had a score of 4 in terms of MR imaging–visible PVS in in patients with b -amyloid negativity. The patients with b -amy-
the basal ganglia. With regard to MR imaging–visible PVS-CS, 15 loid positivity had poorer cognitive function on the MMSE
patients with ADCI had a score of one, 57 had a score of two, 56 (P , .001), the Clinical Dementia Rating Scale (P ¼ .019), and the
had a score of 3, and 16 had a score of 4. Clinical Dementia Rating Scale–Sum of Boxes (P , .001) com-
pared with patients with b -amyloid negativity (Table 1). A high
Comparison between Groups Positive and Negative for degree of MR imaging–visible PVS-CS existed more frequently
b-Amyloid among patients with b -amyloid positivity than in patients with
Age was significantly older in the patients positive for b -amyloid b -amyloid negativity (48/77 [62.3%] versus 24/67 [35.8%];
deposition than in patients negative for it (mean, 75.4 [SD, P ¼ .002), whereas a high degree of MR imaging–visible PVS
in the basal ganglia did not differ
Table 1: Baseline characteristics of the groups positive and negative for brain b-amyloid between groups positive and negative
Amyloid- Amyloid- P for b -amyloid (13/77 [16.9%] versus
Negative Positive Value 11/67 [16.4%], P ¼ .297) (Fig 2).
(No.) (%) 67 (46.5%) 77 (53.5%) Representative examples of PVS pat-
Age (mean) (SD) (yr) 71.3 (10.6) 75.4 (7.6) .010
Female sex (No.) (%) 44 (65.7%) 44 (57.1%) .297 terns with the corresponding [18F] FBB
Hypertension (No.) (%) 25 (37.3%) 36 (46.8%) .254 PET findings are presented in Fig 3.
Diabetes mellitus (No.) (%) 10 (14.9%) 16 (20.8%) .364
Hyperlipidemia (No.) (%) 9 (13.4%) 11 (14.3%) .883 Quantitative SUVr Analysis
Previous stroke (No.) (%) 7 (10.4%) 4 (5.2%) .238 In the SUVr analysis, 43/70 (61.4%)
APOE « 4 presence (No.) (%) 13 (19.4%) 33 (42.9%) .001
with global composite SUVr positivity
High degree of MR imaging–visible PVS-CS 24 (35.8%) 48 (62.3%) .002
(No.) (%) were classified as having a high degree
High degree of MR imaging–visible PVS-BG 11 (16.4%) 13 (16.9%) .297 of MR imaging–visible PVS-CS com-
(No.) (%) pared with 29/74 (39.2%) with SUVr
AD (No.) (%) 19 (28.4%) 47 (61.0%) ,.001 negativity (P ¼ .008), and the high
MMSE (median) (IQR) 26 (23–28) 24 (20–26) ,.001
CDR (median) (IQR) 0.5 (0.5–0.5) 0.5 (0.5–1.0) .019 degree of MR imaging–visible PVS
CDR-SB (median) (IQR) 1.5 (0.5–3.0) 3.0 (1.5–4.5) ,.001 in the basal ganglia did not differ
Lacunes (median) (IQR) 0 (0–0) 0 (0–0) .778 between the SUVr-positive and SUVr-
cSS present (No.) (%) 1 (1.5%) 6 (7.8%) .081 negative groups (12/70 [17.1%] versus
Lobar CMB (median) (IQR) 0 (0–0) 0 (0–1) .117
12/74 [16.2%], P ¼ .881). The global
Deep CMB (median) (IQR) 0 (0–0) 0 (0–0) .160
WMH presence (No.) (%) 27 (40.3%) 47 (61.0%) .013 composite SUVr was significantly
Note:—IQR indicates interquartile range; PVS-BG, perivascular space in the basal ganglia; CMB, cerebral micro-
higher in patients with a high degree
bleed; CDR, Clinical Dementia Rating Scale; CDR-SB, Clinical Dementia Rating Scale–Sum of Boxes; cSS, cortical su- of MR imaging–visible PVS-CS than
perficial siderosis. in those with a low degree (1.52 versus
1.37, P ¼ .005). In region-based analy-
sis, all 6 ROIs showed statistically sig-
nificant differences. The frontal (1.56
versus 1.37, P ¼ .004), parietal (1.50
versus 1.38, P ¼ .009), lateral temporal
(1.31 versus 1.19, P ¼ .008), precuneus
(1.60 versus 1.43, P ¼ .008), anterior
cingulate (1.47 versus 1.36, P ¼ .044),
and posterior cingulate (1.69 versus
1.52, P ¼ .004) regions showed higher
SUVr values in the patients with a
high degree of MR imaging–visible
PVS-CS than in those a low degree,
respectively.
MR Imaging–Visible PVS as a
FIG 2. Comparisons of the presence of MR imaging–visible PVS-CS (A) and MR imaging–visible
PVS in the basal ganglia (B) based on the b -amyloid status. The enlarged perivascular spaces in
Predictor of b-Amyloid Positivity
the centrum semiovale (ePVS-CS) were significantly higher in the patient group positive for In the univariate logistic regression
b -amyloid than in the patient group negative for it, whereas the high degree of enlarged perivas- analysis, a high degree of MR imag-
cular spaces in the basal ganglia (ePVS-BG) did not differ between the groups positive and nega- ing–visible PVS-CS was a positive pre-
tive for b -amyloid. dictor of b -amyloid positivity based
4 Kim 2021 www.ajnr.orgon the BAPL scoring system (OR, 2.966; 95% CI, 1.503–5.851; 1.000), and specificity of 0.985 (95% CI, 0.964-1.000). We observed
P ¼ .002) (Table 2). After adjustment, a high degree of MR imag- that MR imaging–visible PVS-CS ranked as the third most impor-
ing–visible PVS-CS remained independently associated with tant variable after APOE 4 and age (Online Supplemental Data).
b -amyloid PET positivity (OR, 2.307; 95% CI, 1.036–5.136;
P ¼ .041), as well as the presence of the APOE « 4 allele (OR, Comparisons between Patients with High and Low
4.583; 95% CI, 1.945–10.796; P , .001) and older age (OR, 1.050; Degrees of MR Imaging–Visible PVS-CS among Patients
95% CI, 1.004–1.098; P ¼ .034). Positive for b-Amyloid
The random forests model with 13 variables showed an area Among the 77 patients with ADCI with b -amyloid positivity,
under the curve of 0.985 (95% CI, 0.964–1.000) with an accuracy 70.8% of the patients with a high degree of MR imaging–visible
of 0.971 (95% CI, 0.931–1.000), sensitivity of 1.000 (95% CI, 1.000– PVS-CS had a higher proportion of positive WMHs (34/48),
whereas 44.8% (13/29) of patients with a low degree of MR imag-
ing–visible PVS-CS had positive WMHs (P ¼ .023). The fre-
quency of lobar microbleeds was also higher in patients with
ADCI and b -amyloid positivity than among patients with ADCI
and b -amyloid negativity (P ¼ .007). Other parameters such as
age, MMSE score, lacunes, deep microbleeds, sex, hypertension,
diabetes mellitus, hyperlipidemia, previous stroke, the presence
of an APOE « 4 allele, or final diagnosis were not significantly dif-
ferent between the patients with high and low degrees of MR
imaging–visible PVS-CS (Online Supplemental Data).
Comparisons between Patients with High and Low
Degrees of MR Imaging–Visible PVS-CS among Patients
Negative for b-Amyloid
Among 67 patients with ADCI with b -amyloid negativity, the
patients with a high degree of MR imaging–visible PVS-CS
(n ¼ 24) were older compared with patients with a low degree of
MR imaging–visible PVS-CS (n ¼ 43) (mean, 76.5 [SD, 9.8] years
versus 68.3 [SD, 10.0] years; P ¼ .002). Furthermore, the patients
with a high degree of MR imaging–visible PVS-CS had lower
MMSE scores compared with those with a low degree of MR
imaging–visible PVS-CS (23.8 [SD, 4.0] versus 26.1 [SD, 3.7],
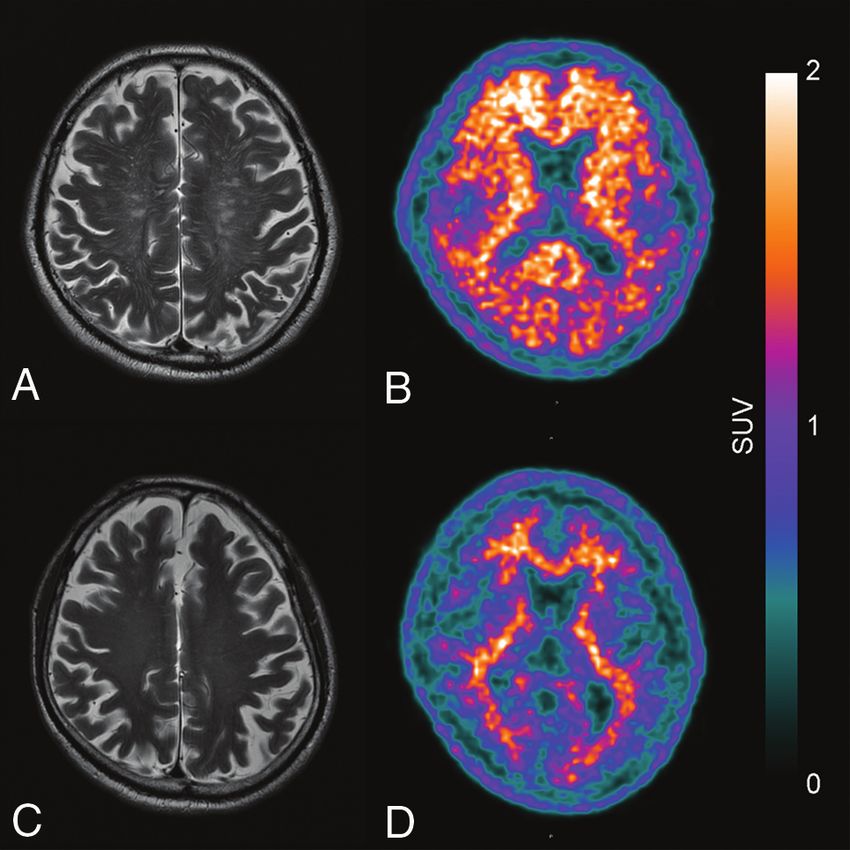
FIG 3. Examples of perivascular space patterns with the corresponding
P ¼ .018). The patients with a high degree of MR imaging–visible
[18F] FBB PET image. The axial T2-weighted MR imaging shows a high
degree of MR imaging–visible PVS-CS (A), and the corresponding [18F] PVS-CS compared with patients with a low degree of MR imag-
FBB PET (B) shows pronounced b -amyloid deposition. Axial T2- ing–visible PVS-CS had a higher prevalence of hypertension
weighted MR imaging shows a low degree of MR imaging–visible PVS- (54.2% versus 27.9%, P ¼ .033), positive WMHs (58.3% versus
CS (C) and the [18F] FBB PET scan (D) shows low b -amyloid deposition. 30.2%, P ¼ .025), final diagnosis of probable AD (45.8% versus
Table 2: Logistic regression analysis for the predictors of b-amyloid positivity
Univariable Multivariable
OR (95% CI) P Value OR (95% CI) P Value
Age (yr) 1.051 (1.012–1.092) .010 1.050 (1.004–1.098) .034
Sex
Female Reference group
Male 1.435 (0.729–2.823) .296 1.561 (0.699–3.489) .278
Hypertension (present) 1.475 (0.757–2.875) .254
Diabetes (present) 1.495 (0.627–3.564) .364
Hyperlipidemia (present) 1.074 (0.416–2.774) .883
Previous stroke (present) 0.470 (0.131–1.681) .245
APOE « 4 allele (present) 3.526 (1.630–7.627) .001 4.583 (1.945–10.796) ,.001
High degree of MR imaging–visible PVS-CS (score, $3) 2.966 (1.503–5.851) .002 2.307 (1.036–5.136) .041
High degree of MR imaging–visible PVS-BG (score, $3) 1.034 (0.429–2.492) .940
WMH (present) 2.321 (1.188–4.533) .014
Lacunes (for 1 number higher) 0.937 (0.726–1.209) .618
cSS (present) 5.577 (0.654–47.565) .116
Lobar CMB (present) 1.100 (0.934–1.295) .253
Deep CMB (present) 0.688 (0.428–1.108) .124
Note:—CMB indicates cerebral microbleed; cSS, cortical superficial siderosis; MRI-visible PVS-BG, enlarged perivascular space in the basal ganglia; MRI-visible PVS-CS,
enlarged perivascular space in the semi ovale.
AJNR Am J Neuroradiol : 2021 www.ajnr.org 518.6%, P ¼ .018), and a higher number of lobar microbleeds (me- To date, unlike the evidence for the cerebral amyloid angiopa-
dian, 0 [interquartile range, 0–0] versus 0 [interquartile range, thy population,14,17 scarce evidence exists regarding the association
0–1]; P ¼ .007). Other results are presented in the Online between AD and the in vivo amyloid burden, as assessed with
Supplemental Data. PET. A previous study, with results conflicting with ours, showed
that there was no association between MR imaging–visible PVS
DISCUSSION and amyloid burden in patients with dementia.7 However, several
In this retrospective study, we hypothesized that MR imaging– considerable differences were found in terms of the study method-
visible PVS-CS would be associated with brain amyloid deposi- ology, which may lead to different study outcomes.7 First, the
tion in patients with ADCI. We found that a high degree of MR aforementioned study included a population with AD and vascular
imaging–visible PVS-CS were independently associated with cognitive impairment, unlike our ADCI population. Because they
b -amyloid accumulation, as assessed by [18F] FBB PET scanning, included a large vascular dementia population, the heterogeneity
even after adjusting for previously known clinical risk factors. of the diagnosis and probable higher severity of small-vessel disease
Our findings support the evidence that MR imaging–visible PVS- in the population may lead to different results between the 2 stud-
CS are associated with the amyloid pathology of the brain and ies. The amyloid-negative group in the aforementioned study had
could be an indirect imaging marker of amyloid burden in the an inevitably higher WMH volume load, which may result in the
brains of patients with ADCI. misdiagnosis of MR imaging–visible PVS and ultimately interfere
PVS become visible on MR imaging when enlarged and can be with the evaluation of the association between MR imaging–visible
detected in individuals of all ages; however, MR imaging–visible PVS and amyloid positivity. Furthermore, the different cutoff val-
PVS are more frequently found with aging.17,33 A recent meta- ues for MR imaging–visible PVS scores may also lead to different
analysis, including a total of 8395 individuals, showed strong evi- study results. Those investigators considered score 2 (11–20 PVS)
dence for the association with age and MR imaging–visible PVS as a moderate pathologic condition, whereas we considered score 2
in the basal ganglia, as well as in the centrum semiovale.33 On the as a low degree of MR imaging–visible PVS. We believe that due to
other hand, a greater number of MR imaging–visible PVS can also the wider area of the centrum semiovale compared with the basal
be associated with various pathologic conditions. Accumulating ganglia and consequent higher number of PVS in the centrum
evidence shows that MR imaging–visible PVS-CS, in particular, semiovale than in basal ganglia, when one focuses on PVS in the
are associated with amyloid-associated pathology; several different centrum semiovale, score 2 should be considered a lower degree of
studies have demonstrated an association with the presence of AD PVS as it has been in other studies.10,12
and MR imaging–visible PVS-CS,7,20,34 though the mechanisms Most interesting, we found that the group negative for
of MR imaging–visible PVS-CS remain poorly understood. b -amyloid had many different clinical variables that may be
However, our observation suggests a potential pathophysiologic associated with a high degree of MR imaging–visible PVS-CS,
link between AD and MR imaging–visible PVS, in that progres- such as aging, hypertension, and lower cognitive function in
sive b -amyloid deposition in the vascular wall or brain cortex addition to AD pathology, lobar microbleeds, and the presence
may interfere with the perivascular drainage of interstitial fluid of WMHs. Therefore, we hypothesized that in patients with
and ultimately cause retrograde perivascular space dilation in the ADCI with lower amyloid burden, the presence of an MR imag-
white matter.35 Consequently, the visibility of MR imaging–visible ing–visible PVS may have multifactorial causes, such as arterial
PVS is increased on MR imaging and appears as spaces with a sig- stiffness and atrophy,39,40 whereas in patients with ADCI and a
nal intensity similar to that of CSF, resulting in a high burden of high amyloid burden, MR imaging–visible PVS are primarily
MR imaging–visible PVS.8 Consistent with this hypothesis, a post- caused by amyloid accumulation. However, this hypothesis
mortem study of AD demonstrated that the degree of white mat- needs further validation.
ter PVS on histopathologic examination was positively correlated In multivariate analysis, MR imaging–visible PVS-CS, APOE
with cortical b -amyloid deposition,16 which is in line with our « 4 allele presence, and older age were significantly related to
observation. Therefore, visible PVS on brain MR imaging may b -amyloid PET positivity, as analyzed by the BAPL scoring sys-
result from abnormal amyloid accumulation in the cortex and tem. The visual assessment of [18F] FBB PET images has
cortical/leptomeningeal vessels. achieved high diagnostic accuracy, with the neuropatho-
Recently, advances in bioimaging and radiochemistry have logy assessments offering good reliability and efficacy.41,42 We
enabled the in vivo imaging of b -amyloid deposits of AD, and believe that using the BAPL scoring system to evaluate b -amy-
this could be beneficial in aiding the early diagnosis of AD, com- loid deposition can achieve accurate and reproducible assess-
pared with the use of clinical symptoms alone.36-38 Furthermore, ments of [18F] FBB PET data. Also, a semi-quantitative analysis
the use of biomarkers may also identify individuals who could by SUVr cutoff classification was performed to obtain a signifi-
benefit from disease-modifying therapies in AD. On the basis of cant result. Bullich et al31 reported a good agreement between
our results, MR imaging–visible PVS alone cannot be an alterna- florbetaben PET quantification and histopathologic amyloid
tive to an amyloid PET scan; however, MR imaging–visible PVS- plaque density (92% sensitivity and 96% specificity) and visual
CS could be a useful indirect marker of amyloid deposition and read results by experts (percentage agreement = 94%97%).
may also be helpful in determining which patients with cognitive They emphasized the robustness of visual analysis performed by
impairment are most likely to benefit from a biomarker test. expert readers, as well as the additional contribution that opti-
These approaches may decrease the unnecessary patient burden mized relative FBB uptake quantification may have for the
and the costs of clinical practice and clinical trials. detection of b -amyloid plaques.
6 Kim 2021 www.ajnr.orgOur study had some limitations. First, it was a retrospective 13. van Veluw SJ, Biessels GJ, Bouvy WH, et al. Cerebral amyloid angi-
observational study and may have selection bias. Our findings opathy severity is linked to dilation of juxtacortical perivascular
require external validation in larger cohorts. We also did not spaces. J Cereb Blood Flow Metab 2016;36:576–80 CrossRef Medline
14. Raposo N, Planton M, Payoux P, et al. Enlarged perivascular spaces
quantitatively assess the MR imaging–visible PVS burden in both and florbetapir uptake in patients with intracerebral hemorrhage.
the centrum semiovale and basal ganglia. Therefore, whether MR Eur J Nucl Med Mol Imaging 2019;46:2339–47 CrossRef Medline
imaging–visible PVS in both the centrum semiovale and basal 15. Martinez-Ramirez S, van Rooden S, Charidimou A, et al. Perivascular
ganglia are consistent and good estimators of the whole-PVS load spaces volume in sporadic and hereditary (Dutch-Type) cerebral
in the brain remains uncertain. Standardized, fully automated, amyloid angiopathy. Stroke 2018;49:1913–19 CrossRef Medline
16. Roher AE, Kuo YM, Esh C, et al. Cortical and leptomeningeal cere-
and reliable whole-brain assessment techniques for PVS volume brovascular amyloid and white matter pathology in Alzheimer’s
quantification are needed to generalize the results of our study. disease. Mol Med 2003;9:112–22 CrossRef Medline
17. Charidimou A, Hong YT, Jager HR, et al. White matter perivascular
spaces on magnetic resonance imaging: marker of cerebrovascular
CONCLUSIONS
amyloid burden? Stroke 2015;46:1707–09 CrossRef Medline
The findings of this study provide further supporting evidence 18. Rowe CC, Ackerman U, Browne W, et al. Imaging of amyloid beta in
that MR imaging–visible PVS-CS are a key imaging marker of Alzheimer's disease with 18F-BAY94-9172, a novel PET tracer:
amyloid pathology when assessed by amyloid PET scans in proof of mechanism. Lancet Neurol 2008;7:129–35 CrossRef Medline
patients with ADCI. Our findings raise the possibility that MR 19. Hawkes CA, Jayakody N, Johnston DA, et al. Failure of perivascular
drainage of beta-amyloid in cerebral amyloid angiopathy. Brain
imaging–visible PVS-CS in patients with ADCI are also a conse-
Pathol 2014;24:396–403 CrossRef Medline
quence of amyloid deposition in the cortical and vascular amyloid 20. Ramirez J, Berezuk C, McNeely AA, et al. Visible Virchow-Robin
processes. spaces on magnetic resonance imaging of Alzheimer’s disease
patients and normal elderly from the Sunnybrook Dementia
Study. J Alzheimers Dis 2014;43:415–24 CrossRef Medline
21. Marcus C, Mena E, Subramaniam RM. Brain PET in the diagnosis
REFERENCES of Alzheimer’s disease. Clin Nucl Med 2014;39:e413–22; quiz e23–26
1. Doubal FN, MacLullich AM, Ferguson KJ, et al. Enlarged perivascu- CrossRef Medline
lar spaces on MRI are a feature of cerebral small vessel disease. 22. Murphy MP, LeVine H 3rd. Alzheimer's disease and the amyloid-
Stroke 2010;41:450–54 CrossRef Medline beta peptide. J Alzheimers Dis 2010;19:311–23 CrossRef Medline
2. Brown R, Benveniste H, Black SE, et al. Understanding the role of 23. McKhann G, Drachman D, Folstein M, et al. Clinical diagnosis of
the perivascular space in cerebral small vessel disease. Cardiovasc Alzheimer’s disease: report of the NINCDS-ADRDA Work Group
Res 2018;114:1462–73 CrossRef Medline under the auspices of Department of Health and Human Services
3. Zhu YC, Tzourio C, Soumare A, et al. Severity of dilated Virchow- Task Force on Alzheimer's Disease. Neurology 1984;34:939–44 CrossRef
Robin spaces is associated with age, blood pressure, and MRI Medline
markers of small vessel disease: a population-based study. Stroke 24. Petersen RC, Smith GE, Waring SC, et al. Mild cognitive impairment:
2010;41:2483–90 CrossRef Medline clinical characterization and outcome. Arch Neurol 1999;56:303–08
4. Weller RO, Hawkes CA, Kalaria RN, et al. White matter changes in CrossRef Medline
dementia: role of impaired drainage of interstitial fluid. Brain 25. Ahn HJ, Chin J, Park A, et al. Seoul Neuropsychological Screening
Pathol 2015;25:63–78 CrossRef Medline Battery-dementia version (SNSB-D): a useful tool for assessing
5. Wardlaw JM, Benveniste H, Nedergaard M, et al. Colleagues from the and monitoring cognitive impairments in dementia patients. J
Fondation Leducq Transatlantic Network of Excellence on the Role of Korean Med Sci 2010;25:1071–76 CrossRef Medline
the Perivascular Space in Cerebral Small Vessel Disease. Perivascular 26. Wardlaw JM, Smith EE, Biessels GJ, et al. STandards for ReportIng
spaces in the brain: anatomy, physiology and pathology. Nat Rev Vascular changes on nEuroimaging (STRIVE v1). Neuroimaging
Neurol 2020;16:137–53 CrossRef Medline standards for research into small vessel disease and its contribu-
tion to ageing and neurodegeneration. Lancet Neurol 2013;12:822–
6. Park YW, Shin NY, Chung SJ, et al. Magnetic resonance imaging–visi-
38 CrossRef Medline
ble perivascular spaces in basal ganglia predict cognitive decline in
27. Maclullich AM, Wardlaw JM, Ferguson KJ, et al. Enlarged perivascular
Parkinson’s disease. Mov Disord 2019;34:1672–79 CrossRef Medline
spaces are associated with cognitive function in healthy elderly men.
7. Banerjee G, Kim HJ, Fox Z, et al. MRI–visible perivascular space
J Neurol Neurosurg Psychiatry 2004;75:1519–23 CrossRef Medline
location is associated with Alzheimer’s disease independently of
28. Fazekas F, Chawluk JB, Alavi A, et al. MR signal abnormalities at 1.5
amyloid burden. Brain 2017;140:1107–16 CrossRef Medline
T in Alzheimer’s dementia and normal aging. AJR Am J Roentgenol
8. Smeijer D, Ikram MK, Hilal S. Enlarged perivascular spaces and de-
1987;149:351–56 CrossRef Medline
mentia: a systematic review. J Alzheimers Dis 2019;72:247–56 CrossRef
29. Barthel H, Gertz HJ, Dresel S, et al. Cerebral amyloid-beta PET with
Medline florbetaben (18F) in patients with Alzheimer’s disease and healthy
9. Inglese M, Bomsztyk E, Gonen O, et al. Dilated perivascular spaces: controls: a multicentre phase 2 diagnostic study. Lancet Neurol
hallmarks of mild traumatic brain injury. AJNR Am J Neuroradiol 2011;10:424–35 CrossRef Medline
2005;26:719–24 Medline 30. Lopresti BJ, Klunk WE, Mathis CA, et al. Simplified quantification
10. Martinez-Ramirez S, Pontes-Neto OM, Dumas AP, et al. Topography of Pittsburgh Compound B amyloid imaging PET studies: a com-
of dilated perivascular spaces in subjects from a memory clinic parative analysis. J Nucl Med 2005;46:1959–72 CrossRef Medline
cohort. Neurology 2013;80:1551–56 CrossRef Medline 31. Bullich S, Seibyl J, Catafau AM, et al. Optimized classification of
11. Charidimou A, Meegahage R, Fox Z, et al. Enlarged perivascular (18)F-Florbetaben PET scans as positive and negative using an
spaces as a marker of underlying arteriopathy in intracerebral SUVR quantitative approach and comparison to visual assessment.
haemorrhage: a multicentre MRI cohort study. J Neurol Neurosurg Neuroimage Clin 2017;15:325–32 CrossRef Medline
Psychiatry 2013;84:624–29 CrossRef Medline 32. Duara R, Loewenstein DA, Lizarraga G, et al. Effect of age, ethnicity,
12. Charidimou A, Boulouis G, Pasi M, et al. MRI–visible perivascular sex, cognitive status and APOE genotype on amyloid load and the
spaces in cerebral amyloid angiopathy and hypertensive arteriopa- threshold for amyloid positivity. Neuroimage Clin 2019;22:101800
thy. Neurology 2017;88:1157–64 CrossRef Medline CrossRef Medline
AJNR Am J Neuroradiol : 2021 www.ajnr.org 733. Francis F, Ballerini L, Wardlaw JM. Perivascular spaces and their 38. Hansson O, Zetterberg H, Buchhave P, et al. Association between CSF
associations with risk factors, clinical disorders and neuroimaging biomarkers and incipient Alzheimer’s disease in patients with mild
features: a systematic review and meta-analysis. Int J Stroke cognitive impairment: a follow-up study. Lancet Neurol 2006;5:228–
2019;14:359–71 CrossRef Medline 34 CrossRef Medline
34. Chen W, Song X, Zhang Y; Alzheimer's Disease Neuroimaging Initiative. 39. Hughes TM, Craft S, Lopez OL. Review of ‘the potential role of arterial
Assessment of the Virchow-Robin Spaces in Alzheimer disease, mild stiffness in the pathogenesis of Alzheimer’s disease.’ Neurodegener Dis
cognitive impairment, and normal aging, using high-field MR imag- Manag 2015;5:121–35 CrossRef Medline
ing. AJNR Am J Neuroradiol 2011;32:1490–95 CrossRef Medline
40. Adams HH, Hilal S, Schwingenschuh P, et al. A priori collaboration
35. Weller RO, Djuanda E, Yow HY, et al. Lymphatic drainage of the
in population imaging: the Uniform Neuro-Imaging of Virchow-
brain and the pathophysiology of neurological disease. Acta
Robin Spaces Enlargement Consortium. Alzheimers Dement (Amst)
Neuropathol 2009;117:1–14 CrossRef Medline
2015;1:513–20 CrossRef Medline
36. Palmqvist S, Zetterberg H, Mattsson N, et al. Alzheimer’s Disease
Neuroimaging Initiative. Detailed comparison of amyloid PET and 41. Minoshima S, Drzezga AE, Barthel H, et al. SNMMI Procedure
CSF biomarkers for identifying early Alzheimer disease. Neurology Standard/EANM Practice Guideline for Amyloid PET Imaging of
2015;85:1240–49 CrossRef Medline the Brain 1.0. J Nucl Med 2016;57:1316–22 CrossRef Medline
37. Buchhave P, Minthon L, Zetterberg H, et al. Cerebrospinal fluid lev- 42. Seibyl J, Barthel H, Stephens A, et al. Reliability, reproducibility and
els of beta-amyloid 1-42, but not of tau, are fully changed already 5 efficacy of the 18F florbetaben b -amyloid PET scan visual assess-
to 10 years before the onset of Alzheimer dementia. Arch Gen ment method as trained via a computer-based instructional tool. J
Psychiatry 2012;69:98–106 CrossRef Medline Nucl Med 2013;54(Suppl 2):300
8 Kim 2021 www.ajnr.orgYou can also read