Responsible manner Transcontinental inc - TC ...
←
→
Page content transcription
If your browser does not render page correctly, please read the page content below

acting in a
             responsible
                        manner

Transcontinental inc.
Investor Relations Presentation
March 2021
                                  www.tc.tc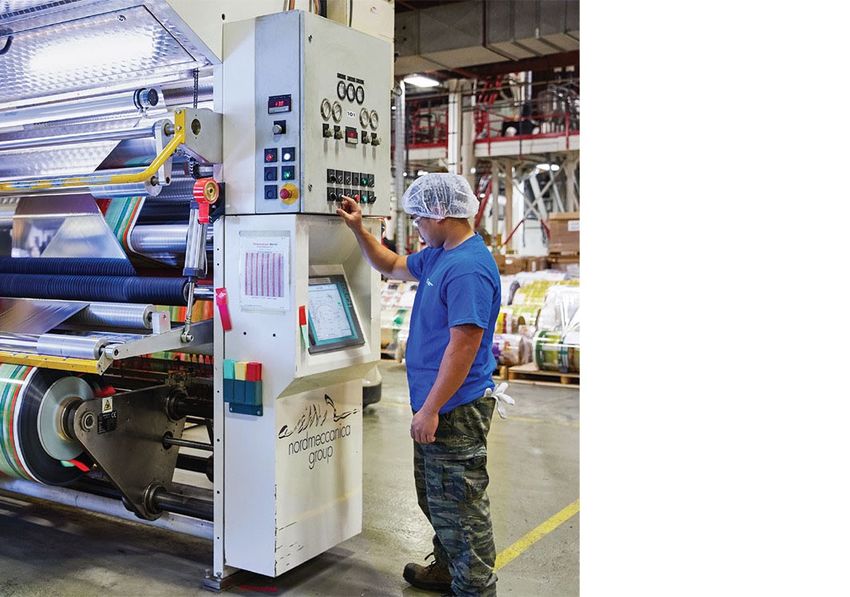
Note to readers
In this document, unless otherwise indicated, all financial data are prepared in accordance with International Financial Reporting
Standards (IFRS) and the term ‘’dollars’’ as well as the symbol ‘’$’’ designate Canadian dollars. In this document, we also use non-IFRS
financial measures for which a complete definition is presented below and for which a reconciliation to financial information in
accordance with IFRS is presented in the section entitled "Reconciliation of Non-IFRS Financial Measures" and in Note 3, "Segmented
Information", to the interim condensed consolidated financial statements for the fiscal year ended October 25, 2020. These measures
should be considered as a complement to financial performance measures in accordance with IFRS. They do not substitute and are not
superior to them.

  Terms used                                   Definitions

Adjusted revenues                            Revenues before the accelerated recognition of deferred revenues (1)

Adjusted operating earnings                  Operating earnings before depreciation and amortization as well as the accelerated recognition of
before depreciation and                      deferred revenues (1), restructuring and other costs (gains), impairment of assets and reversal of
amortization (adjusted EBITDA)               the fair value adjustment of inventory sold arising from business combinations

                                             Operating earnings before the accelerated recognition of deferred revenues (1), accelerated
Adjusted operating earnings                  depreciation (1), restructuring and other costs (gains), impairment of assets, as well as amortization
(Adjusted EBIT)                              of intangible assets and reversal of the fair value adjustment of inventory sold arising from business
                                             combinations

Adjusted EBITDA margin                       Adjusted operating earnings before depreciation and amortization divided by adjusted revenues

                                             Total of long-term debt, of current portion of long-term debt, of lease liabilities and of current portion
Net indebtedness
                                             of lease liabilities, less cash

                                             Net indebtedness divided by the last 12 months’ adjusted operating earnings before depreciation
Net indebtedness ratio
                                             and amortization

(1) Related to the agreements signed with Hearst. Please refer to Note 32 to the annual consolidated financial statements for the year ended
October 25, 2020.

                                                                                                                                                          2
Forward-looking information
Our public communications often contain oral or written forward-looking statements which are based on the expectations of
management and inherently subject to a certain number of risks and uncertainties, known and unknown. By their very
nature, forward-looking statements are derived from both general and specific assumptions. The Corporation cautions
against undue reliance on such statements since actual results or events may differ materially from the expectations
expressed or implied in them. Forward-looking statements may include observations concerning the Corporation's
objectives, strategy, anticipated financial results and business outlook. The Corporation's future performance may also be
affected by a number of factors, many of which are beyond the Corporation's will or control. These factors include, but are
not limited to, the economic situation in the world, structural changes in the industries in which the Corporation operates,
the impact of digital product development and adoption on the demand for retailer-related services and other printed
products, the Corporation's ability to generate organic growth in highly competitive industries, the Corporation's ability to
complete acquisitions in the packaging industry and properly integrate them, the inability to maintain or improve
operational efficiency and avoid disruptions that could affect its ability to meet deadlines, cybersecurity and data protection,
the political and social environment as well as regulatory and legislative changes, in particular with regard to the
environment and door-to-door distribution, changes in consumption habits related, in particular, to issues involving
sustainable development and the use of certain products or services such as door-to-door distribution, change in
consumption habits or loss of a major customer, customer consolidation, the safety and quality of its packaging products
used in the food industry, the protection of its intellectual property rights, the exchange rate, availability of capital at a
reasonable rate, bad debts from certain customers, import and export controls, raw materials and transportation costs,
recruiting and retaining qualified personnel in certain geographic areas and industry sectors, taxation, interest rates and
the impact of the COVID-19 pandemic on its operations, facilities and financial results, changes in consumption habits from
consumers and changes in the operations and financial position of the Corporation's customers due to the pandemic and
the effectiveness of plans and measures implemented in response thereto. The main risks, uncertainties and factors that
could influence actual results are described in the Management's Discussion and Analysis for the year ended October 25,
2020 and in the latest Annual Information Form.

Unless otherwise indicated by the Corporation, forward-looking statements do not take into account the potential impact of
non-recurring or other unusual items, nor of disposals, business combinations, mergers or acquisitions which may be
announced or entered into after the date of February 25, 2021. The forward-looking statements in this presentation are
made pursuant to the “safe harbour” provisions of applicable Canadian securities legislation and are based on current
expectations and information available as at February 25, 2021. Such forward-looking information may also be found in
other documents filed with Canadian securities regulators or in other communications. The Corporation's management
disclaims any intention or obligation to update or revise these statements unless otherwise required by the securities
authorities.

                                                                                                                                   3
Overview
TC Transcontinental Overview

Our Business Sectors

Conclusion

                               www.tc.tc
TC Transcontinental Overview
Our vision is to become a market leader in flexible packaging in
North America while maintaining our position as Canada’s largest
printer and as the leading Canadian French-language educational
publishing group.

  Family-controlled business founded in 1976
  Investment grade credit rating and Net Indebtedness ratio < 2x
  Solid financial position and strong predictable cash flow providing
  flexibility to accelerate our growth organically and through acquisitions
  Long history of dividend growth (11% CAGR since 1993)
  Track record of pursuing business activities responsibly and leader
  in Corporate Social Responsibility (CSR)

        $2.6B                       ~ 8,000                    38
      2020 Revenues                     Employees              Operating
                                                               facilites
                                                                              5
Successful transformation into a growth company
2016 2020 Future
36%
10%
55%
29% $2.0B $2.6B >$3B
21%
9%
Growth
12% 3% 11%
segments 11% 3%
Growth
Segments
23% 68% >80%
Proven track record of operational excellence
Long term sustainable organic growth outlook
Solid balance sheet providing opportunities to accelerate
growth through acquisitions
Segments
Legacy Media (fully divested) ISM / Book / Premedia
Growth
Newspapers / Mag / Commercial Flexible Packaging 6
segments
Flyers / Distribution Media - Education
Demonstrated ability to deleverage rapidly
using solid free cash flow
Net indebtedness1 (in millions of $) and net indebtedness ratio1
                                                                                                                            2
                                                                                                         Lease liabilities
       3.5
                                                                                                         Net indebtedness (excl. Lease liabilities)
                     3.1           3.0                                                                   Net indebtedness ratio (excl. IFRS 16)
                                                 2.8                                                                                            2
                                                               2.7                                       Net indebtedness ratio (incl. IFRS 16)
                                                                             2.5                         2.4
      1,478                                                                                2.3
                  1,421         1,425         1,402                                                                   2.0
                                                            1,352                                                                 1.9          1.8
                                                                                                        2.2
                                                                          1,169           2.0
                                                                                                        138
                                                                                          132                         1.8
                                                                                                                                 1.6
                                                                                          961           983           133
                                                                                                                                 155
                                                                                                                                               153
                                                                                                                      843
                                                                                                                                 779
                                                                                                                                              735

 Q3 2018 Q4 2018 Q1 2019 Q2 2019 Q3 2019 Q4 2019 Q1 2020 Q2 2020 Q3 2020 Q4 2020 Q1 2021

                  S&P improved outlook (from Negative to Stable) and
                 reaffirmed Transcontinental’s Investment Grade Rating
                                                                                                                                                      7
 1.    Non-IFRS financial measure. Please refer to page 2 of this presentation for a complete description of these measures.
 2.    As at October 28, 2019, the Company adopted IFRS 16 using the modified retrospective transition method. For
       comparative purposes, we included the net indebtedness ratios for FY2020 after normalizing for the effect of IFRS 16.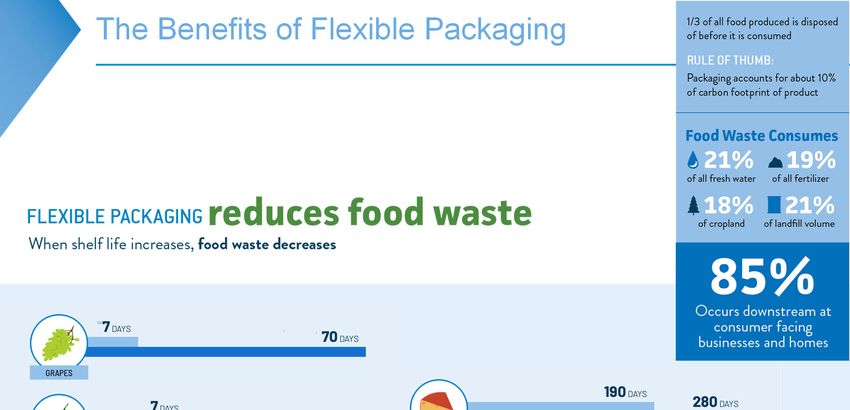
Allocating capital prudently
500                                                                                                    600

              Cash flows from operating activities and capital allocation ($M)
450

                    CAPEX (incl. intangibles)
                                                                                                       500

400
                    Dividends                                                                                 Average
                    Share buybacks                                                       432    427          (2015 – 2020)
350
                    Cash flows from operating activities
                                                                                                             Cash flows
                                                                                                       400

                                                                                                             Operations
300

                                                           324
                                                                                  313
              289
250
                                     273                                                               300

                                                                                                              $343M
200

                                                                                          76
                                                                                                 7            Dividends
                                                                                   24
                                                                                                       200

150

               1                      22
                                                                                                 78             19%
               52                                                                  69
100                                   56
                                                            61
                                                                                                       100
                                                                                                               CAPEX
                                                                                         126
50

               87                     77                                           80            98             25%
                                                            49
 0                                                                                                     0

             2015                    2016                  2017                   2018   2019   2020

                   Strong and consistent cash flow generation that allowed deployment
                             of over $2B to diversify into flexible packaging
                                                                                                                      8

      Note : 2020 share buybacks have been made before the end of January 2020.
Returning capital to shareholders

Dividends paid per participating share

        Dividends paid in 2020
                                                    90 ¢
  represented only 18.2% of cash
    flows from operating activities

            6¢

           1993                                     2020

              Strong cash flow generation provided confidence
                      to continue dividend distribution
                                                                9
Our CSR Approach
Corporate Social Responsibility is embedded in everything we do, while
our sustainability focus drives innovation and provides a key competitive
advantage

                                                        Collaborate across the value chain
                                                        between all stakeholders

                                                        Deliver on our 11 goals related to our
                                                        people, our operations, our products and
                                                        our communities

                                                        Targets are directly aligned with seven of
                                                        the 17 sustainable development goals
                                                        defined by the UN Global Compact

                                                        Released a 3-year plan in 2019 and
                                                        published a progress report in June 2020

                                                                                                10
www.tc.tc/about-us/social-responsibility/publications-certifications
Pursuing our business activities responsibly
Top 50 Global ESG from Sustainalytics (Top 1%)
(#1 in Containers & Packaging industry worldwide)
Corporate Knights: Among the top 10 Corporate
Citizens in Canada in 2019 and 2020 and
ranked in top Global 100 (worldwide) in 2020
Included in the Top 50 of the Jantzi®
Social Index in Canada
Signatory of the United Nations Global Compact
and of the Ellen MacArthur Foundation’s New
Plastics Economy Global Commitment
Committed to disclosure in the Carbon
Disclosure Project (CDP) and improved score
in 2020
Member of the Sustainable Packaging
Coalition® (SPC) 11Overview
TC Transcontinental Overview
Our Business Sectors
Conclusion
www.tc.tcTC Transcontinental
Packaging
www.tc.tc 13Recent achievements in Packaging
Investments in manufacturing capabilities (including the internalization of
film extrusion in Whitby, Ontario)
Steady improvement in profitability
Exceeded target for synergies, helping to significantly increase EBIT margin and
Adjusted EBITDA margin1 in FY2020 (16% Adj. EBITDA in FY2020)
Managed the strong order uptake and supported our customers by
optimizing capacity and keeping employees safe & healthy during the
pandemic
Establishing our leadership in sustainability and the circular economy for
plastics
Created a Recycling Group within TC Transcontinental Packaging and acquired
the assets of Enviroplast inc. to vertically integrate the recycling of plastics in
our packaging production chain
Strong performance in 2020 demonstrating the resilience
of the packaging business
14
1 Non-IFRS financial measure. Please refer to page 2 of this presentation for a complete description of these measures.Packaging outlook
Generate long-term organic sales growth
Consolidated platform has capacity to accommodate additional
volume
Expect organic growth > 2% in FY2021
Focus on manufacturing efficiency to continue to gradually
improve margins
Continue to strengthen our packaging portfolio with targeted
acquisitions
Long-term growth opportunities driven by demand
for sustainable flexible packaging
15A North American leader in flexible packaging
Specializing in extrusion, lamination, printing, converting and recycling
26
CANADA
production plants
UNITED KINGDOM
~3,800
UNITED STATES
employees
$1.4B FY2020 Revenues MEXICO
GUATEMALA
ECUADOR
16We have built a solid flexible packaging platform
2014 2015 2016 2016
Acquisition of Acquisition of Acquisition of Acquisition of
Capri Packaging Ultra Flex Packaging Corp. Robbie Manufacturing Flexstar Packaging Inc.
Clinton, Missouri Brooklyn, New York Lenexa, Kansas Richmond, British Columbia
2 plants 1 plant 1 plant 1 plant
2017 2018 2018 2019
Acquisition of a
Acquisition of Acquisition of Acquisition of majority participation in
Les Industries Flexipak Inc. Multifilm Packaging Coveris Americas Industrial y Commercial Trilex
Montréal, Québec Corporation Elgin, Illinois Chicago, Illinois Guayaquil, Ecuador
1 plant 1 plant 21 plants (4 sold in 2020) 1 plant
2020
Acquisition of the
assets of Enviroplast Inc.
Montréal, Québec
17
1 plantSuccessful integration of Coveris Americas
Exceeded synergy targets
EBIT and adjusted EBITDA1 increased significantly over the last 2 years. Adjusted
EBITDA margins1 grew from 11.9% in FY2018 to 12.8% in FY2019, and to 16.0% in
FY2020, a 410bps improvement in 2 years.
Insourcing of film manufacturing contributing to FY2020 margin
improvement
Acquisition of a strong expertise in technical films production that enables
insourcing of film manufacturing leading to cost competitiveness, differentiation and
faster product development
Value creation from more than US$20M annual cost synergies
(more than US$20M realized in first 2 years and additional
synergies expected in FY2021)
Vertical integration of film
Sharing of best
Procurement of raw materials manufacturing
Economies of scale practices &
Insourcing of prepress and
integration
plate-making operations
Significant operating margin improvement from exceeding synergy targets
18
1 Non-IFRS financial measure. Please refer to page 2 of this presentation for a complete description of these measures.Growing profitability in Packaging
Profitability growing since the acquisition of Coveris Americas
Year-over-year Adjusted EBITDA margin1 improvement in each of the last 10 quarters
100 Positive temporary impact 20.0%
from declining resin prices 18.6%
18.0%
1 16.9%
Adj. EBITDA EBIT Adj. EBITDA %
80 16.0%
EBIT and Adj. EBITDA (in millions of $)
16.0%
14.8%
13.8%
13.2% 14.0%
60 12.8% 65.0 Negative temporary
12.5%
impact from rising
11.6% 11.7% 58.0
56.3 56.8 resin prices 12.0%
52.2 52.0
48.5 $207M 47.7
$228M 50.0
46.3
40 10.0%
8.2%
32.9 8.0%
29.2
26.6 25.8
20 23.1
6.0%
16.8
14.8 14.7 15.2
10.5
7.1 4.0%
0
Q3 2018 Q4 2018 Q1 2019 Q2 2019 Q3 2019 Q4 2019 Q1 2020 Q2 2020 Q3 2020 Q4 2020 Q1 2021
2.0%
While sudden movement in resin prices may temporarily impact profitability,
operational
‐20
efficiency gains and portfolio management are contributing to margin
0.0%
improvement in Packaging 19
1 Non-IFRS financial measure. Please refer to page 2 of this presentation for a complete description of these measures.Serving a variety of industries
Core markets among our portfolio of products
Agriculture Candy &
(Banana) Beverage Confectionery Cheese & Dairy
Home &
Coffee & Tea Personal Care Pet Food Meat & Poultry
Investing in innovative and ecoresponsible products to
become the market leader in core markets
20Packaging Innovation and Sustainability
Key considerations for clients
Product • Oxygen, Moisture, Light
Protection • Transportation
Consumer • On the Shelf Image
Engagement • Convenience of Use
Total Cost of • Purchase Price
Ownership • Processing Speed & Ease
• Carbon Footprint Impact
Sustainability
• End‐of‐Life Scenario
21The Benefits of Flexible Packaging
22The Benefits of Flexible Packaging
23The Benefits of Flexible Packaging
Guess how many trucks
you would need to
transport the same volume
of rigid containers?
24Flexible packaging plays a vital role in preserving
food and reducing food waste
Significantly Increases shelf life Offers Provides Informs the
improves product and reduces food unprecedented confidence in consumer of the
protection and waste convenience sterility and contents
freshness features product security
25The Benefits of Flexible Packaging
26vieVERTe: Our Growing Sustainable Packaging Line
100% RECYCLED READY BARRIER RECYCLED COMPOSTABLE PCR CONTAINING
• Low barrier outer READY • Leader in packaging films SHRINK FILMS
bag/pouch • First to commercialize for compostable • Maintains machine
• Lamination‐two layer barrier structure barrier • Custom engineered with speeds
• Approved by How2Recycle • Lamination‐two layer, customer collaboration • Up to 30% PCR content
for in‐store drop off reverse print • BPI certified INDUSTRIAL by weight
• Seal‐ability, machinability, • Submitted for COMPOSTABLE • Recycle Ready
and durability How2Recycle approval • Developing film technology
• Moister and oxygen for HOME COMPOSTABLE
barrier requirements met • Know how on ASTM 6400
• Maintains machine speeds testing requirements
• Available with up to 15% • Strong relationships
PCR content by weight in throughout the industry:
sealant lamination layer composters, BPI, forums,
universities, suppliers
27Making strides towards a circular economy for plastics
We share the Ellen MacArthur Foundation’s common vision of a
circular economy for plastic, where plastic never becomes waste
TC Transcontinental is the first Canadian-based manufacturer to
join the Ellen MacArthur Foundation’s New Plastics Economy Global
Commitment
Our 2025 Commitment:
100% of plastic packaging to be
reusable, recyclable, or compostable
10% of our plastic supply will come
from post consumer recycled content
We will collaborate towards increasing
recycling and composting rates for
plastic
28Integrating the recycling of plastics in our production chain
Our equipments are used for converting plastic waste recovered from sorting
facilities and other commercial, industrial and agricultural sources into recycled
plastic granules providing a stable procurement of recycled resin.
Our recycling activities allow us to offer our customers
eco-responsible packaging products that contain 29
recycled plastic, and accelerate its development.TC Transcontinental
Printing
www.tc.tc 30Recent achievements in Printing
Took swift actions at the onset of the pandemic to maintain profitability and
deliver solid free cash flows through the crisis
Demonstrated ability in FY2020 to maintain 20% Adj. EBITDA margin excluding
subsidy despite impact of COVID-19 ($271M organic revenue decline)
Optimizing our manufacturing platform
Announced the closure of several plants (PEI, Quebec City, Gatineau and
Winnipeg)
Simplifying overhead structure to reduce indirect costs
Acquisition of Artisan Complete to increase our presence in a growth vertical
(In-Store Marketing)
Invested more than $10 million in its book printing platform meet the demand
from North American customers
We will continue to take action to ensure we generate
strong free cash flow in our Printing sector
31Printing outlook
Monitor volume trends and proactively adjust cost
structure to protect profitability
Expect operating earnings to grow in FY2021
Grow our revenues from verticals with growth
potential like in-store marketing product, book
printing and premedia services
Continue to generate significant cash flow
32Offering a state-of-the-art national printing network
12
printing plants
BRITISH COLUMBIA: 1 plant
• Transcontinental Vancouver
QUÉBEC: 5 plants
~3,700
ALBERTA: 1 plant • Transcontinental Interglobe, Beauceville (Books)
• Transcontinental Calgary • Transcontinental Interweb, Boucherville (Mag/Cat)
• Transcontinental Ross-Ellis, Montréal (Commercial)
ONTARIO: 4 plants • Transcontinental Transmag, Montréal
• Transcontinental Aurora (ISM) • Transcontinental Saint-Hyacinthe
• Transcontinental Brampton (ISM)
• Transcontinental RBW Graphics, Owen Sound NOVA SCOTIA: 1 plant
employees
• Transcontinental Vaughan • Transcontinental Halifax
33
Note: Includes the consolidation of Holland & Crosby and Artisan Complete in Brampton, ON and
excludes Transcontinental LGM – Coronet (Winnipeg) plant (closure in January 2021)Dynamically adapting Print’s portfolio to market
Printing Revenues by product / market
ISM / Book /
ISM / Book /
Premedia News / Mag ISM / Book /
News / Mag Premedia
11% / Comm Premedia
/ Comm 18%
26% 24%
News / Mag / 29%
Comm
42% FY2015 FY2019 FY2020
Flyers /
Distr.
47% Flyers / Flyers /
Distr. Distr.
53% 50%
Through acquisitions, divestitures and organic transformation, a growing portion of
the portfolio is composed of activities with favourable growth opportunities.
Including our Media Sector, this would represents close to 30% of Print’s revenues.
Flyers continue to generate significant revenues due to unmatched reach and
return on investment for retailers.
Print’s portfolio today is much more resilient with lower exposure to Newspapers,
Magazines and Commercial printing and continues to generate strong profitability
and free cash flow.
34
Note: Revenue segmentation based on estimated manufacturing revenues.In-Store Marketing (ISM)
A growth vertical within our Printing sector
Grew from less than $7M annualized revenues in 2012 to a
run-rate of ~$140M (through organic growth & acquisitions)
Acquisition of Holland & Crosby and Artisan Complete to
complement our product/service offering and provide scale
Significant cost synergies have been identified and implemented,
allowing margins improvement
Strong customer relationships, internal capabilities and
attractive revenue synergies from acquisitions will contribute
to generate organic growth
Significant opportunities for consolidation in an extremely
fragmented market
Customized
displays
Retail environments 35
Preparing back-to-businessIn-Store Marketing (ISM)
A vertical with growing sub-segments
Promotional Printing and production of predominantly
Point of high-frequency customized promotional
Purchase (POP) materials
Permanent signage, wayfinding,
Permanent
branding, department & information
Signage with installation management
Print and Assembly of customized
merchandizing displays, in-store
Display & Decor signage, low frequency promotional
displays for CPGs
Relations built with Canadian retailers over the years and recent
acquisitions should allow us to grow in all ISM markets
36TC Media
www.tc.tc 37Media Sector now focused on Educational Material and
Groupe Constructo
Completed the transformation in Media Sector with the sale of
the majority of our specialty media assets and event planning
activities. The sector no longer rely on publicity revenues.
The Media Sector now represents ~$70 million annually (3% of
our consolidated revenues)
Educational Material and Constructo Group delivering solid and
predictable cash flow
Excellent financial performance in FY2020 with limited impact
from COVID-19
9% organic revenue growth and solid profitability in FY2020
Our vision is to maintain our position as the leading Canadian
French-language educational publishing group
38Overview
TC Transcontinental Overview
Our Business Sectors
Conclusion
www.tc.tcWe have a strong financial position to benefit from the
recovery and accelerate our transformation
Investment grade credit rating
Net indebtedness ratio of 1.8x, providing the flexibility to
accelerate growth organically and through acquisitions
Access to over $610 million in liquidity (cash and undrawn
credit facilities) and limited upcoming maturities
With its strong cash flow generation and real estate portfolio,
the Printing segment could repay the entire long-term debt,
leaving an unlevered Packaging segment
With its resilient nature and growing markets, the Packaging
segment is key to unlock shareholder value
40Conclusion
The pandemic has highlighted our resilience, agility and
operational excellence
We are well positioned to grow organically in Packaging
and to benefit from a gradual recovery in Print
We have a solid financial position, generating strong and
consistent cash flows providing the flexibility to grow
organically and through acquisitions
41Contact information Yan Lapointe Director, Investor Relations Transcontinental Inc. 1 Place Ville Marie, Suite 3240 Montréal (QC) H3B 0G1 www.tc.tc Telephone: 514 954‐3574 yan.lapointe@tc.tc
You can also read