Third Quarter 2020 Earnings Supplement - PAYMENT TECHNOLOGY PARTNER
←
→
Page content transcription
If your browser does not render page correctly, please read the page content below

PAYMENT TECHNOLOGY PARTNER

Third Quarter 2020
Earnings Supplement

Disclaimer

    General
    All references in this presentation to “Nuvei”, the “Company,” “we,” “our,” “ours,” “us” or similar terms refer to Nuvei Corporation, together with its subsidiaries. All references to “$”, “US$”, “dollars” and “U.S.
    dollars” are to United States dollars and all references to “C$” are to Canadian dollars.
    Non-IFRS Measures and Industry Metrics
    This presentation makes reference to certain non-IFRS measures, namely Adjusted EBITDA and Adjusted Net Income. These measures are not recognized under International Financial Reporting Standards
    (“IFRS”) and do not have a standardized meaning prescribed by IFRS and are therefore unlikely to be comparable to similar measures presented by other companies. Rather, these measures are provided as
    additional information to complement those IFRS measures by providing further understanding of our results of operations from management’s perspective. Accordingly, these measures should not be
    considered in isolation nor as a substitute for analysis of our financial information reported under IFRS. These non-IFRS measures are used to provide readers with supplemental measures of our operating
    performance and thus highlight trends in our core business that may not otherwise be apparent when relying solely on IFRS measures. We also believe that market participants frequently use non-IFRS
    measures in the evaluation of issuers. Our management also uses non-IFRS measures in order to facilitate operating performance comparisons from period to period, to prepare annual operating budgets and
    forecasts and to determine components of management compensation. Please refer to “Non-IFRS Measures and Reconciliation of Non-IFRS Measures” in Appendix A of this presentation and our Management
    Discussion and Analysis dated November 10, 2020 (“MD&A”) and available on our profile on SEDAR at www.sedar.com.
    In addition, “Transaction Volume” is an operating metric used within our industry. Total volume does not represent revenue earned by us, but rather the total dollar value of transactions processed by
    merchants under contractual agreement with us. See “Key Performance Indicator” in our MD&A.
    Forward Looking Information
    This presentation contains “forward-looking information” within the meaning of applicable securities laws. Such forward-looking information includes, but is not limited to, information with respect to our
    objectives and the strategies to achieve these objectives, as well as information with respect to our beliefs, plans, expectations, anticipations, estimates and intentions.
    Forward-looking information involves known and unknown risks and uncertainties, many of which are beyond our control, that could cause actual results to differ materially from those that are disclosed in or
    implied by such forward-looking information. These risks and uncertainties include, but are not limited to, those described under “Risk Factors” in the Company’s supplemented prep prospectus dated
    September 16, 2020 and available on our profile on SEDAR at www.sedar.com.
    Forward-looking information is based on management’s beliefs and assumptions and on information currently available to management. Although the forward-looking information contained in this presentation
    is based upon what we believe are reasonable assumptions, you are cautioned against placing undue reliance on this information since actual results may vary from the forward-looking information.
    Consequently, all of the forward-looking information contained in this presentation is qualified by the foregoing cautionary statements, and there can be no guarantee that the results or developments that we
    anticipate will be realized or, even if substantially realized, that they will have the expected consequences or effects on our business, financial condition or results of operation. Unless otherwise noted or the
    context otherwise indicates, the forward-looking information contained in this presentation is provided as of the date of this presentation, and we do not undertake to update or amend such forward-looking
    information whether as a result of new information, future events or otherwise, except as may be required by applicable law.
    Trademarks
    This presentation includes certain trademarks, such as “Nuvei”, “SafeCharge”, and “Smart2Pay”, which are protected under applicable intellectual property laws and are the property of Nuvei. Solely for
    convenience, our trademarks referred to in this presentation may appear without the ® or ™ symbol, but such references are not intended to indicate, in any way, that we will not assert our rights to these
    trademarks to the fullest extent under applicable law. All other trademarks used in this presentation are the property of their respective owners.

2
Disclaimer

    Company Overview

3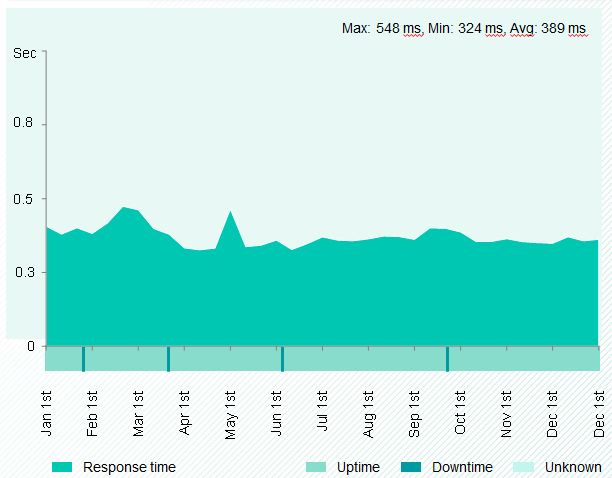
Nuvei: A Global Provider of Payment Technology Solutions

                                        800+                                                                 Canada
                                                                                                           (Global HQ)                    United Kingdom
                                     Employees*
                                                                                                                                                    Italy
                                                                                           United States                  Netherlands *
                                                                                                                                                                   Bulgaria
                                                                                                                            Spain*
                                                                                                                                                                                         China
                                        200+                                                                                                                       Cyprus

                                   Global Markets                                                                                                                   Israel

                                                                                                                                                       Romania *

                                                                                             Mexico                                                                          Singapore

                                          450                                                                                     Brazil *
                               Payment Methods*

                                        ~150                                                                             Key relationships, licenses & memberships:
                                      Currencies                                                                                                                                          *

    (*) Reflects successful completion of the Smart2Pay Transaction on November 2, 2020.

4
Our Purpose

    Making our world a local
    marketplace.

5                 CONFIDENTIAL – DO NOT DISTRIBUTE
How We Do It
    Provide the payment technology and
    intelligence our merchants and partners
    need to succeed locally and globally,
    through one integration.

6                   CONFIDENTIAL – DO NOT DISTRIBUTE
Leverage Our Full Stack to Increase Acceptance Rates – Locally & Globally
           Purpose-built technology platform providing an end-to-end solution, beyond acquiring,
            that merchants can utilize on a modular “a la carte” basis across multiple jurisdictions

                                                                           Acquiring Bank
                                       Native Commerce Platform
                                                                                                 Payment Network / Methods

                                                                               Direct
                                                                             Connectivity
                                    Global    Acquiring &    Currency
                                   Gateway      APMs        Management

                                                                                                                             Issuer /
                                                                                                                             Issuing
                                                                                                                              Bank
Consumer           Merchant        Global    Fraud / Risk   Value-Added
                                   Pay-out   Management       Services

                                                                           3rd Party Merchant
                                                                          Acquirer / Processor

7
Delivering Innovative Payment Technology Solutions Across All Channels
Unattended
Mobile / In-App eCommerce In-Store
Via API or Multi-Feature Cashier
8Modular Architecture for Merchant Friendly “A La Carte” Service Offerings
Nuvei Commerce Platform Use Cases
Local
Gateway Alternative Cashier and Integrated FX Reconciliation & Value-added
Acquiring, Smart 3DS
Technology Payments Checkout Management Reporting Services
Globally
Gateway
Technology Only
Multi-solutions
One-stop
Solution
9Disclaimer
Strategic Pillars
10One Integration to Our Nuvei Commerce Platform, A World of Opportunity
Our strategic pillars
GLOBALLY CONNECTED
INNOVATIVE & FLEXIBLE
RELIABLE & SECURE
11A Global Platform: Removing Payment Barriers Worldwide
Seamless Merchant Experience Across Countries and Channels
One Integration One Relationship
Enhanced and Integrated and
Global Technology Local Acquiring, Local & Alternative
Simplified Comprehensive
and Gateway Globally Payment Methods
Reconciliation FX Solutions
12Local Acquiring on a Global Scale Direct Acquiring Connect to Acquiring Partners In Development 13
Accepting More Payment Types

            450 Alternative and Local Payment Methods in ~150 Currencies

                           Note: Reflects successful completion of the Smart2Pay Transaction on November 2, 2020.

14
Driving Frictionless Experiences With Our Pay-in Capabilities
Acquirer Agnostic Developer-Friendly APIs Cashier and Checkout
Gateway supports connectivity to Seamlessly integrate payments into Embedded payment pages with
many independent acquirers desired consumer experience deep customization, adhering to local
compliance requirements
Localization Tools Transaction Approval One-Click Checkout
Preferred local payment method Smart routing, partial approvals, decline Merchant-agnostic global token
Local language and currency recovery to optimize conversion rate facilitates seamless checkout
15Increasing Transaction Conversion and Approval Rates
Real-Time Localized Pages for
Smart Routing Currency Management
Prediction engine that defines, configures and Automatically detects customers’ geolocation and
updates an optimized route to enhance displays relevant language, currency and payment
authorization rates options
Partial Approval Decline Recovery
Enables approval of partial transaction Upon decline, customer is automatically prompted
amounts for users with limited available funds to select different payment method / amount
16
16Supporting Global Pay-Outs
Merchant approves pay-out
Our Key Features 1
request (managed online)
• Automated global payouts in ~150 currencies and fast settlements on
a global basis
2 Payee is notified and selects
pay-out method and currency
• Split payment and management of fund transfers
• Net deposit feature facilitates AML compliance and fraud reduction 3
Nuvei processes request and
validates the transaction
Growing Number of Critical Use Cases Across Verticals
Nuvei transfers funds in
4 selected currency to the
selected payment method
Payee receives funds
Payroll 5
Insurance Claim Cross-Border Merchant Gaming Winnings almost immediately
Disbursement B2B Payments Pay-Out Disbursement Disbursement
17Providing Merchants and Partners with Data-Driven Back-Office Tools
Cloud-based, integrated and customizable reporting dashboard providing
real-time access into transaction metrics and other business intelligence
Cost breakdown at transaction level details | Approval rate management | Pricing at specific volume tiers | Chargeback management | Analyze risk levels | Payout reconciliation
18Delivering Maximum Uptime and High-Speed Processing
Reliable Execution Average response
• Two redundant data centers time of 0.4 seconds
• Continuous synchronization 4 minutes of
• Active-Active configuration downtime in 2019,
resulting in
99.999% uptime
Scalable Infrastructure
• Capacity to absorb up to 10x volume spikes
• Track record of uninterrupted service on Transactions per
merchants’ peak volume days minute reach 5K+,
with average latency
Excellent Service of 1 second
(2019 Grand National)
• Systems monitored 24x7x365
10:00
10:20
10:40
11:00
11:20
11:40
12:00
12:20
12:40
13:00
13:20
13:40
14:00
14:20
14:40
15:00
15:20
15:40
16:00
16:20
16:40
17:00
17:20
17:40
18:00
18:20
18:40
18:59
19Ensuring the Highest Level of Security and Compliance Integrated solutions that provide actionable fraud and risk intelligence Transaction risk Global token Chargeback Frictionless eKYC Smart 3DS management management and AML checks Helping merchants Helping merchants Streamlining a time- Enhancing compliance & Helping merchants reduce chargebacks comply with GDPR consuming and costly transaction success rates comply with latest and manage fraud & reduce PCI scope process for merchants while reducing costs PSD2 regulations 20
Disclaimer

     Go-To-Market Strategy

21
Our Go-To-Market Strategy
Direct Channel | Large Enterprises Indirect Channel | SMBs / Large Enterprises
• Fast-growing vertical-focused and regional
sales teams headed by industry veterans $
Independent eComm
o Hired new Chief Commercial Officer and Sales Agents Resellers
regional general managers and added sales
team members across key markets
• Supported by sales engineers and account ISVs Payment Online
managers with vertical expertise VARs Facilitators Marketplaces
Strategic Platform Integrations
Note: Reflects successful completion of the Smart2Pay Transaction on November 2, 2020.
22We Serve Thousands of Merchants Globally, Across High-Growth Verticals
Regulated Online Digital Goods Regulated
Social Gaming Online Retail Travel
Online Gaming Marketplaces & Services Financial Services
Sales TAM / CAGR
$174B / 16% $201B / 8% $6.3T / 13% $7.3T / 27% $4.1T / 8% $187B / 6% $1.1T / 13%
(2020E – 2027E) (2019A – 2023E) (2019A – 2024E) (2018A – 2024E) (2019A – 2024E) (2020E – 2025E) (2017A – 2023E)
Note: Reflects successful completion of the Smart2Pay Transaction on November 2, 2020. Sales TAM size figures represent expected size at end of respective forecast period.
Sources: eMarketer, Grand View Research, Newzoo, IMARC Group, Statista, Market Research Future and management estimates on the basis of these and other industry reports.
23Executing on Multiple Growth Opportunities
Expanding New merchant Product M&A
geographic footprint growth innovation
Launched local processing Numerous large merchant Received gaming service Closed acquisition of
solutions in Russia, Brazil, wins, including Carousel, provider licenses in Indiana Smart2Pay, significantly
Colombia, Hong Kong and Kwiff, Maxbet, Superbet, and Colorado and onboarded expanding geographic reach
Singapore Wargaming, Oanda, first two Cryptocurrency and presence in digital
Pepperstone and Rinascente exchanges gaming
24Closed Smart2Pay Acquisition
INTEGRATING SMART2PAY INTO
THE NUVEI BRAND AND PLATFORM
25Smart2Pay Transaction Rationale
Smart2Pay is our go-forward APM microservice enhancing our ability to identify and integrate with APMs worldwide
• Further diversifies the revenue mix across verticals and reduces customer concentration
Enhanced Scale &
Diversification
• Expands Nuvei’s geographic reach and customer type with Smart2Pay’s mix of merchants, bank and PSP partners, and marketplace clients
• Strengthens Nuvei’s presence in the high-growth digital gaming space with established relationships with leading players
• Complementary technology stacks widen breadth of solutions offered to merchants, increase cross-selling opportunities, and allow combined
company to leapfrog current product development roadmap
Complementary
Technology Offerings • Both offerings are built on a payment-centric foundation, minimizing the need for technical refactoring upon integration
• Common support for popular third party applications, including 3D Secure, will make it seamless for developers to access functionalities offered by
each company upon integration
• This acquisition creates one of the largest and most complete APM solutions providers with 450 alternative payment methods supporting
Strengthens Merchant global commerce
Value Proposition
• Immediately enhances Nuvei’s “follow the sun” service plan with local support in global locations such as Romania, Spain, and the
Netherlands
Enhanced Financial
Profile
•
•
Attractive growth and business model
eCommerce solutions provide a higher level of merchant retention and generally have lower attrition rates
Expanded Sales &
Revenue Opportunities
• Significant revenue opportunities exist by leveraging Nuvei’s growing global sales force to sell Smart2Pay’s white label product and
services
26Smart2Pay Overview
Smart2Pay expands our payment capabilities for marketplaces & social gaming
• Enhances our ability to provide a wider breadth of APMs and cards via a single API, in addition
to delivering faster speed to market for new APMs to international merchants, marketplaces,
Expanding our Geographic Footprint
banks, and PSPs: SOUTH EUROPE
• Merchants: Connects merchants with any payment method globally through one contract and AMERICA
one technical interface to help with complex, cross border payments
Netherlands
• Marketplaces: Accepts payments from customers and distributes funds to the marketplace
and its participating shops Brazil
• Banks and PSPs: Helps banks and payment service providers handle the increased
regulation and high standards of card schemes and is PCI compliant and licensed as a Romania
financial institution in the EU
• Smart payment platform features a unique 3 in 1 REST API that has a fully hosted payments
page, enabling a frictionless end-to-end payments experience Spain
• Full range of payment and adjacent services include online payment processing, integration,
security and monitoring, tokenization, invoicing, and reconciliation
Note: Countries highlighted indicate where Smart2Pay has office locations.
Business Highlights Smart2Pay at a Glance
Broad suite of alternative and international payment methods and adjacent services
across a spectrum of customers
# of Customers 750+ Settlement 10+
Strong payments proposition across fast-growing, low-risk verticals, particularly the Currencies
digital gaming industry
Agile technology platform that enables seamless payments integration with significant Countries with
presence across all geographies Payment
Customers 80+ Methods 200+
Serviced
Longstanding and cost-efficient development and operations base
Multiple integration options allows customers to choose the level of customization that
they desire, while taking cost and speed of integration into consideration
27Disclaimer
Financial Update
28How We Generate Revenue
Gateway Technology Acquiring Value-Added Services
• Fees for gateway services • Fees for payment processing • Fees for value-added services,
services such as analytics and insights
• Merchants are charged a per monitoring
transaction fee • Merchants are priced using a
percentage of volume, per • Pricing depends on service which
transaction fee, as well as other could be:
static fees
% based
fixed periodic; or
fixed transaction-based
29Financial Highlights
Total Volume Revenue Adjusted EBITDA*
+62% y/y 11.5
+32% y/y +59% y/y 41.0
93.6
Year-over-year
70.8
7.1 25.8
$(65.7) $(77.9) Net income /
(loss)
Q3 19 Q3 20 Q3 19 Q3 20 Q3 19 Q3 20
29% q/q +13% q/q +10% q/q
Quarter-over-quarter
11.5 93.6 41.0
82.6 37.4
8.9
$(31) $(69) $14.0 $(77.9)$(117) Net income /
(loss)
Q2 20 Q3 20 Q2 20 Q3 20 Q2 20 Q3 20
Volume in billions USD. Other amounts in millions USD.
30 *Adjusted EBITDA is a non-IFRS measure. Please find the reconciliation to the nearest IFRS measure in the Appendix.Disclaimer
Appendix
31Consolidated Statements of Profit or Loss and Comprehensive Loss
Three months ended September 30 Nine months ended Septe mber 30
(In thousands of U.S. dollars except for pe r
share amounts)
2020 2019 2020 2019
$ $ $ $
Revenue 93,599 70,752 259,165 166,489
Cost of revenue 17,007 12,173 45,736 27,683
Gross profit 76,592 58,579 213,429 138,806
Selling, general and administrative 61,398 62,689 168,499 138,405
O perating profit (loss) 15,194 (4,110) 44,930 401
Finance income (1,375) (1,532) (4,170) (4,058)
Finance costs 90,933 62,069 171,368 71,386
Net finance costs 89,558 60,537 167,198 67,328
Loss be fore income tax (74,364) (64,647) (122,268) (66,927)
Income tax expense (recovery) 3,505 1,049 3,979 (539)
Ne t loss (77,869) (65,696) (126,247) (66,388)
O ther comprehe nsive income (loss)
Foreign operations – foreign currency
(8,849) 1,836 14,461 843
translation differences
Total comprehensive loss (86,718) (63,860) (111,786) (65,545)
Net income (loss) attributable to: (78,579) (66,054) (127,956) (66,915)
Shareholders of the Company 710 358 1,709 527
Non-controlling interest (77,869) (65,696) (126,247) (66,388)
Comprehensive imcome (loss) attributable to
Shareholders of the Company (87,428) (64,218) (113,495) (66,072)
Non-controlling interest 710 358 1,709 527
(86,718) (63,860) (111,786) (65,545)
Ne t loss per share attributable to
common share holders of the company
Basic and diluted (0.88) (1.10) (1.49) (1.11)
No of share s weighted average 89,217,178 60,072,213 86,153,927 60,072,213
32Consolidated Statements of Financial Position
(in thousands of U.S. dollars) Sept em ber 30, Decem ber 31, Sept em ber 30, Decem ber 31,
2020 2019 2020 2019
$ $ $ $
Assets Liabilities
Current assets Current liabilit ies
Ca sh 9 9 ,4 2 6 6 0 ,0 7 2 T r a de a n d ot h er pa y a bles 5 7 ,4 7 7 5 1 ,2 5 8
T r a de a n d ot h er r eceiv a bles 3 1 ,8 8 0 3 4 ,0 6 9 In com e t a x es pa y a ble 153 2 ,8 6 6
In v en t or y 540 7 09 Cu r r en t por t ion of loa n s a n d bor r ow in g s 2 ,3 1 9 2 ,8 7 4
Pr epa id ex pen ses 1 ,6 4 8 964 Ot h er cu r r en t lia bilit ies 4 ,1 9 6 9 ,8 7 5
Cu r r en t por t ion of a dv a n ces t o t h ir d pa r t ies 7 ,9 1 4 8 ,9 0 1 Lia bilit y -cla ssified com m on sh a r es - 5 8 ,2 6 2
Cu r r en t por t ion of con t r a ct a sset s 1 ,7 5 5 1 ,7 2 0 Lia bilit y -cla ssified pr efer r ed sh a r es - 3 9 ,9 6 7
T ot a l cu r r en t a sset s befor e seg r eg a t ed fu n ds 1 4 3 ,1 6 3 1 0 6 ,4 3 5 T ot a l cu r r en t lia bilit ies befor e du e t o
6 4 ,1 4 5 1 6 5 ,1 0 2
m er ch a n t s
Seg r eg a t ed fu n ds 3 0 1 ,3 5 2 2 0 0 ,6 1 2
Du e t o m er ch a n t s 3 0 1 ,3 5 2 2 0 0 ,6 1 2
T ot a l cu r r en t a sset s 4 4 4 ,5 1 5 3 0 7 ,0 4 7
T ot a l cu r r en t lia bilit ies 3 6 5 ,4 9 7 3 6 5 ,7 1 4
Non-current asset s
Non-current liabilit ies
A dv a n ces t o t h ir d pa r t ies 4 1 ,4 4 2 4 2 ,5 8 4
Loa n s a n d bor r ow in g s 1 0 6 ,0 3 7 7 2 2 ,1 6 6
Pr oper t y a n d equ ipm en t 1 5 ,2 2 8 1 5 ,2 7 2
Defer r ed t a x lia bilit ies 7 ,5 7 2 1 2 ,9 7 6
In t a n g ible a sset s 3 6 2 ,2 3 4 4 0 8 ,3 8 0
Ot h er n on -cu r r en t lia bilit ies 2 ,2 6 3 4 ,8 7 5
Goodw ill 7 6 0 ,8 3 3 7 6 8 ,4 9 7
Un secu r ed con v er t ible deben t u r es du e t o
Con t r a ct a sset s 1 ,2 9 1 1 ,4 2 6 - 1 0 9 ,0 2 2
sh a r eh older s
Pr ocessor deposit s 1 3 ,2 9 2 1 2 ,4 7 8
Ot h er n on -cu r r en t a sset s 1 ,8 5 1 3 ,0 8 8 Total Liabilities 4 8 1 ,3 6 9 1 ,2 1 4 ,7 5 3
Total Assets 1 ,6 4 0 ,6 8 6 1 ,5 5 8 ,7 7 2
33Consolidated Statements of Financial Position (cont’d)
(in thousands of U.S. dollars) Sept em ber 30, Decem ber 31,
2020 2019
$ $
Equity
Equ i t y a t t r i bu t a bl e t o sh a r eh ol der s
Sh a r e ca pit a l 1 ,3 7 1 ,0 4 3 4 5 0 ,5 2 3
Con t r ibu t ed su r plu s 8 ,7 6 7 1 ,6 0 3
Deficit (2 3 2 ,7 6 8 ) (1 0 4 ,8 1 2 )
A ccu m u la t ed ot h er com pr eh en siv e in com e
4 ,0 7 6 (1 0 ,3 8 5 )
(loss)
1 ,1 5 1 ,1 1 8 3 3 6 ,9 2 9
Non -con t r ol l i n g i n t er est 8 ,1 9 9 7 ,0 9 0
Total Equity 1 ,1 5 9 ,3 1 7 3 4 4 ,0 1 9
Total Liabilities and Equity 1 ,6 4 0 ,6 8 6 1 ,5 5 8 ,7 7 2
34Consolidated Statements of Cash Flows
(in thousands of U.S. dollars)
2020 2019 2020 2019
For the nine months ended September 30 For the nine months ended September 30
$ $ $ $
Cash flows from operating activities Cash flows (used in) from financing activities
Net loss for the period (1 2 6,2 47 ) (66,3 88) Transaction costs related to loans and
(2 93 ) (2 7 ,4 91 )
borrowings
Adjustm ents for:
Redem ption of preferred shares - (2 ,2 99 )
Depreciation of property and equipm ent 4,1 42 2 ,1 1 5
Issuance of preferred shares - 81 ,2 40
Am ortization of intangible assets 47 ,1 2 1 3 1 ,969
Issuance of conv ertible debentures due to
Am ortization of contract assets 1 ,697 1 ,809 - 1 99,000
shareholders
Share-based pay m ents 7 ,2 07 7 67 Repay m ent of conv ertible debentures due to
(93 ,3 84 ) -
Net finance costs 1 6 7 ,1 98 67 ,3 2 8 shareholders
Issuance of Class B com m on shares 1 50 -
Im pairm ent on disposal of a subsidiary 338 -
Issuance of Subordinate Voting Shares, net of
Incom e tax expense (recov ery ) 3 ,97 9 (53 9) 7 1 9,886 -
issuance fees
Proceeds from loans and borrowings - 62 9,509
Changes in non-cash working capital item s 63 7 1 1 ,56 8 Repay m ent of loans and borrowings (642 ,7 86 ) (6 0,507 )
Pay m ent of lease liabilities (6 91 ) (7 01 )
Interest paid (42 ,2 93 ) (2 1 ,089)
Net realized loss on foreign currency
(5,93 7 ) - (1 7 ,1 1 8) 81 8,7 51
exchange
Incom e taxes paid (1 0,57 9 ) (2 ,083 )
Effect of movements in exchange rates on cash 1 ,3 86 40
47 ,2 63 2 5,4 57
Net increase in cash 3 9 ,3 54 6 8,861
Cash flows from (used in) investing activities Cash – Beginning of period 60,07 2 6,07 0
Business acquisitions, net of cash acquired - (7 80,1 96 )
Decrease (increase) in other non-current assets (1 ,080) 2 ,585 Cash – End of period 99,42 6 7 4,9 3 1
Proceeds from the sale of a subsidiary , net of
1 9,045 -
cash
Sale of equity inv estm ents - 2 1 ,800
Net decrease (increase) in adv ances to
2 ,1 2 9 (1 3 ,564 )
third parties
Acquisition of property and equipm ent (1 ,7 01 ) (1 ,3 4 9)
Acquisition of intangible assets (1 0,57 0) (4,663 )
7 ,82 3 (7 7 5,3 87 )
35Reconciliation from IFRS to Non-IFRS Results – Adjusted EBITDA
Three months e nded Nine months e nde d
September 30 Se ptember 30
Reconciliation from IFRS to Non-IFRS Results
(In thousands of U.S. dollars) 2020 2019 2020 2019
$ $ $ $
Net loss….......................................................................... (77,869) (65,696) (126,247) (66,388)
Finance costs…................................................................. 90,933 62,069 171,368 71,386
Finance income….............................................................. (1,375) (1,532) (4,170) (4,058)
Depreciation and amortization…..................................... 16,931 15,357 51,263 34,084
Income tax expense (recovery)….................................... 3,505 1,049 3,979 (539)
(a)
Acquisition, integration and severance costs …...... 2,418 13,898 5,297 17,129
(b)
Share-based payments …..................... 6,472 425 7,207 767
(c)
Net loss on foreign currency exchange …........... 778 125 3,118 2,602
(d)….....................................................................................................................
Other (802) 72 (146) 275
Adjusted EBITDA(e)…..................................................... 40,991 25,767 111,669 55,258
Advance from third party - merchant residual received 3,848 3,085 9,515 7,368
(a) These expenses relate to (i) professional, legal, consulting, accounting and other fees and expenses related to our acquisitions and financing activities completed during the period and our initial public
offering, (ii) acquisition-related compensation and deferred purchase consideration for previously acquired businesses, and (iii) integration expenses and severances paid.
(b) These expenses represent non-cash expenses recognized in connection with stock options and other awards issued under share-based plans.
(c) This includes gains or losses on foreign currency exchange included in selling, general and administration.
(d) This line item primarily represents legal settlements and associated legal costs reached outside of the normal course of business as well as non-cash gains, losses and provisions and certain other
costs.
(e) Adjusted EBITDA is a non-IFRS measure that the Company uses to assess its operating performance and cash flows.
36Reconciliation from IFRS to Non-IFRS Results – Adjusted Net Income
Thre e months e nded Nine months e nded
September 30 September 30
Reconciliation from IFRS to Non-IFRS Results
(In thousands of U.S. dollars) 2020 2019 2020 2019
$ $ $ $
Ne t loss…............................................................................... (77,869) (65,696) (126,247) (66,388)
Change in redemption value of liability-classified common and
58,952 35,720 76,438 38,128
preferred shares (a)…....................................
Accelerated amortization of deferred transaction costs / loss on
24,491 4,830 24,491 4,830
debt modification (b)................................................
Amortization of certain intangible assets (c)..................... 14,161 12,485 43,211 28,234
Acquisition, integration and severance costs (d)…......... 2,418 13,898 5,297 17,129
(e)
Share-based payments …................................................ 6,472 425 7,207 767
(f)
Net loss (gain) on foreign currency exchange …......... (9,544) 2,021 17,889 (955)
(g)….....................................................................................................................
Other (802) 72 (146) 275
Adjustments…..................................................................... 96,148 69,451 174,387 88,408
Income tax expense related to
(1,824) (1,563) (5,646) (5,038)
adjustments…......................................................................
(h)
Adjuste d net income …................................................. 16,455 2,192 42,494 16,982
Adjuste d net income pe r share attributable to common
share holders of the company (i)
Basic 0.18 0.03 0.47 0.27
Diluted 0.17 0.03 0.46 0.26
Please refer to notes on following page in reference to the above reconciliation.
37Reconciliation from IFRS to Non-IFRS Results – Adjusted Net Income (a) This line item represents change in redemption value related to shares classified as liabilities prior to the IPO. As part of the IPO, the shares were converted into equity as Subordinate Voting Shares. For the liability-classified common shares, the expense represents the fair value adjustment for the corresponding period, with the three months ended September 30, 2020 amount representing the IPO value of $26 per Subordinate Voting Shares. These expenses are included in finance costs. (b) With the repayment of long-term debt from the IPO proceeds, the associated deferred transaction costs were recognized in finance costs for the three months ended September 30, 2020 on an accelerated pro-rata basis. Additionally, in 2019 a loss on debt modification was recognized because of the incremental debt taken to fund the SafeCharge acquisition. (c) This line item relates to amortization expense taken on intangible assets created from the purchase price adjustment process on acquired companies and businesses and from the acquisition of all of the outstanding shares of the predecessor by Nuvei in September 2017 (as further described in the 2019 notes to the audited consolidated financial statements). (d) These expenses relate to (i) professional, legal, consulting, accounting and other fees and expenses related to our acquisitions and financing activities completed during the period and our initial public offering, (ii) acquisition-related compensation and deferred purchase consideration for previously acquired businesses, and (iii) integration expenses and severances paid. (e) These expenses represent non-cash expenses recognized in connection with stock options and other awards issued under share-based plans. (f) This includes gains or losses on foreign currency exchange included in finance costs and selling, general and administration. (g) This line item primarily represents legal settlements and associated legal costs reached outside of the normal course of business as well as non-cash gains, losses and provisions and certain other costs. (h) Adjusted net income (loss) is a non-IFRS measure that the Company uses to further assess its operating performance. (i) Diluted Adjusted net income per share is calculated using stock options outstanding at the end of each period on a fully diluted basis if they were in-the-money at that time. Potentially dilutive instruments converted or reimbursed as part of the IPO have been excluded. 38
MAKING OUR
 WORLD A LOCAL
 MARKETPLACE.

nuvei.com
You can also read