Visualizing Vitriol: Hate Speech and Image Sharing in the 2020 Singaporean Elections
←
→
Page content transcription
If your browser does not render page correctly, please read the page content below
Visualizing Vitriol: Hate Speech and Image
      Sharing in the 2020 Singaporean Elections?

              Joshua Uyheng1[0000−0002−1631−6566] , Lynnette Hui Xian
         1[0000−0002−2740−7818]
      Ng                     , and Kathleen M. Carley1[0000−0002−6356−0238]

      CASOS Center, Institute for Software Research, Carnegie Mellon University,
                             Pittsburgh PA 15213, USA
               {juyheng,huixiann,kathleen.carley}@cs.cmu.edu

        Abstract. Online hate speech represents a damaging force to the health
        of digital discourse. While text-based research in this area has advanced
        significantly, little work explicitly examines the visual components of
        online hate speech on social media platforms. This work empirically an-
        alyzes hate speech from a multimodal perspective by examining its as-
        sociation with image sharing in Twitter conversations during the 2020
        Singaporean elections. We further link our findings to bot activity and
        potential information operations to discern the role of potential digital
        threats in heightening online conflicts. Higher levels of hate speech were
        detected in bot-rich communities which shared images depicting the in-
        cumbent Prime Minister and other contested elections in the Asia-Pacific
        region. Implications of this work are discussed pertaining to advancing
        multimodal approaches in social cybersecurity more broadly.

        Keywords: Hate speech · Social cybersecurity · Elections · Images

1     Introduction

Scholars of digital disinformation recognize that the quality of online discourse
is negatively influenced not just by falsehoods, but also by targeted hate [9].
Online hate speech refers to abusive language directed toward specific identities
[6]. When it is salient on social media platforms, it can lead to the formation of
hateful communities, increase prejudice and polarization, and potentially trigger
instances of real-world violence [1,11,13,4]. Moreover, recent work indicates that
social bots may inorganically mobilize online hate to achieve tactical objectives,
?
    This work was supported in part by the Knight Foundation and the Office of Naval
    Research grants N000141812106 and N000141812108. Additional support was pro-
    vided by the Center for Computational Analysis of Social and Organizational Sys-
    tems (CASOS) and the Center for Informed Democracy and Social Cybersecurity
    (IDeaS). The views and conclusions contained in this document are those of the
    authors and should not be interpreted as representing the official policies, either ex-
    pressed or implied, of the Knight Foundation, Office of Naval Research or the U.S.
    government.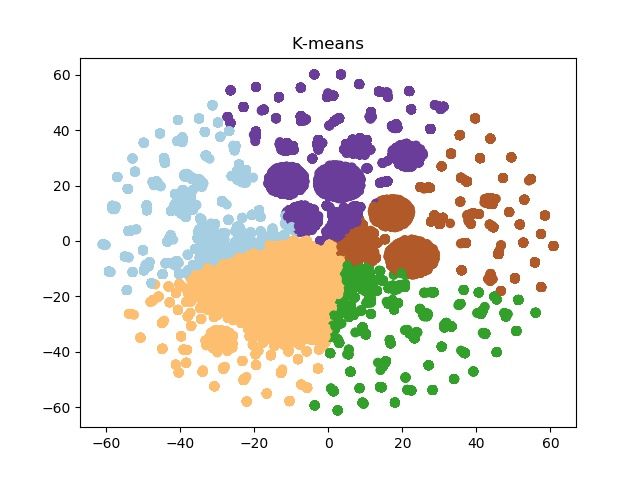
2       J. Uyheng et al.

taking advantage of existing social divisions to strategically sow discord in public
discourse [7,17].
    A relatively understudied area in this field, however, concerns the multimodal
nature of online hate [3,19]. Significant efforts tackle the automated detection of
online hate speech through the use of textual data [6,8]. But the sharing of im-
ages can play a powerful role in effectively communicating politically significant
messages [12]. Hence, it is important for researchers to examine how images play
a part in the spread of online hate speech, particularly in conjunction bot-driven
disinformation campaigns.
    This paper contributes to this burgeoning literature by analyzing image shar-
ing behaviors of social bots on Twitter during the 2020 Singaporean elections.
We are specifically interested in the ways bot accounts share certain images in
tandem with the spread of hate speech. In this view, the present work novelly
links the spread of images to (a) the activities of inauthentic actors, (b) the pro-
liferation of hate speech, within (c) the context of large-scale social networks.
While each aspect of this framework has been studied extensively in the past,
our work is some of the first to examine them in an integrated fashion.
    Empirical insights notwithstanding, we also present a flexible and general-
izable methodological framework for studying these phenomena together in a
social cybersecurity framework [5,18]. These may readily be adapted and ex-
trapolated to new contexts of disinformation research with similar analytical
goals. Finally, our findings pertain to Singapore, a country in the relatively un-
derstudied Asia-Pacific region, during a major national election during the global
COVID-19 pandemic. This adds to burgeoning efforts to advance more holistic,
non-Western scholarship as well as developing comparative efforts [16].
    In sum, we therefore aim to answer the following research questions:
 1. What images did social bots share during the 2020 Singaporean elections?
 2. What kinds of bot-driven image sharing behavior were linked to hate speech?

2     Data and Methods
2.1   Data Collection
We collected Twitter data surrounding the 2020 Singaporean elections using the
Twitter REST API. Search terms included official hashtags around the election
like ‘#sgelections2020’ and candidate-specific handles like ‘@wpsg’ or ‘@jamus-
lim’. The complete dataset contained 240K tweets and 42K unique users. Based
on this dataset, images were downloaded from tweets if they were present. A
total of 52K images were collected.

2.2   Image Analysis
Image Representation. Each image was represented using the ResNet50 image
model [10] implemented with Tensorflow in Python. Feature dimensions were fur-
ther reduced to 100 principal components using Principal Component Analysis
Hate Speech and Image Sharing 3
(PCA). To visualize such high dimensional data, we used t-distributed stochastic
neighbor embedding (t-SNE).
Image Clustering. To identify groups of images, we performed image clustering
over the vector representations of each image. Five clusters were chosen for their
distinct separation of image clusters. Every image was assigned to a cluster
number based on their Euclidean distance to the cluster center in the projected
space.
2.3 Bot Detection
Bot detection was performed using the BotHunter algorithm, which relies on an
engineered collection of account-level metadata as a generalizable feature set [2].
The BotHunter model has been trained on a wide variety of labeled bots from
known information operations and previously applied successfully in empirical
studies of national elections worldwide [15,16]. For each user in our dataset,
BotHunter provided a probability quantifying the likelihood that the account
was inorganic.
2.4 Hate Speech Analysis
To perform hate speech detection, we used a machine learning classifier based
on prior work [17]. The classifier achieved 83% weighted F1 score on a seminal
benchmark dataset of hate speech, and had also been previously used in empirical
studies of digital disinformation [6]. For each tweet, it produced a probability that
the tweet was hate speech, which was the category of interest; offensive speech,
which denoted potentially profane language not necessarily targeted toward a
particular group; or regular speech.
2.5 Hierarchical Regression Modelling
Using the variables produced through the tools above, we quantified the extent to
which bot-driven image sharing predicted higher levels of hate speech. Our unit
of analysis was the Leiden group, which refers to computationally derived clusters
of the social network representing the Twitter conversation [14]. Each user was
represented as a node connected by edges with weights corresponding to the sum
of all retweets, replies, mentions, and quotes between agents. Additionally, as
control variables, we used the structural features of each Leiden group, including
cluster size, the clustering coefficient, the E/I index, and the Cheeger score [17].
Within each derived Leiden community, we obtained the proportion of bots,
the image sharing for images belonging to cluster, and the average hate speech
probability. We also had control measures to test the robustness of bot-driven
effects. To estimate the relationships between these variables, we examined three
models in a hierarchical regression setup: (a) a base model predicting cluster hate
solely as a function of image sharing, (b) a bot model adding cluster bot activity
with interaction terms, and (c) a bot model with interaction terms and cluster
structural features as controls.4 J. Uyheng et al.
Fig. 1. Low-dimensional t-SNE visualization of images colored by k-means cluster.
3 Results
3.1 Image Clusters in Singaporean Elections
Five clusters were selected as best separating the images into different groups.
Figure 1 depicts the t-SNE visualization of image representations broken down
between k-means clusters. We interpret overarching themes in image clusters
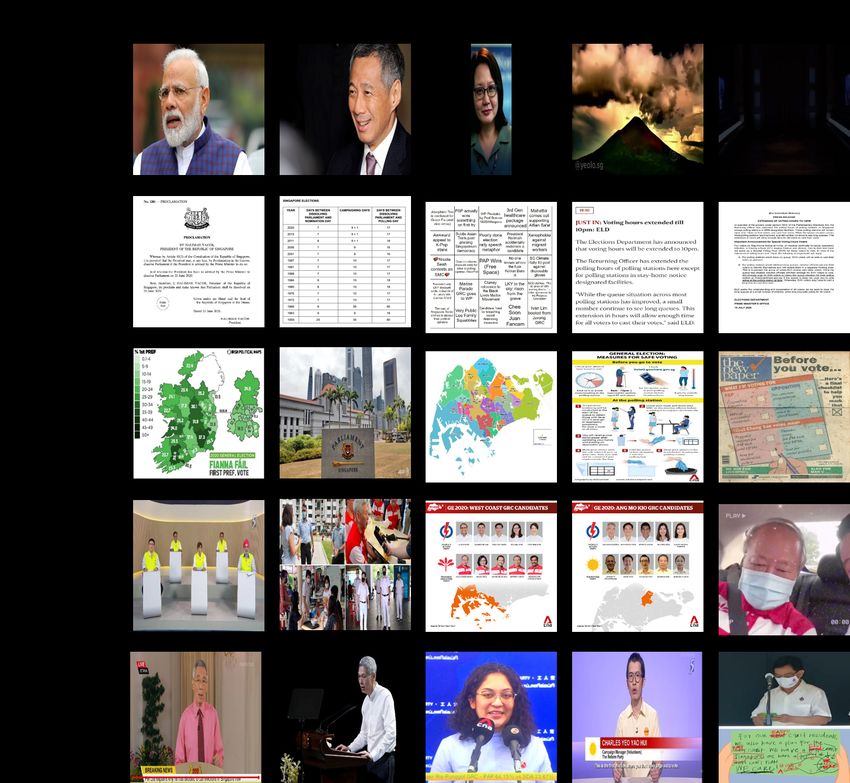
based on representative images in each cluster as shown in Figure 2.
Image Cluster 1: Key electoral figures. Accounting for 18% of the im-
ages, the first cluster presents images of key people in the two largest political
parties in Singapore: of Mr. Lee Hsien Loong from People’s Action Party and
Sylvia Lim of Workers’ Party. In addition, this cluster picked up images of Prime
Minister Modi of India, where he addressed his nation on Mann Ki Baat day and
World Youth Skills Day in July 2020. There are two images of note: a volcano
spewing ashes and a dark image with a faint box. Both images are in abundant
in this cluster and are written by a single Twitter user with the following tweets:
“Where #GE2020 is an opportunity to redeem yourself.” and “So after squinting
I realised the #GE2020 icon is a red ballot box and the flag. And not [image]”.
Image Cluster 2: Writ of elections and election-related news. Ac-
counting for 16% of the images, this smallest cluster of images depicts images of
the writ of election which was issued as the Singapore Elections was called, and
other related news reports such as the extension of voting hours.
Image Cluster 3: Infographics on safe elections during COVID-19.
Another 23% of the images presented infographics on the measures in place to
conduct a safe election during a pandemic. Interestingly, images on the Irish
electoral boundaries were harvested with the same hashtag, as The Irish Times
used the hashtag #ge2020 while discussing the Irish election results. The Irish
elections took place in February 2020, and a series of post-election analysis were
released in July 2020. We note that this may confound some of the succeeding
findings.
Image Cluster 4: Campaign posters and candidate news. Another
23% of images described the contesting candidates and their campaign trails.Hate Speech and Image Sharing 5
Fig. 2. Sample images in each image cluster. Cluster 1: Key electoral figures. Cluster
2: Writ of elections and election-related news. Cluster 3: Infographics on safe elections
during COVID-19. Cluster 4: Campaign posters and candidate news. Cluster 5:
Campaign speeches.
These include debates, candidate walkabouts, selfies, and information about the
candidates vying for posts in the electoral divisions.
Image Cluster 5: Campaign speeches. This fifth cluster consists of 20%
of the images, and represents Prime Minister Lee Hsien Loong giving a speech on
national television announcing the elections, as well as candidates giving their
campaign speeches. As this election was held during the COVID-19 pandemic,
the campaign speeches were given through virtual means, hence the collected
images are usually images of television broadcasts.
3.2 Images Linked to Bots, Hate Speech, and Offensive Speech
Table 1 summarizes our joint analysis of image sharing in conjunction with bot
predictions and hate speech predictions. Given the above image clusters, we6 J. Uyheng et al.
Table 1. Summary of predictions for bots, hate speech, and offensive speech by based
on image sharing behavior. The bolded quantity in each column signals the image
cluster with the highest value for each measurement.
Image Cluster Bot Shares Hate Speech Offensive Speech
(80% Threshold) (50% Threshold) (50% Threshold)
No Image 35.10% 0.05% 6.23%
Cluster 1 37.61% 0.00% 6.95%
Cluster 2 37.78% 0.00% 0.64%
Cluster 3 27.02% 0.00% 10.95%
Cluster 4 40.37% 0.00% 4.13%
Cluster 5 38.64% 0.00% 0.38%
considered the proportion of image shares associated with accounts classified as
bots at a 80% probability threshold [17], as well as the proportion of tweets
containing these images predicted to be hate speech or offensive speech at a 50%
threshold.
Bot activity. Bot activity was notable and relatively consistent across image
clusters, approximately ranging between 27-41%. Notably, Cluster 4 had the
highest proportion of shares from predicted bot accounts, with 40.37% shares by
predicted bots. This indicates that a larger proportion of the online conversation
around campaign posters and candidate news was dominated by bots. A two-
sample test for equality of proportions suggests that with statistical significance,
this is much higher than tweets which did not share any images (χ2 = 135.91, p <
.001).
Meanwhile, the cluster featuring the lowest level of bot shares was Cluster
3, with 27.02% of shares accounted for by bots. Hence, more human accounts
were sharing images related to infographics on safe elections during COVID-19.
A similar statistical test indicates that this is a much lower proportion of bots
relative to the baseline of tweets without images (χ2 = 331.00, p < .001).
Hate speech. Crucially, we found that our hate speech model did not assign hate
speech probabilities greater than 50% to any tweet which had shared an image.
Actual predictions of hate speech only constituted 0.05% of remaining tweets
which had not shared an image. From a broad perspective, this indicates that
relative levels of hate speech during the 2020 Singaporean elections were quite
low.
Offensive speech. That said, numerous tweets which shared an image did have
offensive speech probabilities higher than 50%. In particular, we note that Clus-
ter 3 had the highest share of offensive speech, with about 10.95% of tweets -
a striking result given that this is the same cluster with the lowest level of bot
activity. A two-sample test for equality of proportions against suggests that with
statistical significance, this is a much higher level of offensive language relative toHate Speech and Image Sharing 7
Hateful Image Sharing by Bots
Community−Level Hate Speech Predicted by Bots and Image Clusters
Base Model Model with Bots Model with Bots and Controls
ICluster1
ICluster2
ICluster3
ICluster4
ICluster5
Coefficient
BotProportion
ICluster1 x Bots
ICluster2 x Bots
ICluster3 x Bots
ICluster4 x Bots
ICluster5 x Bots
Clustering
Cheeger
Density
−10 0 10 20 −10 0 10 20 −10 0 10 20
Estimated Coefficients (with 95% Confidence Intervals)
Fig. 3. Results of hierarchical regression modelling on the relationships between
community-level image sharing and bot activity with levels of hate speech. Error bars
indicate 95% confidence intervals for estimated coefficients.
tweets without images (χ2 = 419.59, p < .001). Hence, image sharing related to
COVID-19 electoral guidelines were primarily human-driven, but also attended
by some offensive talk, even if not necessarily hateful.
In contrast, extremely low levels of offensive speech were detected in relation
to Cluster 2, with 0.64% of shares linked with offensive speech; and Cluster
5, with 0.38% of shares linked with offensive speech. Relative to the baseline
without images, Cluster 2 features significantly lower offensive speech (χ2 =
438.17, p < .001); as does Cluster 5 (χ2 = 624.23, p < .001). Thus, extremely
small amounts of the discussion surrounding images of the writ of elections and
virtually delivered campaign speeches appeared to be offensive.
3.3 Community-Level Image Sharing Dynamics
In view of the foregoing statistics, we finally conduct hierarchical regression
tests to determine the relationships between image sharing, bot activity, and
community-level hate speech. Figure 3 depicts the estimated coefficients for each
model.
Model 1 (R2 = 0.3124, p < .05), the base model, features only image sharing
behavior to predict cluster-level hate speech. An R2 -change test indicates that
Model 2 (R2 = 0.6105, p < .01), the model with bot activity, adds significant
information to the base model (∆R2 = 0.2980, F = 3.4432, p < .05). The addi-
tion of structural controls in Model 3 (R2 = 0.6227, p < .05), on the other hand,
does not add significant information to Model 2 (∆R2 = 0.0122, F = 0.1428, p =
0.98). Hence, the estimated relationships between bot activity and image sharing
with hate speech were robust to differences in cluster-level structural features.
The succeeding analysis relies on values obtained in Model 2.8 J. Uyheng et al.
Three image sharing behaviors appear most closely linked to community-level
hate. Most strikingly, we observe the significant interaction effect between bot
activity and sharing images from Cluster 1 as positively predictive of higher hate
speech levels (b = 134853, SE = 4.3935, p < .01). The main effect of Cluster 1,
however, is negatively predictive of hate speech (b = −6.0700, SE = 1.7983, p <
.01). This indicates that in communities made up predominantly of humans,
image sharing related to electoral figures features relatively low levels of hate
speech. However, in communities which do feature high levels of bot activity,
discussion of these images features much higher levels of hate. Collectively, these
findings suggest that these images may be targeted by inauthentic actors for
hostile messaging.
A second important relationship we observe concerns Cluster 2, which has a
positive relationship with hate speech (b = 3.3672, SE = 0.6374, p < .001). In-
terestingly, the interaction effect with bot activity is also statistically significant,
but negative (b = −3.6932, SE = 1.0772, p < .01). This suggests that human
discussion of images related to the writ of elections is more likely to be hateful,
without bot involvement. This resonates with earlier findings on higher levels of
offensive speech among sharers of images from Cluster 2, but low levels of bot
activity. These results point to organic hostilities in relation to these news items,
but likely not as the targets of bot-driven information operations.
Finally, we observe the modest yet positive association of Cluster 4 with
hate speech (b = 0.6207, SE = 0.2785, p < .05). This indicates that communities
sharing images related to campaign posters and candidate news may feature
small levels of hate. However, the interaction with bot activity is not statistically
significant, indicating that information operations are not necessarily associated
with higher or lower levels of hate related to these images on average.
4 Conclusions and Future Work
This work characterized patterns of online image sharing linked to bot activity
and hate speech during the 2020 Singaporean elections. More specifically, we
identified major themes in the types of images which were salient in online
electoral discourse, and determined how their community-level prevalence may
have been driven by inauthentic activities and associated with higher levels of
toxicity.
From a practical standpoint, our most significant findings point to: (a) low
baseline levels of hate but high baseline levels of bot activity in the general
conversation, (b) extremely low levels of bot activity around images of COVID-
19 regulations for safe elections, (c) modest but organic levels of offensive and
hateful talk around candidate posters and the writ of elections, and (d) targeted
hostilities toward key electoral figures. On the one hand, these results suggest
that while inorganic involvement in the online conversation was substantial, not
all of it was necessarily hateful. Low levels of bot interference, in particular, may
present an optimistic sign that artificial distortions of pandemic protections were
minimized. Conversely, bot-driven hate toward political candidates may presentHate Speech and Image Sharing 9
challenges for the health of political discourse on Twitter, as these may signal
negative information maneuvers which artificially drive poor opinions of certain
candidates relative to others [2,5]. Future work may probe which political actors
were most specifically targeted by inorganically amplified online hate.
Alongside these empirical insights, this work also offers methodological con-
tributions to extant approaches for studying online hate speech and digital dis-
information more broadly. Methodologically, we show how interoperable frame-
works of machine learning and network science tools can surface unique insights
into potential information operations relying on visual resources to drive on-
line conflicts and abuse [18]. This pushed the value of bot detection [2] and hate
speech detection tools [17] to shift from mere prediction to a more comprehensive
engagement with their deployment in concrete settings [5]. A community-level
unit of analysis further illustrated the utility of a social network approach, as
even if hate was low among actors which shared images directly, we were able
to observe the nature of the interactions surrounding these images. These tech-
niques reflect key principles of social cybersecurity, and may readily be adapted
in a variety of analytical contexts in studying the multimodal nature of both
information operations and hate speech in more general terms.
Several limitations nuance our conclusions from this work. Sampling Twitter
data remains limited by API generalizability issues, suggesting caution in ex-
trapolating findings to wider contexts. The selection of hashtags may not have
been comprehensive and some hashtags corresponded to events happening in the
same time zone. Twitter usage may also not be comparable in Singapore com-
pared to other contexts, especially in the West. This caveat moreover applies to
improving all the off-the-shelf tools deployed in this research to account for the
unique contexts of new geopolitical settings [15,16]. Studies of other platforms,
as well as more locally tuned models, may therefore aid more holistic inquiry into
online electoral discourse, and promises fruitful avenues for social cybersecurity
research especially around less well-studied regions like the Asia-Pacific.
References
1. Awan, I., Zempi, I.: The affinity between online and offline anti-muslim hate crime:
Dynamics and impacts. Aggression and Violent Behavior 27, 1–8 (2016)
2. Beskow, D.M., Carley, K.M.: Bot conversations are different: Leveraging network
metrics for bot detection in twitter. In: 2018 IEEE/ACM International Conference
on Advances in Social Networks Analysis and Mining (ASONAM). pp. 825–832.
IEEE (2018)
3. Beskow, D.M., Kumar, S., Carley, K.M.: The evolution of political memes: Detect-
ing and characterizing internet memes with multi-modal deep learning. Information
Processing & Management 57(2), 102170 (2020)
4. Cao, R., Lee, R.K.W., Hoang, T.A.: Deephate: Hate speech detection via
multi-faceted text representations. In: 12th ACM Conference on Web Sci-
ence. p. 11–20. WebSci ’20, Association for Computing Machinery, New York,
NY, USA (2020). https://doi.org/10.1145/3394231.3397890, https://doi.org/
10.1145/3394231.339789010 J. Uyheng et al.
5. Carley, K.M., Cervone, G., Agarwal, N., Liu, H.: Social cyber-security. In: In-
ternational Conference on Social Computing, Behavioral-Cultural Modeling and
Prediction and Behavior Representation in Modeling and Simulation. pp. 389–394.
Springer (2018)
6. Davidson, T., Warmsley, D., Macy, M., Weber, I.: Automated hate speech detection
and the problem of offensive language. In: Eleventh International AAAI Conference
on Web and Social Media (2017)
7. Ferrara, E., Varol, O., Davis, C., Menczer, F., Flammini, A.: The rise of social
bots. Communications of the ACM 59(7), 96–104 (2016)
8. Fortuna, P., Nunes, S.: A survey on automatic detection of hate speech in text.
ACM Computing Surveys (CSUR) 51(4), 1–30 (2018), publisher: ACM New York,
NY, USA
9. Giachanou, A., Rosso, P.: The battle against online harmful information: The cases
of fake news and hate speech. In: Proceedings of the 29th ACM International
Conference on Information & Knowledge Management. pp. 3503–3504 (2020)
10. He, K., Zhang, X., Ren, S., Sun, J.: Deep residual learning for image recognition. In:
Proceedings of the IEEE conference on computer vision and pattern recognition.
pp. 770–778 (2016)
11. Johnson, N.F., Leahy, R., Restrepo, N.J., Velasquez, N., Zheng, M., Man-
rique, P., Devkota, P., Wuchty, S.: Hidden resilience and adaptive dynam-
ics of the global online hate ecology. Nature 573(7773), 261–265 (Sep 2019).
https://doi.org/10.1038/s41586-019-1494-7, number: 7773 Publisher: Nature Pub-
lishing Group
12. Schill, D.: The visual image and the political image: A review of visual communi-
cation research in the field of political communication. Review of communication
12(2), 118–142 (2012)
13. Soral, W., Bilewicz, M., Winiewski, M.: Exposure to hate speech increases prejudice
through desensitization. Aggressive Behavior 44(2), 136–146 (2018)
14. Traag, V.A., Waltman, L., van Eck, N.J.: From Louvain to Leiden: Guaranteeing
well-connected communities. Scientific Reports 9(1), 1–12 (2019)
15. Uyheng, J., Carley, K.M.: Characterizing bot networks on Twitter: An empiri-
cal analysis of contentious issues in the Asia-Pacific. In: International Conference
on Social Computing, Behavioral-Cultural Modeling and Prediction and Behavior
Representation in Modeling and Simulation. pp. 153–162. Springer (2019)
16. Uyheng, J., Carley, K.M.: Bot impacts on public sentiment and community struc-
tures: Comparative analysis of three elections in the Asia-Pacific. In: International
Conference on Social Computing, Behavioral-Cultural Modeling and Prediction
and Behavior Representation in Modeling and Simulation. Springer (2020)
17. Uyheng, J., Carley, K.M.: Bots and online hate during the covid-19 pandemic: case
studies in the united states and the philippines. Journal of Computational Social
Science pp. 1–24 (2020)
18. Uyheng, J., Magelinski, T., Villa-Cox, R., Sowa, C., Carley, K.M.: Interoperable
pipelines for social cyber-security: Assessing Twitter information operations during
NATO Trident Juncture 2018. Computational and Mathematical Organization
Theory pp. 1–19 (2019)
19. Yang, F., Peng, X., Ghosh, G., Shilon, R., Ma, H., Moore, E., Predovic, G.: Ex-
ploring deep multimodal fusion of text and photo for hate speech classification.
In: Proceedings of the Third Workshop on Abusive Language Online. pp. 11–18
(2019)You can also read


