A cross-sectional study of foot-ground clearance in healthy community dwelling Japanese cohorts aged 50, 60 and 70 years
←
→
Page content transcription
If your browser does not render page correctly, please read the page content below
Nagano et al. BMC Geriatrics     (2021) 21:166
https://doi.org/10.1186/s12877-021-02117-w

 RESEARCH ARTICLE                                                                                                                                      Open Access

A cross-sectional study of foot-ground
clearance in healthy community dwelling
Japanese cohorts aged 50, 60 and 70 years
Hanatsu Nagano1* , W. A. Sparrow1,2, Katsuyoshi Mizukami2, Eri Sarashina1 and Rezaul Begg1

  Abstract
  Background: Falls-related injuries are particularly serious for older people, causing pain, reduced community
  engagement and associated medical costs. Tripping is the leading cause of falls and the current study examined
  whether minimum ground clearance (MFC) of the swing foot, indicating high tripping risk, would be differentiated
  across cohorts of healthy 50-, 60- and 70-years old community residents in Japan.
  Methods: A cross-sectional population comprising the three groups (50s, 60s and 70s) of 123 Konosu City residents
  consented to be recorded when walking on an unobstructed surface at preferred speed. Gait biomechanics was
  measured using high speed (100 Hz) motion capture (OptiTrack – Natural Point Inc.), including step length and
  width, double support, foot contact angle and MFC (swing toe height above the ground). Multivariate Analysis of
  Variance (MANOVA) was used to confirm ageing effects on MFC and fundamental gait parameters. Pearson’s
  correlations were performed to identify the relationships between mean MFC and other MFC characteristics (SD
  and SI), step length, step width, double support time and foot contact angle.
  Results: Compared to 50s, lower step length was seen (2.69 cm and 6.15 cm) for 60s and 70s, respectively. No
  other statistical effects were identified for spatio-temporal parameters between the three groups. The 50s cohort
  MFC was also significantly higher than 60s and 70s, while step-to-step MFC variability was greater in the 70s than
  50s and 60s. Pearson’s correlations demonstrated that more symmetrical gait patterns were associated with greater
  MFC height, as reflected in greater symmetry in step width (50s), MFC (60s) and foot contact angle (70s). In the 70s
  increased MFC height correlated with higher MFC variability and reduced foot contact angle.
  Conclusions: MFC height reduces from 60 years but more variable MFC appears later, from 70 years. While
  symmetrical gait was accompanied by increased MFC height, in the 70s group attempts to increase MFC height
  may have caused more MFC variability and lower foot contact angles, compromising foot-ground clearance.
  Assessments of swing foot mechanics may be a useful component of community falls prevention.
  Keywords: Tripping, Gait, Falls, Minimum foot clearance, Ageing, Community health

* Correspondence: hanatsu.nagano@vu.edu.au
1
 Institute for Health and Sport (IHeS), Victoria University, P.O. Box 14428, VIC
8001 Melbourne, Australia
Full list of author information is available at the end of the article

                                           © The Author(s). 2021 Open Access This article is licensed under a Creative Commons Attribution 4.0 International License,
                                           which permits use, sharing, adaptation, distribution and reproduction in any medium or format, as long as you give
                                           appropriate credit to the original author(s) and the source, provide a link to the Creative Commons licence, and indicate if
                                           changes were made. The images or other third party material in this article are included in the article's Creative Commons
                                           licence, unless indicated otherwise in a credit line to the material. If material is not included in the article's Creative Commons
                                           licence and your intended use is not permitted by statutory regulation or exceeds the permitted use, you will need to obtain
                                           permission directly from the copyright holder. To view a copy of this licence, visit http://creativecommons.org/licenses/by/4.0/.
                                           The Creative Commons Public Domain Dedication waiver (http://creativecommons.org/publicdomain/zero/1.0/) applies to the
                                           data made available in this article, unless otherwise stated in a credit line to the data.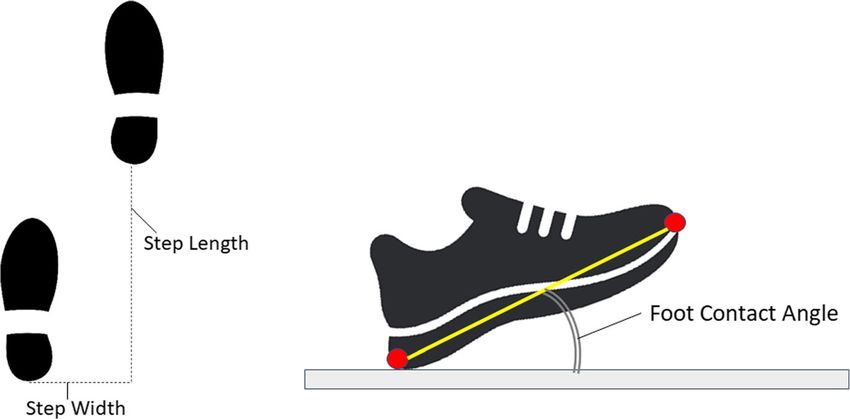
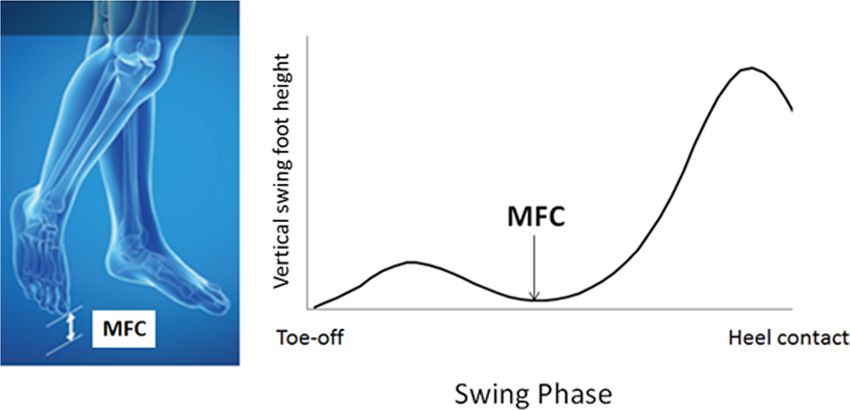
Nagano et al. BMC Geriatrics   (2021) 21:166                                                                                    Page 2 of 7

Introduction                                                           group of physically active older people, for example,
In demographically ageing societies it is increasingly                 people over 60 years [6]. For experimental purposes
important to promote healthy ageing to reduce health-                  they were, however, undifferentiated with respect to
care costs and ensure financially sustainable social secur-            age. The aim of this study was to compare MFC
ity systems. About one in three senior adults fall at least            characteristics across three age groups, comprising in-
once a year and up to 20 % of cases lead to serious injury             dividuals in their 50s, 60s and 70s. Traditionally,
or fatality [1]. Previous studies have identified tripping             older populations have been defined as above 60 or
as the leading cause of falls [2, 3] due to the swing foot             65yrs but further investigation of these sub-groups is
striking the walking surface, or an object on it, with suf-            important in identifying the age-related transition in
ficient force to cause balance loss. Research into ageing              MFC control from the “pre-old” 50s age group into
effects on walking has, therefore, focussed on identifying             the 60s and 70s age brackets.
foot-ground clearance characteristics that increase trip-                Prolonged life expectancy and lower birth rate in Japan
ping risk in older people.                                             are presenting critical social, economic and public health
   Minimum Foot Clearance (MFC) at mid-swing is                        problems, including mobility and falls. The current
critical to determining tripping risk associated with                  study’s focus was older residents of Konosu City, with a
undetected obstacles (Fig. 1) [4–15] due to the increased              population of 120,000 located in Saitama Prefecture
probability of surface contact. At this point, the foot’s              Japan, a predominantly rural region of which more than
forward velocity also approaches maximum, creating a                   98 % are Japanese born. More than 30 % are over 65
considerable foot-obstacle contact force. Interestingly, in            years, higher than the national average (29 %). While
most previous reports, reduced MFC height has not been                 basic gait assessments, such as the 6 minute-walk test
reported to be associated with ageing but greater MFC                  [17], are widely used in Japan, there are no reports of
variability, influencing the MFC distribution, does                    ageing effects on gait utilising 3D motion capture. The
appear to explain the greater tripping risk as we get                  current research is unique in recruiting a large sample
older [4]. Analytical approaches to estimating tripping                (n = 123) of community dwelling citizens outside the la-
risk have, therefore, modelled the (non-normal) distribu-              boratory to obtain precise measures of their walking
tion patterns of MFC height and variability [5].                       abilities.
Biomechanically, reduced tripping risk at MFC can be                     Our study was guided by two research questions. First,
achieved with consistent swing foot clearance across                   what are the effects of chronological age on foot-ground
multiple gait cycles (indicated by low variability) com-               clearance, i.e. MFC central tendency, variability (SD) and
bined with low MFC asymmetry [4, 5, 7, 10].                            left-right asymmetry. Symmetrical control of MFC is
   Most previous studies of MFC compared samples of                    affected by ageing [7] and based on previous reports
10 to 30 young adults (18–35 years) with a single                      (e.g., [4, 7, 8]) it was hypothesised that MFC height

 Fig. 1 Minimum Foot Clearance (MFC): minimum vertical displacement of the toe at mid-swing. Image taken from Nagano and Begg [16]
Nagano et al. BMC Geriatrics     (2021) 21:166                                                                                        Page 3 of 7

would be lower, more variable and also increasingly                       Apparatus and procedure
asymmetrical across the three age groups. The second                      Using a protocol similar to a pervious study [19] testing
question was how ageing effects on stride phase vari-                     was conducted on a 10m walkway in the City Sports
ables influence MFC height. This was addressed by cor-                    Gymnasium at preferred speed, with walkthrough trials
relating spatio-temporal gait cycle variables with MFC                    repeated until a minimum of 30 complete step cycles
height across age groups. Alcock et al. [18] found that                   had been collected. To model foot motion reflective
slower walking was associated with reduced MFC, pos-                      markers were attached to the toe (the superior most dis-
sibly due to shorter, wider steps and prolonged double                    tal surface of the foot) and the heel (the most proximal
support, all of which are seen with advanced age [19].                    point) [19]. The reflective marker 3D position-time co-
Flatter foot-ground contact due to reduced dorsiflexor                    ordinates were sampled at 100 Hz using a three-
strength was hypothesised across age groups; a variable                   dimensional (3D) camera system (Optitrack, Natural
that has also been proposed to correlate with lower foot-                 Point) and then smoothed at 6 Hz using a low-pass But-
ground clearance [9, 20].                                                 terworth digital filter [9]. Toe-off and heel contact were
                                                                          identified by applying conventional gait event detection
                                                                          algorithms to the heel and toe velocity and acceleration
Methods                                                                   functions [7]. MFC was computed as the toe vertical
Participants                                                              local minimum within a time-sample window mid-
Participants were 24 male and 99 female residents of                      swing, using an in-house algorithm implemented in
Konosu City (Japan) aged over 50 years, comprising                        Visual3D (C-Motion, Inc.) script language [5]. Gait vari-
three age groups: 50-59yrs (n = 16, age = 56.09 ±                         ables were computed from the 3D position-time coordi-
3.44yrs, height 160.2 ± 11.2 cm, body mass 58.5 ±                         nates of the toe and heel markers with step length and
18.5kg), 60–69 yrs (n = 68, age = 65.76 ± 2.67 yrs.,                      width defined, respectively, as anterior-posterior and
height = 156.9 ± 6.01 cm, body mass = 54.45 ± 8.60kg)                     medio-lateral displacements between the heels at heel
and 70-79yrs (n = 39, age = 74.12 ± 2.57yrs, height                       contact (Fig. 2). Double support time was the period for
156.3 ± 7.2 cm, body mass 54.6 ± 10.6kg). Sample sizes                    which both feet were in contact with the walking sur-
were larger than most previous studies of ageing ef-                      face, i.e. from one heel contact to the contralateral toe-
fects on MFC [6]. All were classified as healthy, living                  off. Foot contact angle was defined relative to toe and
independently, with no reported locomotor or cogni-                       heel positions at heel contact and the walking surface.
tive impairments. Participant recruitment was initiated
by Konosu City Council via advertisements at civic                          As illustrated in Fig. 1, Minimum Foot Clearance
buildings and a mail-out to residents. Prior to partici-                  (MFC) was the vertical displacement of the toe from the
pation City Council staff held an information session                     walking surface during mid-swing [4]. All gait data were
and all participants gave written informed consent                        described using the Mean (central tendency), Standard
procedures mandated and approved by the institu-                          Deviation (SD) (intra-subject variability) and a Symmetry
tional research ethics committee of the University of                     Index (SI) reflecting left-right differences in the gait
Tsukuba (Tai/30–53).                                                      variables [7, 21]; computed as follows:

 Fig. 2 Step Length and Step Width (left) and Foot Contact Angle, the angle formed between the toe-heel axis and the walking surface(right).
 Red dots represent the toe and heel markers
Nagano et al. BMC Geriatrics (2021) 21:166 Page 4 of 7
Fig. 3 Gait parameter Mean, SD and SI for three age groups. Standard deviation bars indicate intrasubject SD, dots indicate SI shown on the
right axis
121 = 278.8, p < .01) with no differences in height and
SI ¼ jðR − LÞðR þ LÞ 0:5j 100ð%Þ body mass.
where R/L indicates right/left foot leading (Fig. 2). The
Age effects on Gait Parameters
SI was computed for both the mean and SD of each gait
As expected, age effects were observed for Mean Step
variable.
Length (F 2, 121 = 3.309, p < .05) due to the 50s group
having steps 2.69 cm and 6.15 cm longer than 60s and
Design and analysis
70s individuals respectively (Fig. 3).
In an independent measures design, a One-way Analysis
of Variance (ANOVA) was used to determine between-
group differences in age, height and body mass. Multi- Age effects on MFC
variate ANOVA (MANOVA) was used to confirm MFC characteristics (Mean, SD, SI) of the three age
ageing effects on MFC and fundamental gait parameters. groups (i.e. 50s, 60s, 70s) are displayed in Fig. 4. Ageing
Significant overall ANOVA effects were followed up effects were observed on Mean MFC (F 2, 121 = 3.838,
using Tukey’s procedure to determine differences p < .05) and SD MFC (F 2, 121 = 4.023, p < .05). Tukey’s
between the three age groups. Pearson’s correlations test revealed differences in Mean MFC between 50s and
were performed to identify the relationships between 60s (p < .05) and 50s-70s groups (p < .05) due to an
mean MFC and other MFC characteristics (SD and SI), approximately 0.5 cm lower MFC in the 60s and 70s
step length, step width, double support time and foot participants, as shown in Fig. 4. No Mean MFC differ-
contact angle. For all test statistics, i.e., F-ratios, Tukey’s ence was found between the 60s-70s groups. In contrast,
test, and Pearson’s r, significant effects were accepted SD MFC of the 70s age group was 0.149 cm greater than
when p-values were less than 0.05. for the 50s (p < .05) and 0.106 cm greater than the 60s
cohort (p < .05) but the 50s-60s comparison did not
Results reveal a difference in MFC variability. SI MFC was
One-way ANOVA results confirmed that the three lowest in the 50s age range but no statistically reliable
groups were distinguished only by increased age (F2, age effects on SI MFC were confirmed.Nagano et al. BMC Geriatrics (2021) 21:166 Page 5 of 7
Fig. 4 Minimum Foot Clearance (MFC) Mean, SD and SI for three age groups, with standard deviation bars and SI as Fig. 3
The correlations in Table 1 indicated that across all Symmetrical Double Support Time coincided with sym-
age groups more symmetrical gait was associated with metrical MFC for 50s (r = .601, p < .01) and 60s (r = .495,
greater foot-ground clearance, i.e., higher Mean MFC. p < .01) but not for 70s (p = .105). Symmetrical control
For the 50s group step width symmetry was associated of Step Width was further correlated with SI MFC only
with higher Mean MFC, in the 60s group MFC sym- for the 60s group (r = .345, p < .01).
metry was highly correlated with Mean MFC and in the
70s cohort more symmetrical foot contact angles were Discussion
significantly associated with higher MFC. Contrary to The sampled population was identified as healthy, they
expectation, in the 70s participants higher SD MFC and were motivated to volunteer for a research project and
greater (more dorsiflexed) Foot Contact Angles were their fundamental gait parameters were comparable to
found with decreased Mean MFC. previous studies with similar age-group samples. Doyo
In achieving less MFC variability i.e., lower SD MFC, et al. [22], for example, also observed a reduction in step
lower SD Step Length for 50s (r = .583, p < .05); length with age, based on a sample of 2006 community
increased Mean Step Length (r = − .240, p < .05), reduced dwelling citizens in Japan. They also reported similar
SD Step Length (r = .250, p < .05) and increased Foot age-related changes in spatio-temporal parameters in the
Contact Angle (r = − .352, p < .01) were associated 70s age range, such as reduced step length.
among the 60s; while for the 70s, prolonged Double Contrary to previous findings [4, 6, 7] age effects on
Support Time (r = − .498, p < .01) and symmetrical Foot MFC height were found because mean MFC height was
Contact Angle (-0.317, p < .05) were identified. significantly lower in the 60s and 70s than the 50s
For symmetrical MFC control, symmetrical Step group. Our MFC findings here suggest that MFC height
Length showed interlinks for 60s participants (r = .370, may begin to fall from the 60s, while significantly more
p < .01) and 70s (r = .395, p < .05) but not 50s (p = .105). variable MFC may appear later, in the 70s age group.
Table 1 R values for Pearson’s correlations between gait variables and mean-MFC height (*P < .05, **p < .01). SD standard deviation,
SI Symmetry Index
Age Group 50s 60s 70s
Mean SD SI Mean SD SI Mean SD SI
MFC 0.323 − 0.007 − 0.032 − 0.320** .595** − 0.072
Step Length 0.340 − 0.026 − 0.132 0.212 − 0.073 0.095 − 0.169 0.248 0.018
Step Width − 0.022 − 0.162 − 0.599* − 0.105 0.055 0.033 0.065 0.174 − 0.245
Double Support Time − 0.312 − 0.181 − 0.371 − 0.185 − 0.113 − 0.199 − 0.257 0.021 0.255
Foot Contact Angle − 0.108 − 0.131 − 0.018 − 0.062 − 0.205 0.201 − 0.477** − 0.143 − 0.382*Nagano et al. BMC Geriatrics (2021) 21:166 Page 6 of 7
Loss of ability to maintain consistent MFC height over maintaining foot elevation and reducing tripping risk
multiple gait cycles has been identified as the primary and in addition to maintaining ankle dorsiflexion, par-
ageing effect on foot trajectory control leading to in- ticular at mid-swing close to MFC [25], exercises for
creased tripping risk [4]. In addition to ageing effects on older people should emphasise symmetrical walking.
mean and SD of MFC, the previous study reported that Treadmill-based gait training with real-time biofeedback,
symmetrical control of MFC can be impaired with age for example, can increase MFC height while reducing
[7]. Pearson’s correlations indicated that across all three variability [12, 26] and gait-feedback provided by “smart
age groups more symmetrical gait, reflected in a lower footwear” systems may also reduce tripping risk by alert-
SI, was generally associated with elevated MFC height. ing the wearer to asymmetrical gait control [27, 28].
Obtained MFC data (central tendency and its variabil- Precise gait measures obtained using motion capture
ity) were comparable to the previous reports [4–13] but will more reliably identify age-associated changes to mo-
ageing effects were identified unlike these past studies. bility than more commonly used assessments, such as
Most previous research compared young (e.g. 18–35 the 6minute-walk test [17]. Large-sample community-
yrs.) with a single older group (e.g. > 60 yrs.) [6, 10] but based gait screening could also be practically undertaken
our analysis from a considerably larger sample, incorpor- using a force-sensitive commercial gait assessment sys-
ating three sub-groups, revealed that MFC height may tem (e.g. GaitRite mat) that does not require specialised
reduce prior to the 60 years age range. In addition to skills. For a comprehensive understanding of ground
mean and SD descriptions, previous work [7, 19, 20, 23] clearance including obstacle negotiation tests, however,
suggested that reduced leg strength with ageing leads to 3D analysis is required. Our study used motion capture
higher asymmetry, causing loss of symmetrical gait con- apparatus, but larger samples could be tested more effi-
trol and increased tripping risk. This is consistent with ciently using markerless motion capture suits or
the current correlations results implying that higher footwear-mounted wearable sensors. As far as we know,
MFC is associated with symmetrical gait in general. In there have been no previous attempts to use 3D motion
terms of correlations between step length and MFC capture to examine mobility within an everyday
height, however, in contrast to Alcock et al. [18], we did community.
not find significant correlations but they examined both Limitations to the current study should be noted.
preferred speed and fast walking, revealing increased Compared to studies cited in a comprehensive review of
MFC due to higher velocity, while the current experi- the MFC literature [6], the current research incorporated
ment was conducted only at preferred speed. It may, large samples. Further investigation of the same age-
however, be reasonable to suggest that decreased step defined cohorts is, however, necessary to confirm the
length associated with ageing-related declines in walking present findings of previously unreported ageing effects
speed [11, 24] is causally related to reduced MFC height on MFC height. It is also important to acknowledge that
with ageing. falls risk may be greater in older people who are unwill-
While lower MFC height was identified from the 60s, ing to volunteer for a community-based research pro-
correlation analysis revealed that ankle control may de- gram. In addition, male participants were
cline later, from the 70s. This age group showed a posi- underrepresented, possibly due to their lower overall
tive correlation between mean MFC and SD of MFC, participation in social activities [28, 29]. Further research
such that the positive effects of elevated MFC were could be undertaken in communities with different
counteracted by increased MFC variability [13]. With population characteristics to show whether our findings
ageing, the loss of finely coordinated ankle movement are region-specific. In future work, falls history should
may require a greater contribution from the knee and also be recorded to investigate whether MFC control is
hip, but these joints are less adapted to precise swing affected by a history of falls. This study was conducted
foot control [14, 25]. Increased Foot Contact Angle was as part of Konosu City’s health promotion initiative and
also linked to reduced MFC height only in the 70s advances in remote gait monitoring, i.e. gait measure-
group, also demonstrating impaired ankle action. Heel ment outside the laboratory, will encourage future falls
contact was associated with dorsiflexion but correlation prevention and physical activity initiatives. This early-
results suggested that attempts to achieve increased foot stage gait assessment scheme should, therefore, be
contact angle may have caused reduced MFC in the 70s viewed as a community model with the potential to be
participants. adopted by other cities to maintain the mobility and
Reduced MFC height was seen from age 60 years while safety of their valuable and deserving senior citizens.
MFC variability increased from 70 years. While each
decade showed different strategies to control MFC, in
Abbreviations
general, less variable and more symmetrical gait opti- MFC: Minimum Foot Clearance; SD: Standard deviation;
mises MFC control. Exercise interventions may help in MANOVA: Multivariate analysis of varianceNagano et al. BMC Geriatrics (2021) 21:166 Page 7 of 7
Acknowledgements 10. Mills PM, Barrett RS, Morrison S. Toe clearance variability during walking in
The authors extend their most sincere thanks to Konosu City Council for young and elderly men. Gait Posture. 2008;28(1):101–7.
making this study possible by providing their approval and generous 11. De Asha AR, Buckley JG. The effects of walking speed on minimum toe
support. Our appreciation is also extended to Saitama Prefecture Council for clearance and on the temporal relationship between minimum clearance
their award of ‘Healthy Longevity City Award’ in 2019, as part of their and peak swing-foot velocity in unilateral trans-tibial amputees. Prosthet
broader community-based health promotion initiative. Orthot Int. 2015;39(2):120–5.
12. Begg RK, Tirosh O, Said CM, Sparrow WA, Steinberg N, Levinger P, Galea MP.
Authors' contributions Gait training with real-time augmented toe-ground clearance information
KM and ES designed the concept of the study; HN analysed the data; HN decreases tripping risk in older adults and a person with chronic stroke.
and WS prepared the manuscript; RB provided the overall research direction Frontiers in Human Neuroscience. 2014;8(243):1–6.
of the current study. The author(s) read and approved the final manuscript. 13. Ullauri JB, Akiyama Y, Okamoto S, Yamada Y. Techniques to reduce the
minimum toe clearance of young adults during walking to simulate the risk
Funding of tripping of the elderly. Plos One. 2019; 14 (6).
The research received no funding. 14. Watanabe K. Relationship between toe clearance strategy and regional
regulation of rectus femoris muscle during swing phase in prolonged
Availability of data and materials walking in young and older adults. Front Physiol. 2018;9:(1274).
The datasets generated and analyses performed during the current study are 15. Killeen T, Easthope CS, Demkó L, Filli L, Lőrincz L, Linnebank M, Curt A,
not publicly available due to the consent requirement of participants, but Zörner B, Bolliger M. Minimum toe clearance: probing the neural control of
anonymous descriptive data are available from the corresponding author on locomotion. Sci Rep. 2017; 7 (1922).
reasonable request. 16. Nagano H, Begg R. Shoe-insole technology for injury prevention in walking.
Sensors. 2018;8(5):18.
Declarations 17. Bautmans I, Margareta L, Mets T. The six-minute walk test in community
dwelling elderly: influence of health status. BMC Geriatrics. 2004;4:6.
Ethics approval and consent to participate 18. Alcock L, Galna B, Perkins R, Lord S, Rochester L. Step length determines
Prior to participation City Council staff held an information session and all minimum toe clearance in older adults and people with Parkinson’s disease.
participants gave written informed consent procedures mandated and J Biomech. 2018;11(71):30–6.
approved by the institutional research ethics committee of the University of 19. Nagano H, Begg RK, Sparrow WA, Taylor S. A comparison of treadmill and
Tsukuba (Tai/30–53). overground walking effects on step cycle asymmetry in young and older
individuals. J Appl Biomechan. 2013;29(2):188–93.
20. Perry MC, Carville SF, Smith ICH, Rugherford OM, Newham Dij. Strength,
Consent for publication
power output and symmetry of leg muscles: effect of age and history of
Not applicable.
falling. Eur J Appl Physiol. 2007;100:553–61.
21. Sadeghi H, Allard P, Prince F, Labelle H. Symmetry and limb dominance in
Competing interests
able-bodied gait: a review. Gait Posture. 2000;12(1):34–45.
The authors declare that they have no competing interests.
22. Doyo W, Kozakai R, Kim H, Ando F, Shimokata H. Spatiotemporal
components of the 3-D gait analysis of community-dwelling middle-aged
Author details
1 and elderly Japanese: Age- and sex- related differences. Geriatrics Gerontol
Institute for Health and Sport (IHeS), Victoria University, P.O. Box 14428, VIC
Int. 2011;11:39–49.
8001 Melbourne, Australia. 2Graduate School of Comprehensive Human
23. LaRoche DP, Cook SB, Mackala K. Strength asymmetry increases gait
Sciences, Faculty of Health and Sport Sciences, University of Tsukuba, Ibaraki
asymmetry and variability in older women. Med Sci Sports Exerc. 2013;
305-8574 Tsukuba, Japan.
44(11):2172–81.
24. Wang W, Lien W, Liu C, Yang C. Study on tripping risks in fast walking
Received: 6 August 2020 Accepted: 24 February 2021
through cadence-controlled gait analysis. J Healthc Engineering. 2018.
11pages.
25. Moosabhoy MA, Gard SA. Methodology for determining the sensitivity of
References swing leg toe clearance and leg length to swing leg joint angles during
1. Stevens JA, Corso PS, Finkelstein EA, Miller TR. The costs of fatal and gait. Gait Posture. 2006;24:493–501.
nonfatal falls among older adults. Inj Prev. 2006;12:290–5. 26. Nagano H, Said CM, James L, Begg RK. Feasibility of using foot-ground
2. Berg WR, Alessio HM, Mills EM, Tong C. Circumstances and consequences of clearance biofeedback training in treadmill walking for post-stroke gait
falls in independent community dwelling older adults. Age Ageing. 1997;26: rehabilitation. Brain Sci. 2020;10(12):978.
261–8. 27. Eskofier BM, Lee SI, Baron M, Simon A, Martindale CF, Gabner H, Klucken J.
3. Blake AJ, Morgan K, Bendall MJ, Dallosso H, Ebrahim SBJ, Arie THD, Fentem An overview of smart shoes in the internet of health things: Gait and
PH, Bassey EJ. Falls by elderly people at home prevalence and associated mobility assessment in health promotion and disease monitoring. Appl Sci.
factors. Age Ageing. 1988;17:365–72. 2017;7:986.
4. Begg R, Best R, Dell’Oro L, Taylor S. Minimum foot clearance during walking: 28. Naud D, Genereux M, Bruneau J, Alauzet A, Levasseur M. Social participation
Strategies for the minimisation of trip-related falls. Gait Posture. 2007;25(2): in older women and men: differences in community activities and barriers
191–8. according to region and population size in Canada. BMC Public Health.
5. Best R, Begg R. A method for calculating the probability of tripping while 2019;19:1124.
walking. J Biomech. 2008;41(5):1147–51. 29. Van Uffelen JGZ, Khan A, Burton NW. Gender differences in physical activity
6. Barrett RS, Mills PM, Begg RK. A systematic review of the effect of ageing motivators and context preferences: a population-based study in people in
and falls history on minimum foot clearance characteristics during level their sixties. BMC Public Health. 2017;17:624.
walking. Gait Posture. 2010;32:429–35.
7. Nagano H, Begg RK, Sparrow WA, Taylor S. Ageing and limb dominance
effects on foot-ground clearance during treadmill and overground walking. Publisher’s Note
Clin Biomech. 2011;26(9):962–8. Springer Nature remains neutral with regard to jurisdictional claims in
8. Santhiranayagam BK, Lai DTH, Sparrow WA, Begg RK. Minimum toe published maps and institutional affiliations.
clearance events in divided attention treadmill walking in older and young
adults: a cross-sectional study. Journal of NeuroEngineering Rehabilitation.
2015;12:58.
9. Nagano H, James L, Sparrow WA, Begg RK. Effects of walking-induced
fatigue on gait function and tripping risks in older adults. Journa of
Neuroengineering Rehabilitation. 2014;11:(155).You can also read