Age and growth of the smooth hammerhead shark, Sphyrna zygaena, in the Eastern Equatorial Atlantic Ocean, using vertebral sections
←
→
Page content transcription
If your browser does not render page correctly, please read the page content below
Aquat. Living Resour. 24, 351–357 (2011)                                                                                     Aquatic

c EDP Sciences, IFREMER, IRD 2011
DOI: 10.1051/alr/2011145                                                                                                     Living
www.alr-journal.org                                                                                                          Resources

Age and growth of the smooth hammerhead shark, Sphyrna
zygaena, in the Eastern Equatorial Atlantic Ocean, using vertebral
sections
Rui Coelho1,2,a , Joana Fernandez-Carvalho1 , Sérgio Amorim1 and Miguel N. Santos1
1
    Instituto Nacional dos Recursos Biológicos IP/ IPIMAR, 8700-305 Olhão, Portugal
2
    Centro de Ciências do Mar, Universidade do Algarve, Portugal

              Received 31 January 2011; Accepted 19 July 2011

              Abstract – The smooth hammerhead shark Sphyrna zygaena (Sphyrnidae) is regularly caught as bycatch in pelagic
              longline fisheries, but is one of the least studied of all pelagic sharks. Recently, ICCAT (International Commission for
              the Conservation of Atlantic Tunas) issued recommendations underlining the need for more studies on the life history
              parameters of this and other pelagic shark species. To this end, the age and growth of S. zygaena were studied in the
              Eastern Equatorial Atlantic Ocean, in an area where growth parameters were not yet available for this species. Data
              from 139 specimens, caught between June and September 2009, ranging in size from 136 to 233 cm fork length (FL),
              were analysed. Preliminary trials were carried out to assess the most efficient growth band enhancement technique.
              These indicated that sectioning the vertebrae into 500 μm sections followed by staining with crystal violet produced
              the best results. Growth models were fitted using the traditional von Bertalanffy growth equation and a modification of
              this equation using a known size at birth. Growth models were compared using the Akaike information criterion (AIC).
              The von Bertalanffy growth equation seemed to be the most adequate model to describe growth in this species, with
              resulting growth parameters of Lin f = 272 cm FL, k = 0.06 year for males and Lin f = 285 cm FL, k = 0.07 year for
              females. In the first four years of life, S. zygaena grows 25 cm per year on average, but its growth slows down in later
              life. Future stock assessment models should incorporate these age and growth parameters for species management and
              conservation.

              Key words: Age and growth / pelagic longline fisheries / life history / Carcharhiniformes / vertebral band counts /
              Atlantic Ocean

1 Introduction                                                              (Compagno 1984). As with other pelagic shark species,
                                                                            S. zygaena is commonly caught as bycatch by pelagic long-
    Elasmobranch fishes have gained increased importance as                 lines targeting swordfish in the Eastern Equatorial Atlantic,
fishery resources in recent years (Barker and Schluessel 2005).             even though it is caught in much lower numbers than the
These fishes are exploited by directly targeted fisheries and               considerably more common blue shark (Prionace glauca) and
caught as bycatch in fisheries targeting other species (Stevens             mako shark (Isurus oxyrinchus) (Buencuerpo et al. 1998).
et al. 2000). Oceanic sharks pose a particularly difficult prob-
                                                                                Despite being regularly caught as bycatch by these com-
lem when it comes to fisheries management and conservation
                                                                            mercial fisheries, information on life history, movement pat-
due to their highly migratory nature that leads them to mi-
                                                                            terns, essential habitats, and population dynamics of this
grate between territorial waters of different countries and inter-
                                                                            species is still scarce over most of its range. While other
national waters. Moreover, elasmobranchs generally have K-
                                                                            species of large pelagic hammerheads, such as the scalloped
strategy life cycles characterized by slow growth rates and low
                                                                            hammerhead (Sphyrna lewini), have been the focus of sev-
reproductive potential (Cortés 2000). These life history traits
                                                                            eral population dynamics studies (e.g., Branstetter 1987; Chen
make them extremely vulnerable to fishing pressure, with over-
                                                                            et al. 1990; Anislado-Tolentino and Mendoza 2001; Piercy
exploitation occurring even at relatively low levels of fishing
                                                                            et al. 2007; Anislado-Tolentino et al. 2008; Harry et al. 2011),
mortality (Smith et al. 1998).
                                                                            almost no information is currently available on the life history
    The smooth hammerhead shark, Sphyrna zygaena
                                                                            parameters of S. zygaena.
(Linnaeus 1758), is a cosmopolitan pelagic hammerhead
shark occurring from close inshore to offshore oceanic waters                    Cortés et al. (2010) conducted an ecological risk assess-
                                                                            ment for eleven species of pelagic elasmobranchs in the At-
    a
        Corresponding author: rpcoelho@ualg.pt                              lantic Ocean and concluded that S. zygaena appeared to be

                                                      Article published by EDP Sciences
352                                     R. Coelho et al.: Aquat. Living Resour. 24, 351–357 (2011)

Fig. 1. Map of the Eastern Equatorial Atlantic with the location of the Sphyrna zygaena samples. Dark circles represent males and light grey
circles represent females.

among the less vulnerable, probably due to its relatively high          from the Eastern Equatorial Atlantic (latitudes 7 ◦ N to 1 ◦ S;
fecundity compared with other oceanic sharks (29 to 37 young            longitudes 8 ◦ E to 23 ◦ W) between June and September 2009
per litter, according to (Compagno 1984)). However, Cortés              (Fig. 1).
(2010) also mentioned that S. zygaena was one of the species                Once brought aboard, the sharks were identified, sexed and
for which there is the most urgent need of better biological            measured for fork length (FL) to the nearest cm. A sample
data, due to many uncertainties regarding its life history. Fur-        of 4 to 8 vertebrae from the anterior region of the carcass
thermore, it is probable that significant and under-reported            (directly behind the head) was removed and stored frozen.
fishing mortality of this and other hammerhead species is tak-          These samples were then transported to the laboratory where
ing place in large-scale longline fisheries, as the fins of ham-        they were further cleaned and processed. Once in the labora-
merhead sharks are highly prized on Asian markets (Clarke               tory, the vertebrae were cleaned: first by manually removing
et al. 2006).                                                           most of the organic tissue with scalpels and then by immer-
    In the Atlantic Ocean, the International Commission for             sion in bleach (sodium hypochlorite solution). General pur-
the Conservation of Atlantic Tunas (ICCAT) is the inter-                pose commercial bleach was used, typically containing 4% to
governmental fishery organization responsible for the man-              6% sodium hypochlorite. After cleaning, the vertebrae were
agement and conservation of migratory tunas and tuna-like               dried, mounted on a microscope slide with thermoplastic ce-
species, including pelagic sharks such as S. zygaena. Re-               ment, and sectioned along the longitudinal plane as described
cent concerns about the lack of knowledge on life history               by Goldman (2004). For sectioning the vertebrae, a Buehler
parameters of these sharks has led ICCAT to issue several               Isomet slow speed cutting machine was used; cutting sections
resolutions and recommendations stating the need for more               of approximately 500 μm thickness. Different vertebral section
studies focused on these aspects (e.g., ICCAT 2003, 2004;               thicknesses, specifically 300 μm, 500 μm, and 700 μm, had al-
2007).                                                                  ready been tested in a preliminary trial. As the 500 μm thick-
    Therefore, the main objective of the present study was to           ness produced the best results, it was chosen for the present
present information on the age and growth of S. zygaena in              study.
the Eastern Equatorial Atlantic Ocean. Because there is still
great uncertainty about which techniques are most suitable for          2.2 Comparison of ageing techniques
estimating age in this species, a secondary objective was to as-
sess and compare several different growth band enhancement                   Because no previous literature is available for estimat-
techniques.                                                             ing the age and growth of this species, preliminary trials for
                                                                        growth band visualization were carried out on vertebrae from
                                                                        30 randomly selected individuals, using several common tech-
2 Materials and methods                                                 niques for ageing elasmobranch fishes: whole vertebrae X-
                                                                        rays (Cailliet et al. 1983) and examination of vertebral sec-
2.1 Biological sampling                                                 tions, either unstained or coloured with crystal violet (Johnson
                                                                        1979) or alizarin red (LaMarca 1966). To compare the differ-
    Samples for this study were collected by INRB, I.P./ IP-            ent growth band enhancement techniques, both the coefficient
IMAR (Portuguese Institute of Marine Research) fishery ob-              of variation (CV) (Chang 1982) and the average percent er-
servers aboard Portuguese longliners targeting swordfish in the         ror (APE) (Beamish and Fournier 1981) were calculated and
Atlantic Ocean. Samples for this specific study were collected          compared between techniques.
R. Coelho et al.: Aquat. Living Resour. 24, 351–357 (2011) 353
The visualization of the vertebral sections was carried 14
out under a dissecting microscope using transmitted white 12
Female
light. Opaque and translucent bands were identified follow- Male
10
Frequency (n)
ing the description and terminology described by Cailliet and
Goldman (2004). For each vertebra of each specimen, three 8
independent readings and age estimations were carried out by 6
two readers. Age estimation was only assigned to a specimen 4
if the recordings made by the two readers were consistent and
gave the same age estimation. 2
0
2.3 Age estimation and growth modelling
Size (FL, cm)
The relationship between the size of the specimens and the Fig. 2. Size (fork length) frequency distribution of male (n = 74) and
size of their vertebrae was determined. The vertebral sections female (n = 65) Sphyrna zygaena caught in the eastern equatorial
were micro-photographed using a dissecting microscope and Atlantic Ocean, between June and September 2009. Sizes are grouped
the vertebral radius of the vertebrae was digitally measured in 5 cm fork length classes.
using Image J software (Abramoff et al. 2004). The Pearson
product-moment correlation coefficient between the vertebral
radius and FL was estimated. A linear regression was fitted (Katsanevakis 2006). The differences between the best model
using FL as the dependent variable and the vertebral radius as and alternative candidate models (Δi ) were calculated, and pro-
the independent variable. The coefficient of determination (R2 ) vided a measure of the adequacy of the alternative models. A
of this linear regression was determined, and the significance likelihood ratio test, as defined by Kimura (1980) and recom-
of the regression tested by ANOVA (H0 : slope parameter of mended by Cerrato (1990), was used to test the null hypothe-
the regression (β1 ) = 0). sis that there were no differences in the growth parameters of
To model the growth of S. zygaena, both the traditional males and females.
von Bertalanffy growth model (VBGF) and a modified VBGF
with fixed size at birth (VBGF with fixed L0 ) were fitted and
compared. 3 Results
von Bertalanffy growth model (VBGF):
3.1 Sample characteristics
Lt = Lin f (1 − e−k(t−t0 ) )
Modified VBGF with fixed size at birth (fixed L0 ): A total of 139 samples (74 males and 65 females) were
collected and analysed for this study. Females ranged in size
Lt = Lin f (1 − be−kt ) between 140 and 233 cm FL (mean ± standard deviation:
187.3 ± 17.9 cm), while males ranged in size between 136 and
where b = (Lin f − L0 )/Lin f 230 cm FL (180.8 ± 15.7 cm). Most of the specimens caught
Lt : mean size (FL, cm) at age t(year); Lin f : asymptotic (73% of the sample) were between 160 cm and 190 cm FL
maximum size (FL); (Fig. 2).
L0 : size (FL, cm) at birth; k: growth coefficient (year−1); t0 :
theoretical age (year) at zero size.
The fixed sizes at birth (L0 ) used in the second equation 3.2 Comparison of ageing techniques
were the minimum and the maximum values of size at birth
described for the species by Compagno (1984): 50 and 61 cm The technique of sectioning the vertebrae followed by
total length (TL), respectively. Because size data in our study staining with crystal violet was the most consistent for esti-
refers to FL (136 to 233 cm), we used the following equation mating the age of S. zygaena. Both the CV and the APE in-
to convert the size at birth from TL into FL: dexes were lower with the crystal violet stain than with alizarin
FL = 12.72 + 0.84 TL red, and much lower than results obtained by attempting to
(n = 257; R2 = 0.95; SE intercept (β0 ) = 2.92; SE slope count growth bands on unstained vertebral sections (Table 1).
(β1 ) = 0.01; Regression ANOVA: F = 5214; p < 0.01) (INRB X-raying whole vertebrae did not provide satisfactory results
I.P./ IPIMAR, unpublished data). and this technique was not tested further. In terms of the in-
All growth models were fitted using the R package (R De- fluence of different techniques on age estimation, there was a
velopment Core Team, 2010), with parameters estimated us- tendency for crystal violet to give the highest age estimates,
ing nonlinear least-squares (NLS). For each growth model, the followed by alizarin red and finally the unstained sections.
parameters, their corresponding standard error (SE) and the Additionally, using the crystal violet resulted in more ver-
lower and upper limits of the 95% confidence intervals were tebrae having a final assigned age. Of the 30 vertebrae that
estimated. Model goodness of fit, comparison and selection were used for the preliminary trial, all vertebral sections that
were based on the Akaike information criterion (AIC), with had been stained with crystal violet had at least 2 out of 3 read-
the best model defined as the one having the lowest AIC value ings with the same age estimation (i.e., all these recordings354 R. Coelho et al.: Aquat. Living Resour. 24, 351–357 (2011)
Table 1. Precision indexes for band enhancing techniques tested for ageing Sphyrna zygaena. CV refers to the coefficient of variation and APE
to the average percent error. Accepted readings (in %) refer to the % that would have been acceptable to use in the growth model, i.e., those
that had at least 2 out of 3 consistent age estimations. n = 30 specimens / vertebrae tested per technique.
Precision index
Technique Accepted readings (%)
CV APE
Crystal violet 5.0 5.8 100
Alizarin red 6.5 7.3 83
No staining 8.1 8.9 67
20
18 Female
16
14 Male
quency (n)
12
10
8
6
Freq 4
2
0
Age (years)
Fig. 4. Age distributions of male and female Sphyrna zygaena (n =
138).
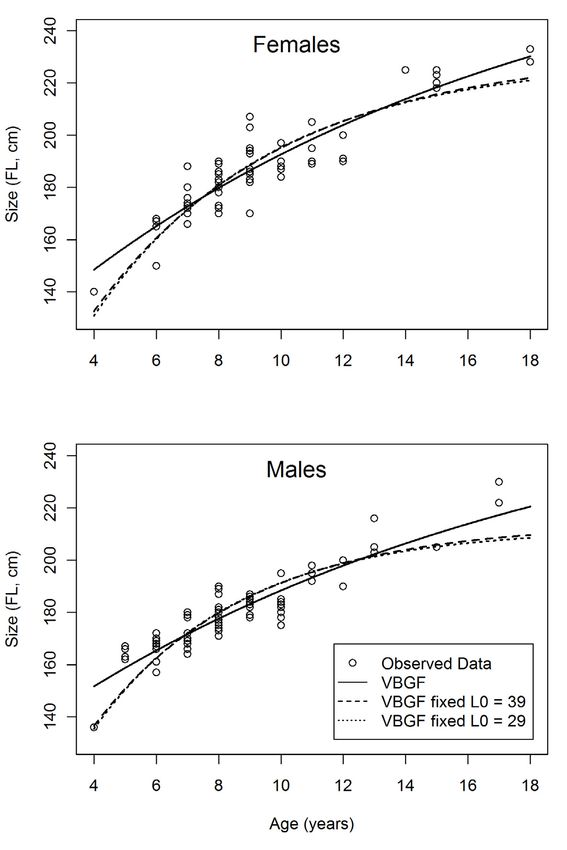
Estimated ages ranged from 4 to 21 years in males, and
from 4 to 18 years in females (Fig. 4). The younger specimens
Fig. 3. Microphotograph of a vertebral section of Sphyrna. zygaena, (age 4) had sizes of 136 and 140 cm FL. Considering that size
with the identification of the birth mark (b) and 10 growth bands. at birth was estimated at 29 to 39 cm FL, these specimens grew
approximately 25 cm FL per year on average during those ini-
tial years of life.
could have been used for the growth models), while that per- The growth models were calculated and plotted separately
centage decreased to 83% with alizarin red stain and to 67% for each sex (Fig. 5), revealing significant differences between
for the sections left unstained (Table 1). Therefore, the tech- males and females (likelihood ratio test: χ2 = 11.86, d f = 3,
nique of slicing the vertebrae into 500 μm sections and stain- p = 0.008). The Lin f values estimated with the VBGF tended
ing them with crystal violet seems to be the most appropriate to be higher than those estimated with the VBGF with fixed
for S. zygaena, and was applied to the remaining specimens L0 , while the k parameters tended to be lower (Table 2). The
used in the study (Fig. 3). differences between using a fixed size at birth of 29 or 39 cm
FL produced minimal differences in the estimated Lin f and k
parameters (Table 2). In terms of model goodness of fit, the
3.3 Age estimation and growth modelling AIC values were better (lower) for the growth curves estimated
with the VBGF.
Pearson product moment correlation was high (0.93) be-
tween specimen size and vertebral radius (VR) where the
growth bands were counted. The linear regression between FL 4 Discussion
(cm) and VR (mm) was defined by:
FL = 53.16 + 11.63 VR Because no previous age and growth studies are known for
(n = 139; SE intercept (β0 ) = 4.31; SE slope (β1 ) = 0.38; S. zygaena, the first step of the present work was to assess
R2 = 0.87), which band enhancement technique would produce the best
and was highly significant (regression ANOVA: F = 938; results for estimating ages in this species. Cailliet (1983) un-
p < 0.001). derlines the importance of such preliminary analyses, partic-
In general, the vertebral sections stained with crystal violet ularly for species where no previous studies have ever been
were relatively easy to read, and a clear pattern of alternating carried out. The observation of growth bands in the verte-
translucent and opaque bands was visible. It was possible to bral sections of S. zygaena was generally easy for most of
age 138 out of the 139 specimens initially processed. The sin- our samples, particularly after applying the crystal violet stain.
gle specimen that could not be aged had vertebrae with very Alizarin red stain produced acceptable results but these were
poor band discrimination, and was therefore discarded from generally poorer than those obtained with crystal violet. On
the analysis. the other hand, trying to count growth bands without any bandR. Coelho et al.: Aquat. Living Resour. 24, 351–357 (2011) 355
Fig. 5. Observed ages and estimated growth models (in fork length) for male and female Sphyrna zygaena.
enhancement technique (vertebral sections left unstained) or different growth models, and we chose to compare the tradi-
analysing X-rays of whole vertebrae was much more difficult, tional VBGF with a modified VBGF using a fixed L0 (size at
as there was poor contrast between the opaque and translucent birth). In general, the k values were higher and the Lin f val-
bands in these cases. ues were lower when using the VBGF with known L0 instead
As a baseline, Campana (2001) suggested reference levels of the traditional VBGF. In terms of model goodness of fit, the
of 7.6% for CV and 5.5% for APE, but mentioned that most AIC values were lower for the VBGF than for the VBGF using
studies reporting shark ages based on vertebrae had CV values a fixed L0 .
exceeding 10%. In our preliminary trials, both crystal violet Even though this is the first known age and growth study
and alizarin red results had values lower that these reference for S. zygaena in the Atlantic Ocean, other closely related
levels suggested by Campana (2001). Additional advantages species have already been studied, such as the scalloped ham-
of the crystal violet technique are that it is very simple and merhead in the NW Atlantic Ocean and Gulf of Mexico
fast to apply and has a lower cost. Other authors have used this (Branstetter 1987; Piercy et al. 2007), off NE Taiwan (Chen
technique on hammerhead sharks of the same genus (Sphyrna), et al. 1990) and off Mexico in the Eastern Pacific (Anislado-
namely the scalloped hammerhead (S. lewini) (Piercy et al. Tolentino and Mendoza 2001; Anislado-Tolentino et al. 2008).
2007) and great hammerhead (S. mokarran) (Piercy et al. The growth coefficients (k values) estimated in these studies
2010). ranged from minima of 0.073 (sexes combined) in the Gulf
Because this is the first approach to modelling the growth of Mexico (Branstetter 1987) to 0.222 (males) and 0.249 (fe-
of S. zygaena, it was important to examine and compare males) off NE Taiwan (Chen et al. 1990). Even though no356 R. Coelho et al.: Aquat. Living Resour. 24, 351–357 (2011)
Table 2. Growth parameters (Lin f FL cm, k year−1 and t0 year) for Sphyrna zygaena (sexes combined and separate) from the Eastern Equatorial
Atlantic, obtained with the von Bertalanffy growth function (VBGF) and the VBGF with fixed L0 (29 and 39 cm FL). For each model,
parameters are presented with the respective standard errors (SE) and 95% confidence intervals (CI). Model goodness of fit is given by the
Akaike information criterion (AIC).
95 % CI
Sex Model Parameter Estimate SE
Lower Upper
Lin f 277.7 24.4 229.6 325.9
VBGF, AIC = 932 k 0.06 0.02 0.03 0.10
t0 –8.3 2.1 –12.5 –4.0
Sexes combined Lin f 220.2 2.8 214.7 225.7
VBGF L0 = 29 cm, AIC = 971
k 0.20 0.01 0.18 0.21
Lin f 222.3 2.93 216.5 228.1
VBGF L0 = 39 cm, AIC = 965
k 0.18 0.01 0.17 0.20
Lin f 271.8 29.2 213.5 330.0
VBGF, AIC = 482 k 0.06 0.02 0.02 0.10
t0 –9.4 2.9 –15.1 –3.7
Males Lin f 212.2 3.2 205.8 218.7
VBGF L0 = 29 cm, AIC = 514
k 0.22 0.01 0.20 0.24
Lin f 214.1 3.4 207.4 220.9
VBGF L0 = 39 cm, AIC = 510
k 0.20 0.01 0.18 0.23
Lin f 285.2 41.3 202.7 367.7
VBGF, AIC = 443 k 0.07 0.03 0.01 0.13
t0 –7.3 3.3 –13.9 –0.8
Females Lin f 229.2 4.6 219.9 238.3
VBGF L0 = 29 cm, AIC = 452
k 0.18 0.01 0.16 0.20
Lin f 231.5 4.9 221.7 241.3
VBGF L0 = 39 cm, AIC = 450
k 0.17 0.01 0.15 0.19
direct comparison can be made between different species, the For the bonnethead (Sphyrna tiburo) in the Gulf of Mexico,
values that were estimated for S. zygaena in the present study Parsons (1993) also validated the periodicity of growth band
seem to fall at the lower end of these ranges presented pre- deposition as one pair of bands per year by analysing vertebrae
viously for the scalloped hammerhead. Elasmobranch fishes of specimens marked with oxytetracycline. However, firm con-
generally have long lives and slow growth rates (Cortés 2000). firmation of this annual pattern is still lacking for S. zygaena,
In the present case, such slow growth rates make S. zygaena and future work on the species should address this issue.
particularly vulnerable to overexploitation.
The growth parameters presented in this paper are, to our
Compagno (1984) described the size at birth of S. zygaena
knowledge, the first ones available for S. zygaena in the East-
as between 50 and 61 cm TL, which corresponds to 29 to
ern Equatorial Atlantic Ocean. These results meet some of the
39 cm FL after conversion. Considering that the younger spec-
recent recommendations requested by ICCAT for more studies
imens in the present study were two specimens of age 4 with
focused on the life history parameters of poorly known oceanic
sizes of 136 and 140 cm FL, this means that these specimens
sharks. These parameters can now be incorporated into stock
grew on average approximately 25 cm FL per year during
assessment models to help to provide future advice and recom-
those first years of life. In older specimens, the size increments
mendations for the sustainable utilization of those resources.
became smaller as growth slowed down.
A significant linear relationship was estimated between
the size of the specimens and the radius of their vertebrae.
Acknowledgements. Samples were collected as part of the SELECT-
Nonetheless, no age verification or validation was made dur- PAL project (Programa PROMAR Proj. 31-03-05-FEP-1) and EU
ing this study, so our assumption of annual growth band for- Data Collection Framework. Thanks are due to the crews of the FV
mation remains unvalidated. Previous studies on other ham- Príncipe das Marés and FV Alma Lusa, and to the technicians (I.
merhead shark species have discussed this issue, with differ- Ribeiro, M. Cerqueira and J.R. Táta) for collecting the samples. The
ent criteria and results. For the scalloped hammerhead, Chen authors are grateful to G. Burgess and Dr. A. Piercy (Florida Museum
et al. (1990) assumed that two pairs of bands per year were be- of Natural History) for providing recommendations on processing the
ing deposited in the Taiwanese population, while Piercy et al. vertebra. Thanks are also due to the many student volunteers from the
(2007) assumed a pattern of one pair of bands per year in Univ. Florida that helped cleaning the vertebrae in the Florida Pro-
the NW Atlantic. For the great hammerhead shark, Sphyrna gram for Shark Research laboratory. Rui Coelho was supported by a
mokarran, Passerotti et al. (2010) validated the annual depo- grant from FCT (Ref: BDP 40523/2007) co-funded by “POCI-2010
sition pattern of the growth bands with the bomb radiocarbon Programa Operacional Ciência e Inovação 2010” and “FSE Fundo
technique, demonstrating that indeed one pair of bands (one Social Europeu”. Joana Fernandez-Carvalho holds a grant from FCT
opaque and one translucent) was being deposited annually. (Ref: BD 60624/2009).R. Coelho et al.: Aquat. Living Resour. 24, 351–357 (2011) 357
References Cortés E., Arocha F., Beerkircher L., Carvalho F., Domingo
A., Heupel M., Holtzhausen H., Santos M.N., Ribera M.,
Abramoff M.D., Magalhaes P.J., Ram S.J., 2004, Image Processing Simpfendorfer C., 2010, Ecological risk assessment of pelagic
with ImageJ. Biophotonics International, 11, 36–42. sharks caught in Atlantic pelagic longline fisheries. Aquat. Living
Anislado-Tolentino V., Cabello M.G., Linares F.A., Mendoza C.R., Resour. 23, 25–34.
2008, Age and growth of the scalloped hammerhead shark, Goldman K.J., 2004, Age and growth of elasmobranch fishes. In:
Sphyrna lewini (Griffith and Smith, 1834) from the Southern Musick J.A., Bonfil R. (Eds.) Elasmobranch fisheries manage-
coast of Sinaloa, Mexico. Hidrobiologica 18, 31–40. ment techniques, Singapore, APEC, pp. 97–132.
Anislado-Tolentino V., Robinson-Mendoza C., 2001, Age and growth Harry A.V., Macbeth W.G., Gutteridge A.N., Simpfendorfer C.A.,
for the scalloped hammerhead shark, Sphyrna lewini (Griffith and 2011, The life histories of endangered hammerhead sharks
Smith, 1834) along the Central Pacific Coast of Mexico. Cienc. (Carcharhiniformes, Sphyrnidae) from the east coast of Australia.
Mar. 27, 501–520. J. Fish Biol. 78, 2026–2051.
Barker M.J., Schluessel V., 2005, Managing global shark fish- ICCAT, 2003, Resolution by ICCAT on the shark fishery. ICCAT
eries: suggestions for prioritizing management strategies. Aquat. Resolution 2003-10. URL: http://www.iccat.es/Documents/Recs/
Conserv. Mar. Freshw. Ecosyst. 15, 325–347. compendiopdf-e/2003-10-e.pdf
Beamish R.J., Fournier D.A., 1981, A method for comparing the pre- ICCAT, 2004, Recommendation by ICCAT concerning the conser-
cision of a set of age determinations. Can. J. Fish. Aquat. Sci. 38, vation of sharks caught in association with fisheries managed
982–983. by ICCAT. ICCAT Recommendation 2004-10. URL: http://www.
Branstetter S., 1987, Age, growth and reproductive biology of the iccat.es/Documents/Recs/compendiopdf-e/2004-10-e.pdf
silky shark, Carcharhinus falciformis, and the scalloped ham- ICCAT, 2007, Supplemental recommendation by ICCAT concern-
merhead, Sphyrna lewini, from the Northwestern Gulf of Mexico. ing sharks. ICCAT Recommendation 2007-06. URL: http://www.
Environ. Biol. Fishes 19, 161–173. iccat.es/Documents/Recs/compendiopdf-e/2007-06-e.pdf
Buencuerpo V., Rios S., Moron J., 1998, Pelagic sharks associated Johnson A.G., 1979, A simple method for staining the centra of
with the swordfish, Xiphias gladius, fishery in the eastern North teleost vertebrae. NE Gulf Sci. 3, 113–115.
Atlantic Ocean and the Strait of Gibraltar. Fish. Bull. 96, 667–
Katsanevakis S., 2006, Modelling fish growth: Model selection,
685.
multi-model inference and model selection uncertainty. Fish. Res.
Cailliet G.M., Martin L.K., Kusher D., Wolf P., Welden B.A., 1983, 81, 229–235.
Techniques for enhancing vertebral bands in age estimation of
California elasmobranchs. In: Prince E.D., Pulos L.M. (Eds.) Kimura D.K., 1980, Likelihood methods for the von Bertalanffy
Proc. International workshop on age determination of oceanic growth curve. Fish. Bull. 77, 765–773.
pelagic fishes: tunas, billfishes, sharks. NOAA Tech. Rep. NMFS LaMarca M.S., 1966, A simple technique for demonstrating calci-
8, pp. 157–165. fied annuli in the vertebrae of large elasmobranchs. Copeia 1966,
Cailliet G.M., Goldman K.J., 2004, Age determination and validation 351–352.
in chondrichthyan fishes. In: Carrier J., Musick A., Heithaus M. Parsons G.R., 1993, Age determination and growth of the bonnet-
(Eds.) The biology of sharks and their relatives, Boca Raton, CRC head shark Sphyrna tiburo: a comparison of two populations.
Press, pp. 399–447. Mar. Biol. 117, 23–31.
Campana S.E., 2001, Accuracy, precision and quality control in age Passerotti M.S., Carlson J.K., Piercy A.N., Campana S.E., 2010, Age
determination, including a review of the use and abuse of age validation of great hammerhead shark (Sphyrna mokarran), de-
validation methods. J. Fish Biol. 59, 197–242. termined by bomb radiocarbon analysis. Fish. Bull. 108, 346–
Cerrato R. M., 1990, Interpretable statistical tests for growth compar- 351.
isons using parameters in the von Bertalanffy equation. Can. J. Piercy A.N., Carlson J.K., Sulikowski J.A., Burgess G. H., 2007,
Fish. Aquat. Sci. 47, 1416–1426. Age and growth of the scalloped hammerhead shark, Sphyrna
Chang W.Y.B., 1982, A statistical method for evaluating the repro- lewini, in the north-west Atlantic Ocean and Gulf of Mexico. Mar.
ducibility of age determinations. Can. J. Fish. Aquat. Sci. 39, Freshw. Res. 58, 34-40.
1208–1210. Piercy A.N., Carlson J.K., Passerotti M.S., 2010, Age and growth of
Chen C.T., Leu T.C., Joung S.J., Lo N.C.H., 1990, Age and growth the great hammerhead shark, Sphyrna mokarran, in the north-
of the scalloped hammerhead, Sphyrna lewini, in Northeastern western Atlantic Ocean and Gulf of Mexico. Mar. Freshw. Res.
Taiwan waters. Pac. Sci. 44, 156–170. 61, 992–998.
Clarke S.C., McAllister M.K., Milner-Gulland E.J., Kirkwood G.P., R Development Core Team, 2010, R: A language and environment
Michielsens C.G.J., Agnew D.J., Pikitch E.K., Nakano H., Shivji for statistical computing. Vienna, R Foundation for Statistical
M.S., 2006, Global estimates of shark catches using trade records Computing. http://www.R-project.org.
from commercial markets. Ecol. Lett. 9, 1115–1126. Smith S.E., Au D.W., Show C., 1998, Intrinsic rebound potentials of
Compagno L.J.V., 1984, Sharks of the world. An annotated and 26 species of Pacific sharks. Mar. Freshw. Res. 49, 663–678.
illustrated catalogue of shark species known to date. Part 2. Stevens J.D., Bonfil R., Dulvy N.K., Walker P.A., 2000, The effects of
Carcharhiniformes. Rome, FAO. fishing on sharks, rays, and chimaeras (chondrichthyans), and the
Cortés E., 2000, Life history patterns and correlations in sharks. Rev. implications for marine ecosystems. ICES J. Mar. Sci. 57, 476–
Fish. Sci. 8, 299–344. 494.You can also read