COVID-19 PANDEMIC: A CASE STUDY FROM AUSTRALIA
←
→
Page content transcription
If your browser does not render page correctly, please read the page content below
E XAMINATION OF C OMMUNITY S ENTIMENT DYNAMICS DUE TO
                                            COVID-19 PANDEMIC : A C ASE S TUDY FROM AUSTRALIA

                                                                           Jianlong Zhou∗, Shuiqiao Yang, Chun Xiao, Fang Chen
                                                                                            Data Science Institute
                                                                                 University of Technology Sydney, Australia
                                                                                    firstname.lastname@uts.edu.au
arXiv:2006.12185v1 [cs.SI] 22 Jun 2020

                                                                                                  A BSTRACT
                                                      The outbreak of the novel Coronavirus Disease 2019 (COVID-19) has caused unprecedented impacts
                                                      to people’s daily life around the world. Various measures and policies such as lock-down and social-
                                                      distancing are implemented by governments to combat the disease during the pandemic period. These
                                                      measures and policies as well as virus itself may cause different mental health issues to people such
                                                      as depression, anxiety, sadness, etc. In this paper, we exploit the massive text data posted by Twitter
                                                      users to analyse the sentiment dynamics of people living in the state of New South Wales (NSW)
                                                      in Australia during the pandemic period. Different from the existing work that mostly focuses the
                                                      country-level and static sentiment analysis, we analyse the sentiment dynamics at the fine-grained
                                                      local government areas (LGAs). Based on the analysis of around 94 million tweets that posted by
                                                      around 183 thousand users located at different LGAs in NSW in five months, we found that people
                                                      in NSW showed an overall positive sentimental polarity and the COVID-19 pandemic decreased
                                                      the overall positive sentimental polarity during the pandemic period. The fine-grained analysis of
                                                      sentiment in LGAs found that despite the dominant positive sentiment most of days during the study
                                                      period, some LGAs experienced significant sentiment changes from positive to negative. This study
                                                      also analysed the sentimental dynamics delivered by the hot topics in Twitter such as government
                                                      policies (e.g. the Australia’s JobKeeper program, lock-down, social-distancing) as well as the focused
                                                      social events (e.g. the Ruby Princess Cruise). The results showed that the policies and events did
                                                      affect people’s overall sentiment, and they affected people’s overall sentiment differently at different
                                                      stages.
                                                     Keywords Community sentiment · Twitter · COVID-19 · Visual analytics

                                         1       Introduction
                                         The World Health Organization (WHO) declared novel Coronavirus Disease 2019 (COVID-19) as a pandemic in March
                                         2020 [1]. It has now spread across the world and there have been more than 6.29 million confirmed cases and more
                                         than 380,000 people died because of the virus until 4 June 2020. Almost all countries in the world are battling against
                                         COVID-19 to prevent it from the spread as much as possible. The impact of the COVID-19 outbreak has been so huge
                                         that it is said to be the most serious epidemic in the past hundred years comparable to pandemics of the past like Spanish
                                         flu of 1918, or the Black Death in the mid-1300s. The outbreak has caused scares across the globe affecting millions of
                                         people either through infection or through increased mental health issues, such as disruption, stress, worry, fear, disgust,
                                         sadness, anxiety (a fear for one’s own health,and a fear of infecting others), and perceived stigmatisation [2, 3]. These
                                         mental health issues can even occur in people not at high risk of getting infected, in the face of a virus with which
                                         the common people may be unfamiliar [2]. These mental health issues can cause severe emotional, behavioral and
                                         physical health problems. Complications linked to mental health include: unhappiness and decreased enjoyment of life,
                                         family conflicts, relationship difficulties, social isolation, problems with tobacco, alcohol and other drugs, self-harm
                                         and harm to others (such as suicide or homicide), weakened immune system, and heart disease as well as other medical
                                         conditions.
                                             ∗
                                                 Corresponding author
Furthermore, lock-down is a commonly completed measure to stop the spread of virus in the community. For example,
countries like China, Italy, Spain, and Australia were fighting with the COVID-19 pandemic by taking strict measures
of national-wide lock-down or by cordoning off the areas that were suspected of having risks of community spread
throughout the period of the pandemic, expecting to “flatten the curve”. Therefore, it is critical to learn the status of the
community mental health especially during the pandemic period so that corresponding measures can be taken in time.
On the other hand, social media such as Twitter represent a relatively real-time large-scale snapshot of messages
reflecting people’s thoughts and feelings. Every tweet is a signal of the social media users’ state of mind and state of
being at that moment [4]. Aggregation of such digital traces may make it possible to monitor health behaviours at a
large-scale [5]. While during the lock-down of COVID-19, people have taken social media to express their feelings and
find a way to calm themselves down. Therefore, social media have created possibilities of analysing people’s sentiment
and its dynamics during the pandemic period. The most recent work have used Twitter to analyse public sentiment
during the pandemic [6, 3]. These work largely focus on the public sentiment in country-level or even multiple countries
for a specific period. However, a granular analysis of sentiment of a single city or even a suburb is more operable for
related parties such as governmental departments to take corresponding actions. Furthermore, the sentiment dynamics
over time instead of sentiment of a specific period will help related parties understand the effectiveness of any measures
implemented.
This paper aims to examine community sentiment dynamics due to COVID-19 pandemic in Australia. Twitter data are
collected and analysed to extract sentiment scores which may be affected by COVID-19 and related events during the
COVID-19 period. Instead of the sentiment examination of the whole country, this paper investigates a fine-grained
analysis of sentiment in local government areas of a state in Australia, which can help government to take corresponding
measures more objectively if necessary. Furthermore, through analysing topic key words labelled by hashtag in Twitter,
this paper examines community dynamics because of different events, government policies and programs or others with
visual analytics.

2     Related Work
2.1   Social media sentiment analysis

Sentiment analysis is a research topic that analyzes people’s sentiments, opinions, mental states, and emotions from
data resources like texts, images and videos that generated by human beings [7]. With the rapidly development of social
media platforms such as Twitter and Facebook [8], it becomes possible to collect large-scale of text data from millions
of users for the social medial sentiment analysis [9]. Most of the methods take the concept of supervised machine
learning for social media sentimental analysis [10, 11, 12, 13]. In those methods, the supervised machine learning
models classify a tweet into predefined sentimental categories such as positive and negative. Specifically, the supervised
machine learning models firstly need to be trained with data that contain the labels for different sentiments. Then, the
trained models can be used for sentiment prediction. For instance, Go et al. [10] adopted the distant supervision strategy
to create a labeled tweet dataset for training supervised machine learning models such as Naive Bayes, Maximum
Entropy, and support vector machine. The emoticons such as :), :( are served as noise labels to indicate the sentiment of
the tweet publisher as positive or negative. With the superior advantages of automatically feature selection from raw
data, deep learning techniques have also been adopted for sentiment analysis. Jiang et al. [12] adopted the the latest
techniques of deep neural network as the sentimental classifier for more accurate sentiment classification. Except the
machine learning based methods for sentiment analysis, there some lexicon-based methods that exploiting the word
polarity to compute the sentimental score for a given text [14, 15, 16]. For example, Ortega et al. [16] proposed to
exploit multiple steps of different techniques for Twitter sentimental analysis. Firstly, the pre-processing for tweets
was performed to clean the raw texts. Then, an existing polarity detection method were adopted to compute the
sentimental score of each word. Finally, they adopted a rule-based classification to classify the sentiments for tweets.
The adopted polarity detection and rule-based classification methods were based on existing knowledge bases: WordNet
and SentiWordNet.

2.2   Sentiment analysis for COVID-19 based on Twitter

More recently, with the pandemic of COVID-19 spreading in the world, there are some work that exploiting sentiment
analysis as a tool to investigate the people’s reactions. For instance, Barkur et al. [6] analysed public sentiment of
Indians after the lock-down announcements were made. The social media platform Twitter was used for the sentiment
analysis. The analysis showed that Indians have taken the fight against COVID-19 positively and majority are in
agreement with the government for announcing the lock-down to flatten the curve. However, this work focused on the
overall public sentiment of a specific period but did not show the dynamics of sentiment during the study period. Bhat
et al. [3] analysed sentiments expressed globally through Twitter and found that the perception of Twitter users was

                                                             2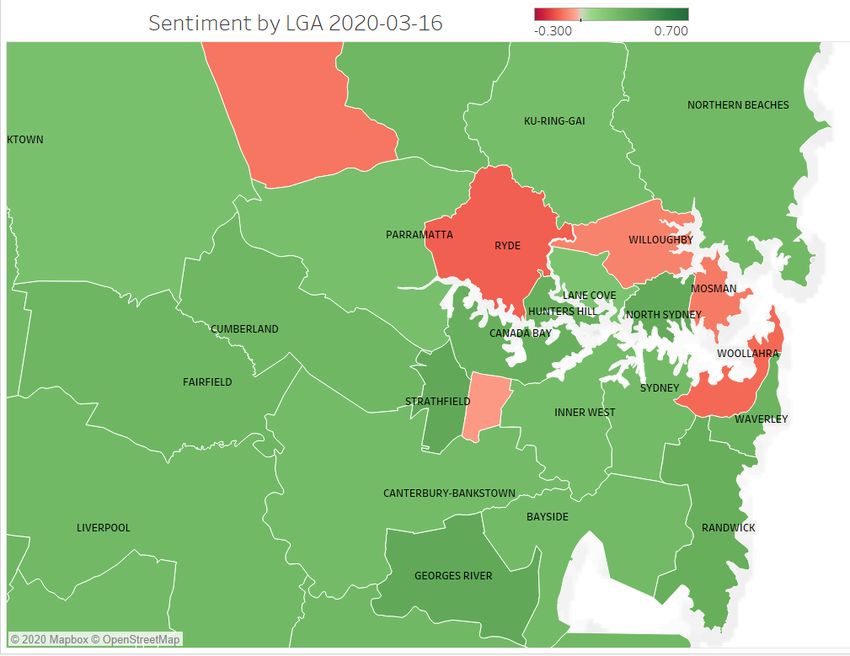
mostly positive or neutral during the COVID-19 pandemic period. It indicated that even though Twitter users were
quarantined or staying at home, yet they were hopeful and experiencing a different unique socialization opportunity
with family. Dubey [17] analysed tweets from twelve countries during a selected period of the pandemic, aiming to
understand how the citizens of different countries are dealing with the situation. The results showed that while majority
of people were taking a positive and hopeful approach, there were instances of fear, sadness and disgust exhibited
worldwide. Furthermore, four countries, France, Switzerland, the Netherland and USA have shown signs of distrust and
anger on a bigger scale as compared to the remaining eight countries.
However, these previous work on COVID-19 sentiment analysis largely focuses on the public sentiment in country-level
or globally for a specific period. However, little work is found to analyse dynamics of community sentiment over time
for different regions especially when government policies are applied or significant events are occurred during the
pandemic period.

3         Data and Methods

3.1        Study Location

For this study, we focus on the state New South Wales (NSW) in Australia. NSW has a large population of around 8.1
million based on the census in September 2019 from Australian Bureau of Statistics2 . The state’s capital city Sydney is
Australia’s most populated city with a population of over 5.3 million people. The Local Government Areas (LGAs) of
New South Wales are the third tier of government in the Australian state (the three tiers are federal, state, and local
government). There are 128 LGAs in NSW. In this study, the Twitter data were collected for each LGA separately so
that the sentiment dynamics can be analysed and compared among LGAs.

3.2        Measuring Community Sentiment

Sentiment analysis, also known as opinion mining or emotion AI, is a sub-field of Natural Language Processing (NLP)
that tries to identify, extract, quantify, and study affective states and subjective information within a given text. We
utilize the VADER (Valence Aware Dictionary for sEntiment Reasoning) [14] to analyse sentiments implied in tweets.
VADER is a lexicon and rule-based sentiment analysis tool that is specifically attuned to sentiments expressed in social
media.
In this study, VADER is used to compute the sentiment value of each tweet. The sentiment of all tweets in an LGA is
then aggregated for each LGA. In this study, sentiment of each LGA is aggregated with the Eq. 1 - 3 to get the dominant
mean sentiment of LGA, which is also called community sentiment:

                                                                        Pnp
                                                                          i    sip
                                                                 Sp =                                                (1)
                                                                        PnNg
                                                                          i    sig
                                                                 Sg =                                                (2)
                                                                      N
                                                       Sp , if |Sp | >= |Sg |
                                            Sf =                                                                     (3)
                                                       Sg , if |Sp | < |Sg |

where sip is the sentiment value of tweet i which has positive sentiment, np is the number of tweets which have positive
sentiment, where sig is the sentiment value of tweet i which has negative sentiment, ng is the number of tweets which
have negative sentiment, N is the number of all tweets in an LGA, and Sf is the final sentiment of an LGA.
Table 1 and Table 2 show examples of tweets with positive and negative sentiment values computed with VADER.

3.3        Analytical Approach

In this study, various analytical approaches are applied to examine community sentiment dynamics before the outbreak
of COVID-19, during the COVID-19 period, and post period of the COVID-19. The community sentiment may be
affected by various significant events or policies implemented by the government during the COVID-19 period such as
the state lock-down or restrictions to movement.
      2
          https://www.abs.gov.au/

                                                             3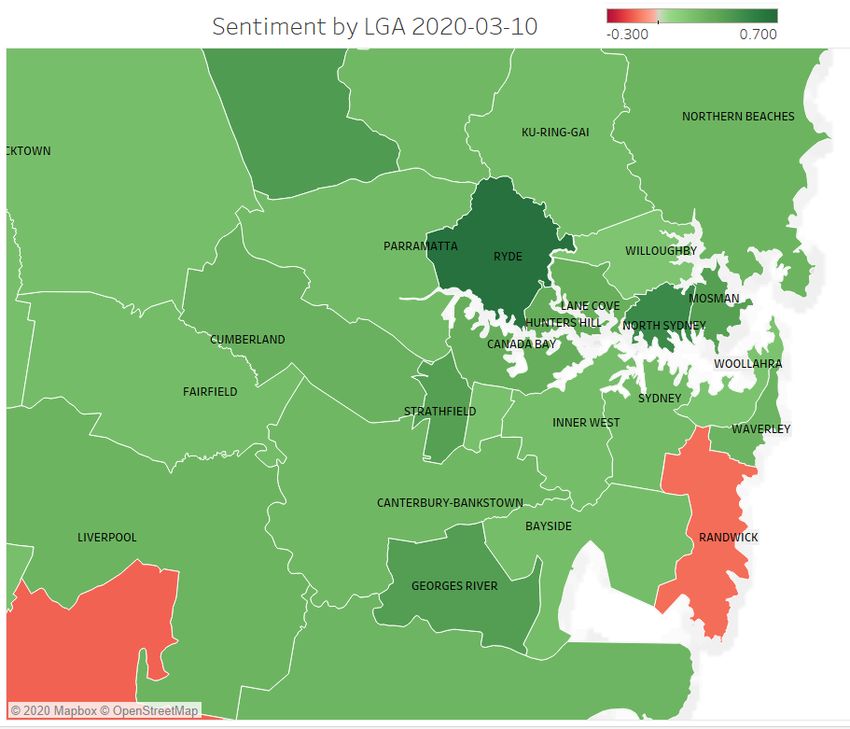
Table 1: Examples of tweets with positive sentiment.
                  Tweets                                                                          Sentiment
                  Thank you all for hanging out in stream tonight. It was a lot of fun! ...
                  for the amazing support you are all amazing.                                    0.9628
                  this interesting piece by the team at Macrobusiness suggests that it
                  mainly benefits the wealthy, and the working classes ...                        0.9606
                  Harold is my best friend, and he’s got a personality unlike any other cat ...
                  I hope the other cats of the litter have gone on to brighten the lives of ...   0.967
                  Congratulations! He’s adorable. I hope you’re all safe and well and
                  getting some sleep                                                              0.9652
                  Good evening my dear Bianca, another beautiful day here. Hope you are
                  enjoying the sunshine too. Stay safe ...                                        0.9869
                  you are literally the best person! who would ever thing of making a zoom
                  release party with fans? oh yeah, YOU! you are the most kind and caring ...     0.9768
                  So great to see the quality care happening at MHOC Vacation Care.
                  Happy kids, fun activities, safe environment                                    0.9896

                                     Table 2: Examples of tweets with negative sentiment.
                 Tweets                                                                           Sentiment
                 So between this and CO repeating it’s just a flu and the rest is a dem hoax,
                 WHY THE BLOODY HELL BLAME CHINA?? HAD THEY BLOODY ...                            -0.9741
                 So sad it’s painful to see #CoronaVirusinKenya has become a weapon to
                 hurt our people. God be our shield                                               -0.9604
                 The most overweight liar? Tells the biggest lies? The most dangerous lies?
                 The most lies per word spoken? Or all four?                                      -0.9623
                 SARS-2+A NEW AGE; SARS-2 (COVID19) is an opportunity to stop
                 all the lies from publicly paid servants and fraudulent statement...             -0.9661
                 Guns at Protests, Looks More like a Threat of Violence... These are the
                 Crazy Bastards Dangerous Bastards... #MichiganProtest #Michigan                  -0.9655
                 Yea, criminals usually don’t like anyone telling them that they can’t be
                 criminals. Fired Up? Well we’re fucking fired up too. So fuck those ...          -0.9762
                 Find them, charge them for assault and braking social distancing laws.
                 There is no excuse for this! Shameful, disgusting, ... behaviour!                -0.9702

The community sentiment of overall NSW state is firstly aggregated and analysed. We then split the community
sentiment analysis for each LGA of NSW to see the sentiment difference among LGAs. The daily and weekly dynamics
of these community sentiment are examined to find how various factors affect community sentiment.

3.4        Datasets

In order to analyse the dynamics of sentiment during the COVID-19 pandemic period in a fine-grained level, we
collected tweets from Twitter users that live in the different LGAs of NSW in Australia. The time span of the collected
tweets is from 1 January 2020 to 22 May 200 which covers dates that the first confirmed case of coronavirus was
reported in NSW (22 January 2020) and the first time that the NSW premier announced the relaxing for the lock-down
policy (10 Mary 2020). Table 3 shows the statistics of the collected tweet dataset. We totally collected 94,707,264
tweets with averagely 739,901 tweets for each LGA during the study period. Datasets of COVID-19 tests and confirmed
cases in NSW were collected from DATA.NSW 3 .

4         Results

Fig. 1a shows the overview of the number of tests and confirmed cases of COVID-19 in NSW over the COVID-19
period. It was found that there usually had test peaks at the beginning of each week and had less numbers at the
weekend, which well aligns with the people’s living habits in Australia. It shows that the outbreak peak of COVID-19
      3
          https://data.nsw.gov.au/

                                                               4
Table 3: Statistics of the collected Twitter dataset.
Description Numbers
Total Twitter users 183,104
Average Twitter user per LGA 1,430.5
Average tweets per LGA 739,900.5
Total tweets 94,707,264
(a) The tests and confirmed cases of COVID-19 in NSW.
(b) The overall community sentiment dynamics in NSW during the study period.
Figure 1: The COVID-19 spread and community sentiment in NSW.
in NSW was on 26 March 2020 and tests were significantly increased after 13 April 2020. It also shows that most of
confirmed cases were originally related to overseas.
54.1 Sentiment Dynamics in NSW
Fig. 1b presents the overall community sentiment dynamics in NSW during the study period. It shows that the public
had a highly positive sentiment on the new year day. There was a significant decrease until 5 January. This was maybe
because of the continued bushfire in NSW at that period. After that, the sentiment of the public was increased and then
kept relatively stable until 8 March. From 8 March, the overall sentiment was decreased significantly and kept in low
level continuously. This is well aligned with the overall trend of COVID-19 spreading in NSW as shown in Fig. 1a,
which shows that the number of confirmed cases of COVID-19 was increased significantly from 8 March. Overall,
the community showed a dominant positive sentiment during the study period despite the COVID-19 spread. This
observation is also aligned with findings from other researchers who got the similar conclusions from one country or
several countries [6, 3]. Furthermore, it shows that the COVID-19 spread did affect community sentiment and decreased
the community sentiment during the COVID-19 pandemic, which can be clearly seen from Fig. 1a.
4.2 Sentiment Dynamics in LGAs
This subsection further analyses community sentiment dynamics in LGAs in NSW. Fig. 2 shows an example of
community sentiment dynamics in LGAs in NSW on different two days: 10 March 2020 and 16 March 2020. It shows
that the community sentiment were different across different LGAs on each day. Furthermore, the community sentiment
of each LGA was changed on different days. When we zoom in the sentiment map to LGAs around Sydney City areas
as shown in Fig. 3, we can see more details of sentiment changes of LGAs around Sydney City areas on these two days.
For example, Ryde is an LGA close to Sydney City. In an aged care centre in this LGA, a nurse and an 82-year-old
elderly resident were firstly tested positive for coronavirus at the beginning of March4 . After that, a number of elderly
residents in this aged care centre were tested positive for COVID-19 or even died. At the same time, a childcare centre
and a hospital in this LGA have been reported positive COVID-19 cases in March. Many staff from the childcare centre
and the hospital were asked to test virus and conduct home isolation for 14 days. All these maybe resulted in public
sentiment changes significantly as shown in Fig. 3. For example, the sentiment in Ryde LGA was changed from high
positive to high negative on 10 March 2020 and 16 March 2020.
Fig. 4 presents the community sentiment dynamics in Ryde LGA over the study period. It shows that the community
experienced frequent negative sentiment in March, and recovered to positive dominantly in April. This is maybe because
the COVID-19 spread situation in March as mentioned previously in this LGA and the spread was controlled in April,
which helped people boost positive sentiment.
4.3 Dynamics of Twitter Topics
We analysed hot topics in tweets labelled with hashtag. The sentiment of each tweet is got using the VADER tool as
described previously. If the sentiment of a tweet is positive, the topic key words labelled with hashtag in this tweet
are then labelled as positive sentiment. The topic key words with the negative sentiment are got with the similar
approach. Different topic key words are then analysed statistically to understand the sentiment dynamics. Fig. 5 shows
the dynamics of top 20 Twitter topics during the study period in NSW.
4.3.1 Topic of COVID-19
Fig. 5 shows that COVID is the dominant topic in the study period from the week of 2 March. When we drill down into
details of this figure, we can see that the occurrence of the topic of COVID appeared from the week of 20 January, and
began to increase significantly from the week of 2 March. It reached the peak in the week of 23 March. After that, the
occurrence of the topic of COVID decreased gradually and kept stable from the week of 20 April. This trend is well
aligned with the trend of COVID-19 situation in NSW as shown in Fig. 1a. Furthermore, Fig. 5 shows that the dominant
sentiment around the topic of COVID was positive. This conclusion is aligned with findings in previous research [6, 3].
This is maybe because that people had a positive belief to the combat against COVID-19 by the government and the
society.
4.3.2 Topic of Lock-Down
Fig. 6 shows the dynamics of Twitter topic of lock-down. From this figure, we can see that the topic of lock-down
was started from the week of 9 March and reached to the peak point at the week of 23 March. On that week, NSW
government officially announced the state lock-down on 30 March and the restrictions were begun from 31 March5 .
4
https://www.smh.com.au/national/woman-catches-coronavirus-in-australia-40-sydney-hospital-staff-quarantined-202
html
5
https://gazette.legislation.nsw.gov.au/so/download.w3p?id=Gazette_2020_2020-65.pdf
6Figure 2: The community sentiment map in LGAs in NSW on 10 March 2020 (top) and 16 March 2020 (bottom).
After that, this topic was kept stable until the week of 27 April. From the week of 4 May, there was a small peak of the
topic occurrences. Maybe this was because that the NSW government announced the ease of restrictions on 10 May6 .
Overall, the community kept a positive sentiment dominantly to lock-down despite negative sentiment existing. This
was maybe because that some people were not accustomed to the restrictions which caused negative sentiment.
6
https://www.nsw.gov.au/media-releases/nsw-to-ease-restrictions-week-0
7Figure 3: The community sentiment dynamics in selected LGAs around Sydney City areas on 10 March 2020 (left) and
16 March 2020 (right).
Figure 4: The community sentiment dynamics in Ryde LGA.
Figure 5: The dynamics of top 20 Twitter topics during the research period.
8Figure 6: The dynamics of Twitter topic of “Lock-down”.
Figure 7: The dynamics of Twitter topic of “Social-distancing”.
4.3.3 Topic of Social-Distancing
Fig. 7 presents the dynamics of Twitter topic of social-distancing. It shows that the topic of social-distancing appeared
from the week of 9 March and significantly increased to a peak after a week. This is maybe because that the confirmed
cases of COVID-19 were increased significantly and the government encouraged people to increase social-distancing,
which caused a significant increase of public conversation on social-distancing on Twitter. After that week, the
occurrence of the topic of social-distancing was gradually decreased until the week of 6 April and then kept stable
relatively. Overall, the community showed the positive sentiment dominantly from the beginning of social-distancing
until the week of 11 May. This is maybe because that the NSW government announced the ease of restrictions on 10
May as mentioned previously, which resulted in the negative sentiment to the social-distancing from the community.
9Figure 8: The dynamics of Twitter topic of “Jobkeeper”.
4.3.4 Topic of Jobkeeper
The Australian Government introduced the Jobkeeper wage subsidy program at the end of March, allowing businesses
to claim a fortnightly payment of $1,500 per eligible employee from 30 March 2020, for a maximum of 6 months7 .
The starting time of jobkeeper topic was also clearly demonstrated in the dynamics of Twitter topic of jobkeeper as
shown in Fig. 8. This figure shows that the public kept a positive sentiment dominantly to jobkeeper program from the
beginning of its introduction until the week of 27 April. From the week of 4 May, people showed a negative sentiment
dominantly. This is maybe because that people had received negative news on operations of jobkeeper program. For
example, it was reported that the number of people on jobkeeper was revised down by 3 million due to the errors at the
beginning of the program8 .
4.4 Sentiment Dynamics Affected by Events
Community sentiment may also be affected by big events during the COVID-19 period. For example, the Ruby Princess
Cruise docked in Sydney Harbour on 18 March 2020. Despite having passengers with COVID-19 symptoms, about
2700 passengers were allowed to disembark on 19 March without isolation or other measures, which was considered to
create a coronavirus hotbed in Australia. The Ruby Princess Cruise has been linked to at least 662 confirmed cases and
22 deaths of COVID-199 .
Fig. 9 presents the community sentiment dynamics related to the Ruby Princess. It shows that the topic of the Ruby
Princess appeared from the week of 16 March and was increased significantly after that. It reached a peak at the
week of 30 March and kept high occurrences until the beginning of May. This trend is well aligned with the actual
timeline of the public reporting of confirmed cases and deaths as well as other events (e.g. police in NSW announced a
criminal investigation into the Ruby Princess cruise ship debacle on 5 April) related to the Ruby Princess 9 . Overall, the
community showed a dominant negative sentiment to Ruby Princess throughout the event period.
5 Conclusions and Future Work
This study conducted a comprehensive analysis of the sentiment dynamics in the state of New South Wales (NSW) in
Australia due to the COVID-19 pandemic. Instead of the country-level study, the sentiment in this work was analysed
at local government areas (LGAs) level based on more than 94 million tweets collected from Twitter for a 5-month
period started from 1 January 2020. The results of the dynamical sentiment analysis showed that the overall sentimental
7
https://treasury.gov.au/sites/default/files/2020-04/Fact_sheet_supporting_businesses_0.pdf
8
https://www.abc.net.au/news/2020-05-22/jobkeeper-numbers-cut-by-3-million-businesses-accounting-bungle/
12277488
9
https://www.theguardian.com/world/2020/may/02/australias-coronavirus-lockdown-the-first-50-days
10Figure 9: The dynamics of Twitter topic of “Rubyprincess”.
polarity was positive in NSW and the positive sentiment was decreased from the beginning of March to May 2020
due to the significant increase of COVID-19 confirmed cases from 8 March and the further carried out lock-down
policies. When we drilled down into LGAs, it was found that different LGAs showed different sentiment polarity
scores during the study time, and each LGA may have different sentiment polarity scores on different days. Despite
the dominant positive sentiment most of days during the study period, some LGAs experienced significant sentiment
dynamics maybe because of the serious COVID-19 infections in those LGAs. This study also analysed the sentimental
dynamics delivered by the hot topics such as government policies (e.g. the Australia JobKeeper program) and the
focused social events (e.g. the Ruby Princess Cruise). The results showed that the implemented policies or occurred
events affected people’s overall sentiment differently, and at the different stage, people showed different sentiment.
This paper presented a case study of the sentiment dynamics due to COVID-19. More interesting topics can be explored
based on the current study in the future. For example, the topic modelling techniques can be applied to conduct more
comprehensive analysis to get people’s topic level sentiments. The individual level sentiment dynamics can also be
analysed to help government and local communities to locate the people that may suffer from the negative sentiments.
Besides the sentiment polarity, other mental health issues due to COVID-19 such as depression and anxiety will also be
analysed in Twitter in our future work.
6 Acknowledgements
Authors would like to thank Zhangwei Chen for his help in the collection of Twitter data.
Conflict of Interest: No conflict of interest exists for all participating authors.
References
[1] World Health Organization. Coronavirus disease (covid-19) pandemic, 2020. [Online; accessed 2020-05-15].
[2] Nicola Montemurro. The emotional impact of COVID-19: From medical staff to common people. Brain, Behavior,
and Immunity, March 2020.
[3] Muzafar Bhat, Monisa Qadri, Noor-ul-Asrar Beg, Majid Kundroo, Naffi Ahanger, and Basant Agarwal. Sentiment
analysis of social media response on the covid19 outbreak. Brain, Behavior, and Immunity, May 2020.
[4] Joseph Gibbons, Robert Malouf, Brian Spitzberg, Lourdes Martinez, Bruce Appleyard, Caroline Thompson,
Atsushi Nara, and Ming-Hsiang Tsou. Twitter-based measures of neighborhood sentiment as predictors of
residential population health. PLoS ONE, 14(7), July 2019.
11[5] Kokil Jaidka, Salvatore Giorgi, H. Andrew Schwartz, Margaret L. Kern, Lyle H. Ungar, and Johannes C. Eichstaedt.
Estimating geographic subjective well-being from twitter: A comparison of dictionary and data-driven language
methods. Proceedings of the National Academy of Sciences, 117(19):10165–10171, 2020.
[6] Gopalkrishna Barkur, Vibha, and Giridhar B. Kamath. Sentiment analysis of nationwide lockdown due to COVID
19 outbreak: Evidence from india. Asian Journal of Psychiatry, April 2020.
[7] Bing Liu. Sentiment analysis and opinion mining. Synthesis lectures on human language technologies, 5(1):1–167,
2012.
[8] Shuiqiao Yang, Guangyan Huang, Bahadorreza Ofoghi, and John Yearwood. Short text similarity measurement
using context-aware weighted biterms. In Concurrency Computation. John Wiley and Sons Ltd, 2020.
[9] T. Anuprathibha and C. S.Kanimozhi Selvib. A survey of twitter sentiment analysis. IIOAB Journal, 7(9Special
Issue):374–378, 2016.
[10] Alec Go, Richa Bhayani, and Lei Huang. Twitter Sentiment Classification using Distant Supervision. Processing,
-:1–6, 2009.
[11] Anshul Mittal and Arpit Goel. Stock prediction using twitter sentiment analysis. Standford University, CS229
(2011 http://cs229. stanford. edu/proj2011/GoelMittal-StockMarketPredictionUsingTwitterSentimentAnalysis.
pdf), 15, 2012.
[12] Zhao Jianqiang, Gui Xiaolin, and Zhang Xuejun. Deep Convolution Neural Networks for Twitter Sentiment
Analysis. IEEE Access, 6:23253–23260, 2018.
[13] Ammar Hassan, Ahmed Abbasi, and Daniel Zeng. Twitter sentiment analysis: A bootstrap ensemble framework.
Proceedings - SocialCom/PASSAT/BigData/EconCom/BioMedCom 2013, pages 357–364, 2013.
[14] Clayton J. Hutto and Eric Gilbert. Vader: A parsimonious rule-based model for sentiment analysis of social media
text. In ICWSM, 2014.
[15] Mike Thelwall, Kevan Buckley, Georgios Paltoglou, Di Cai, and Arvid Kappas. Sentiment strength detection in
short informal text. Journal of the American society for information science and technology, 61(12):2544–2558,
2010.
[16] Reynier Ortega, Adrian Fonseca, and Andres Montoyo. Ssa-uo: unsupervised twitter sentiment analysis. In
Second joint conference on lexical and computational semantics (* SEM), volume 2, pages 501–507, 2013.
[17] Akash Dutt Dubey. Twitter sentiment analysis during COVID-19 outbreak. SSRN Scholarly Paper ID 3572023,
Social Science Research Network, April 2020.
12You can also read