Using Unilateral Strength, Power and Reactive Strength Tests to Detect the Magnitude and Direction of Asymmetry: A Test-Retest Design - MDPI
←
→
Page content transcription
If your browser does not render page correctly, please read the page content below
sports
Article
Using Unilateral Strength, Power and Reactive
Strength Tests to Detect the Magnitude and Direction
of Asymmetry: A Test-Retest Design
Chris Bishop 1 , Paul Read 2, *, Shyam Chavda 1 , Paul Jarvis 1 and Anthony Turner 1
 1   Faculty of Science and Technology, London Sports Institute, Middlesex University, London NW1 4RL, UK;
     C.Bishop@mdx.ac.uk (C.B.); S.Chavda@mdx.ac.uk (S.C.); P.Jarvis@mdx.ac.uk (P.J.);
     A.N.Turner@mdx.ac.uk (A.T.)
 2   Athlete Health and Research Performance Center, Aspetar Orthopaedic and Sports Medicine Hospital,
     Doha 29222, Qatar
 *   Correspondence: paul.read@aspetar.com

 Received: 7 February 2019; Accepted: 28 February 2019; Published: 4 March 2019

 Abstract: The aims of the present study were to determine test-retest reliability for unilateral strength
 and power tests used to quantify asymmetry and determine the consistency of both the magnitude
 and direction of asymmetry between test sessions. Twenty-eight recreational trained sport athletes
 performed unilateral isometric squat, countermovement jump (CMJ) and drop jump (DJ) tests over
 two test sessions. Inter-limb asymmetry was calculated from both the best trial and as an average
 of three trials for each test. Test reliability was computed using the intraclass correlation coefficient
 (ICC), coefficient of variation (CV) and standard error of measurement (SEM). In addition, paired
 samples t-tests were used to determine systematic bias between test sessions and Kappa coefficients
 to report how consistently asymmetry favoured the same side. Within and between-session reliability
 ranged from moderate to excellent (ICC range = 0.70–0.96) and CV values ranged from 3.7–13.7%
 across tests. Significant differences in asymmetry between test sessions were seen for impulse during
 the isometric squat (p = 0.04; effect size = –0.60) but only when calculating from the best trial. When
 computing the direction of asymmetry across test sessions, levels of agreement were fair to substantial
 for the isometric squat (Kappa = 0.29–0.64), substantial for the CMJ (Kappa = 0.64–0.66) and fair to
 moderate for the DJ (Kappa = 0.36–0.56). These results show that when asymmetry is computed
 between test sessions, the group mean is generally devoid of systematic bias; however, the direction
 of asymmetry shows greater variability and is often inter-changeable. Thus, practitioners should
 consider both the direction and magnitude of asymmetry when monitoring inter-limb differences in
 healthy athlete populations.

 Keywords: Inter-limb differences; limb dominance; variability

1. Introduction
     Inter-limb asymmetry refers to differences in the performance or function of one limb with respect
to the other [1,2]. Strength and jumping-based tests are often used to quantify these differences
when assessing the physical characteristics of athletes [3–5], largely because these are considered
fundamental physical qualities to enhance athletic performance. Strength testing methods to quantify
asymmetry have included the back squat [5,6], isometric squat and mid-thigh pull [7,8] or isokinetic
dynamometry [9,10]. Jump tests such as countermovement jumps (CMJ) [3–5,11,12] and drop jumps
(DJ) [13,14] are also commonly assessed to quantify asymmetry, most likely because of their similarity
to sport-specific movement patterns, ease of implementation and time-efficient nature.

Sports 2019, 7, 58; doi:10.3390/sports7030058                                     www.mdpi.com/journal/sports
Sports 2019, 7, 58 2 of 14
When asymmetry is considered, more affordable versions of force platforms are available
compared to 10–15 years ago; thus, assessments of between-limb differences using the force-time curve
are now a practically viable option for a wide range of athletes [15]. For example, when considering
jump tests, previous research has highlighted the importance of additional metrics beyond jump height
such as peak and mean force and propulsive and braking impulse [16,17], because they allow some
interpretation of jump strategy rather than outcome measures alone. However, limited literature exists
in this capacity with respect to asymmetry; therefore, further examination of unilateral tests which can
be used to quantify inter-limb differences over more than a single test session is warranted [18,19].
Regardless of the test selected, another consideration for asymmetry is how the data are reported.
Typically, testing protocols encourage three trials [20], with some studies quantifying asymmetry from
the best trial [8,21] and others from the average of all trials performed [3,14]. To the authors’ knowledge,
no study has directly compared asymmetry scores when calculating the percentage difference between
limbs from the best score and an average of all test trials. Given previous literature has suggested
the variable nature of asymmetry [11,13,21], it is plausible that these methods would result in notable
differences in the magnitude of asymmetry. Thus, examining whether significant differences exist
between test sessions and calculation methods (best versus average) would provide practitioners with
meaningful information as to which method might be favourable for inter-limb asymmetry profiling.
Literature on this topic has also highlighted the task-specific nature of asymmetry [11,14,21–23].
Impellizzeri et al. [24] and Maloney [25] have discussed the concept of the ‘direction of asymmetry’
which provides an indication as to which limb may be dominant, for example, during a jump
test. Recent literature has shown that the direction of asymmetry may be just as variable as the
magnitude [11,14,23,26]. Bishop et al. [11] used the unilateral isometric squat, CMJ and broad jump to
detect how consistently peak force (PF) and impulse favoured the same limb across tests using a Kappa
coefficient. With the exception of propulsive impulse between jumps, levels of agreement ranged
from slight to fair (Kappa range = −0.34 to 0.32), indicating that the direction of asymmetry varied
substantially between tests. Whilst useful, the above studies reporting the direction of asymmetry
have only done so for a single test session. Thus, further information regarding how consistent the
direction of asymmetry is across more than a single test session is again warranted.
Cumulatively, the available evidence indicates that further research is required to examine more
metrics during unilateral tasks, if the best versus average asymmetry score is more reliable for test
re-test comparison and if there is consistency in the direction of asymmetry between sessions. Therefore,
the aims of the present study were threefold: (1) to determine the test-retest reliability of unilateral
strength and jumping-based tests that can be used to quantify asymmetries, (2) determine whether any
significant differences exist for asymmetry between test sessions and, (3) determine how consistently
asymmetries favour the same side between tests sessions.
2. Materials and Methods
2.1. Study Design
This study used a test-retest design enabling both within and between-session data to be quantified
for three unilateral tests: the isometric squat, CMJ and DJ. Test reliability was computed three ways
and inter-limb asymmetries were calculated from two methods: the best trial and as an average of all
trials. Systematic bias was quantified between test sessions to determine any significant changes in
test scores and asymmetry values. Finally, Kappa Coefficients were used to determine the levels of
agreement for the direction of asymmetry [11], showing whether the same limb scored higher between
test sessions.
2.2. Participants
Twenty-eight recreational soccer and rugby athletes (age = 27.29 ± 4.6 years; mass = 80.72 ± 9.26 kg;
height = 1.81 ± 0.06 m) volunteered to take part in this study. Inclusion criteria required all participantsSports 2019, 7, 58 3 of 14
to have a minimum of two year’s resistance training experience, with any participant excluded from
the study if they had experienced a lower body injury at the time of testing or in the preceding
three months. Participants read and were required to provide written informed consent forms to
demonstrate that they were willing and able to undertake all testing protocols. Ethical approval was
granted from the London Sports Institute Research and Ethics committee at Middlesex University.
2.3. Procedures
Participants visited the laboratory twice and performed three trials on each limb for the following
tests during both visits: unilateral isometric squats, CMJ and DJ on a single force platform (PASPORT
force plate, PASCO Scientific, Roseville, CA, USA) sampling at 1000 Hz. Test order was randomized so
as to minimize potential fatigue impacting one specific test, although the same test order was retained
during both test sessions for each participant. A familiarization session was conducted 72 h before
the first data collection session, so as to reduce any potential learning effects during data collection
sessions. Participants were provided with the relevant test instructions and the opportunity to practice
each assessment until they reached a satisfactory level of technical competence, which was monitored
throughout by an accredited strength and conditioning coach. A standardized dynamic warm up was
conducted prior to each session consisting of dynamic stretches to the lower body, in addition to three
practice trials at approximately 60%, 80% and 100% of perceived maximal effort for all tests. Three
minutes of rest was provided after the final warm up trial before undertaking the first test and test
sessions were separated by a minimum of 72 h.
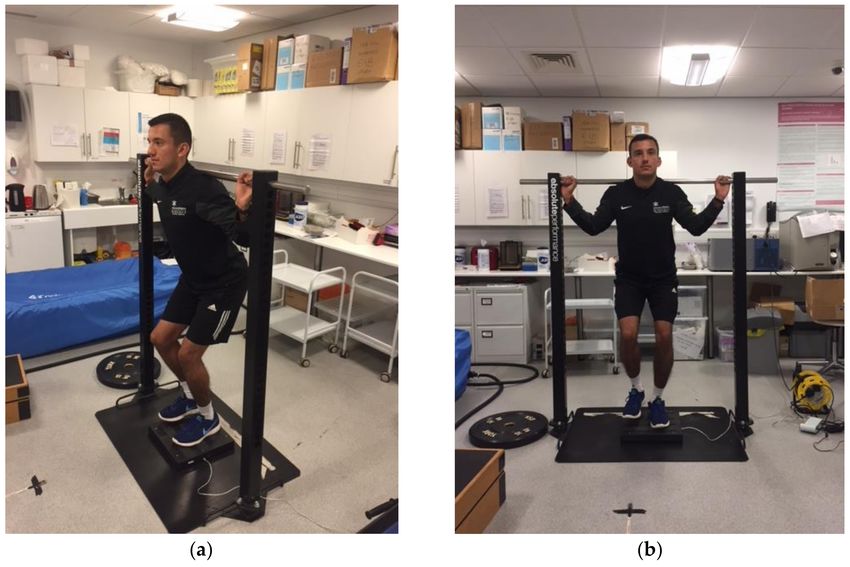
2.3.1. Unilateral Isometric Squat
A custom built isometric testing system (Absolute Performance, Cardiff, UK) was used for this
test protocol (Figure 1a,b). Firstly, participants were instructed to step on to the centre of the force
plate with their foot pointing forward. A goniometer was used to measure 140◦ of hip and knee
flexion [8,18] for each participant, with full extension of the knee joint equalling 180◦ . The fulcrum of
the goniometer was positioned on the lateral epicondyle of the femur. The stabilisation arm was lined
up along the line of the fibula (in the direction of the lateral malleolus) and the movement arm was
lined up with the femur (pointing towards the greater trochanter at the hip). The non-stance limb was
required to hover next to the working limb, so as to try and keep the hips level during the isometric
squat action; thus, aiding balance and stability. Once in position, participants were required to remain
motionless for 2 s, without applying any upwards force (which was verified by manual detection
of the force-time curve in real time). Each trial was then initiated by a “3, 2, 1, Go” countdown and
participants were instructed to try and extend their knees and hips by driving up as “fast and hard
as possible” [7,27] against the bar for five seconds. Recorded metrics for each trial included PF and
impulse at 0.3 s, which was chosen as the specified epoch for impulse based on comparable research
using the unilateral mid-thigh pull [7]. The first meaningful change in force was established when
values surpassed five standard deviations (SD) of each participant’s body mass [28]. Peak force was
defined as the maximum force generated during the test and impulse was defined as the net force
multiplied by the time taken to produce it at 0.3 s; that is, the area under the force-time curve [7].Sports 2019, 7, 58 4 of 14
Figure 1. (a,b) Example positioning for the unilateral isometric squat protocol.
2.3.2. Unilateral Countermovement Jump
Participants were instructed to step onto the centre of the force plate (foot pointing forward) with
their designated test leg with hands placed on hips and were required to remain in the same position
for the duration of the test. Due to the portable nature of the force platform, weight plates were
positioned on the ground, touching each side of the force platform to ensure no movement occurred
throughout testing. The jump was initiated by performing a countermovement to a self-selected depth
before accelerating vertically as explosively as possible into the air. The test leg was required to remain
fully extended throughout the flight phase of the jump before landing back onto the force plate as
per the set up. The non-jumping leg was slightly flexed with the foot hovering at mid-shin level
and no additional swinging of this leg was allowed during trials. Each trial was separated by 60 s
of rest. Recorded metrics included jump height and peak propulsive force, with definitions for their
quantification conducted in line with suggestions by Gathercole et al. [17] and Chavda et al. [29]. Jump
height was defined as the maximum height achieved calculated from the impulse-momentum method.
Peak propulsive force was defined as the maximum force output during the propulsive phase of the
jump and was determined when a positive centre of mass velocity was achieved [29].
2.3.3. Unilateral Drop Jump
Participants started by standing on an 18 cm box which was chosen as the height to drop from
based on previous research [13,14]. With hands fixed on hips, participants were required to step off
the box with their designated test leg which subsequently landed on the centre of the force plate
below. Upon landing, participants were instructed to minimize ground contact time and jump as high
as possible thereafter in line with previous DJ research [13,14]. Each trial was separated by a 60 s
rest period and recorded metrics included jump height (calculated from the flight time method) and
reactive strength index (RSI), quantified using the equation flight time/ground contact time [14].Sports 2019, 7, 58 5 of 14
2.4. Statistical Analysis
Initially all force-time data were exported to Microsoft Excel™, expressed as means and standard
deviations (SD) and later transferred into SPSS (V.24, Chicago, IL, USA) for additional analyses.
Within-session reliability was quantified using the coefficient of variation (CV) inclusive of 95%
confidence intervals, standard error of the measurement (SEM) and a 2-way random ICC with
absolute agreement inclusive of 95% confidence intervals [30]. The CV was calculated via the
formula: (SD(trials 1–3)/average(trials 1–3) × 100) with values ≤ 10% suggested to be considered
acceptable [16]. ICC values were interpreted in line with suggestions by Koo and Li, [31] where scores
>0.9 = excellent, 0.75–0.9 = good, 0.5–0.75 = moderate andSports 2019, 7, 58 6 of 14
Table 1. Within and between-session test reliability data for the unilateral isometric squat, countermovement and drop jump tests.
Test Session 1 Test Session 2 Between Session
Test/Metric
ICC (95% CI) CV (95% CI) SEM ICC (95% CI) CV (95% CI) SEM ICC (95% CI) CV (95% CI)
PF-L (N) 0.94 (0.88–0.97) 5.4 (3.7–7.2) 107.5 0.96 (0.92–0.98) 4.9 (4.0–5.7) 78.8 0.93 (0.86–0.97) 6.4 (4.1–8.6)
PF-R (N) 0.93 (0.87–0.96) 5.7 (4.2–7.2) 105.1 0.94 (0.89–0.97) 5.5 (4.1–6.9) 106.2 0.86 (0.72–0.93) 7.7 (5.6–9.8)
Iso Squat
Imp-L (N·s) 0.89 (0.80–0.94) 13.7 (10.0–17.4) 23.6 0.89 (0.81–0.95) 10.1 (8.0–12.3) 21.2 0.90 (0.80–0.95) 8.9 (6.2–11.5)
Imp-R (N·s) 0.92 (0.85–0.96) 12.1 (9.5–14.8) 22.0 0.90 (0.83–0.95) 10.6 (8.1–13.1) 20.2 0.85 (0.70–0.93) 12.9 (9.4–16.4)
JH-L (m) 0.89 (0.81–0.95) 4.8 (3.8–5.9) 0.01 0.87 (0.77–0.93) 4.2 (3.2–5.3) 0.01 0.82 (0.65–0.91) 3.7 (1.9–5.5)
JH-R (m) 0.81 (0.68–0.90) 5.4 (4.1–6.7) 0.01 0.85 (0.74–0.92) 5.0 (4.0–6.0) 0.01 0.78 (0.59–0.89) 4.2 (2.5–5.8)
SLCMJ
PF-L (N) 0.89 (0.80–0.94) 5.8 (4.5–7.1) 67.7 0.93 (0.88–0.97) 4.9 (4.1–5.6) 42.9 0.85 (0.71–0.93) 6.2 (4.3–8.1)
PF-R (N) 0.93 (0.87–0.96) 5.3 (4.2–6.4) 48.0 0.90 (0.82–0.95) 5.0 (3.9–6.2) 50.2 0.83 (0.67–0.92) 6.3 (4.4–8.2)
JH-L (m) 0.90 (0.82–0.95) 7.5 (5.4–9.7) 0.01 0.94 (0.89–0.97) 7.1 (4.3–9.9) 0.01 0.74 (0.49–0.87) 10.1 (6.3–13.9)
JH-R (m) 0.90 (0.82–0.95) 8.1 (5.9–10.2) 0.01 0.93 (0.87–0.96) 6.8 (5.3–8.4) 0.01 0.75 (0.53–0.87) 11.2 (8.0–14.5)
SLDJ
RSI-L 0.87 (0.77–0.93) 4.9 (3.7–6.0) 0.06 0.93 (0.88–0.97) 4.0 (2.6–5.3) 0.05 0.70 (0.37–0.86) 6.7 (4.5–8.9)
RSI-R 0.91 (0.84–0.95) 4.7 (3.3–6.2) 0.06 0.88 (0.79–0.94) 5.9 (4.3–7.4) 0.07 0.84 (0.68–0.92) 5.1 (3.4–6.8)
ICC = intraclass correlation coefficient; CI = confidence intervals; CV = coefficient of variation; SEM = standard error of the measurement; Iso = isometric; PF = peak force; Imp = impulse at
0.3 s; N = Newtons; N·s = Newton seconds; L = left; R = right; SLCMJ = single leg countermovement jump; JH = jump height; m = meters; SLDJ = single leg drop jump; RSI = reactive
strength index.
Table 2. Mean test and asymmetry data (± SD) for test metrics reported from the best trial and average of all trials.
Test Session 1 Test Session 2
Test/Metric
Best Score Asymmetry (%) Average Score Asymmetry (%) Best Score Asymmetry (%) Average Score Asymmetry (%)
PF-L (N) 1597.0 ± 438.9 8.4 ± 6.8 1519.7 ± 414.8 8.6 ± 5.9 1631.3 ± 394.2 8.9 ± 6.9 1561.8 ± 392.3 9.0 ± 6.5
PF-R (N) 1595.1 ± 397.3 1519.1 ± 382.4 1643.2 ± 433.4 1570.8 ± 424.6
Iso Squat
Imp-L (N·s) 199.5 ± 71.2 15.5 ± 11.4 177.7 ± 69.3 14.5 ± 11.3 190.8 ± 64.0 9.6 ± 7.8* 174.5 ± 59.4 10.9 ± 6.7
Imp-R (N·s) 192.9 ± 77.9 174.4 ± 75.0 191.9 ± 64.0 176.1 ± 61.6
JH-L (m) 0.21 ± 0.03 7.2 ± 6.1 0.20 ± 0.03 7.8 ± 5.9 0.22 ± 0.03 7.1 ± 5.0 0.21 ± 0.03 7.6 ± 4.9
JH-R (m) 0.20 ± 0.03 0.19 ± 0.03 0.21 ± 0.03 0.20 ± 0.03
SLCMJ
PF-L (N) 863.4 ± 204.0 7.5 ± 5.1 811.5 ± 177.6 7.1 ± 4.5 847.0 ± 162.3 6.6 ± 4.8 807.7 ± 156.5 6.6 ± 4.7
PF-R (N) 830.8 ± 181.5 793.4 ± 174.0 818.6 ± 158.7 779.6 ± 141.8
JH-L (m) 0.15 ± 0.03 10.1 ± 8.7 0.14 ± 0.03 11.1 ± 6.9 0.14 ± 0.04 10.7 ± 8.6 0.13 ± 0.04 10.8 ± 7.5
JH-R (m) 0.14 ± 0.03 0.13 ± 0.03 0.13 ± 0.04 0.13 ± 0.04
SLDJ
RSI-L 1.31 ± 0.17 8.1 ± 4.8 1.25 ± 0.18 7.5 ± 5.1 1.23 ± 0.20 7.3 ± 4.7 1.19 ± 0.20 7.4 ± 5.2
RSI-R 1.26 ± 0.20 1.21 ± 0.20 1.23 ± 0.20 1.17 ± 0.20
* Significantly different from asymmetry score (calculated from the best trial) in test session 1 (p = 0.04). Iso = isometric; PF = peak force; Imp = impulse at 0.3 s; N = Newtons; N·s =
Newton seconds; L = left; R = right; SLCMJ = single leg countermovement jump; JH = jump height; m = meters; SLDJ = single leg drop jump; RSI = reactive strength index.Sports 2019, 7, 58 7 of 14
Between-session effect size data for test and asymmetry scores (quantified using both methods)
are shown in Table 3. Trivial to small effect sizes were evident for test and asymmetry scores when
calculated from both the best and average of all trial methods. Notably, the largest effect size was
shown for impulse asymmetry (−0.60) during the isometric squat test, when calculated from the best
trial method.
Table 3. Between-session effect size data (95% confidence intervals) for test and asymmetry scores
using both methods of calculation.
Asymmetry % Asymmetry %
Test/Metric Best Score Average Score
(from Best Score) (from Average Score)
PF-L (N) 0.08 (0.80 to −0.63) 0.08 (0.79 to −0.64) 0.10 (0.82 to −0.61) 0.07 (0.79 to −0.64)
PF-R (N) 0.12 (0.83 to −0.60) 0.13 (0.84 to −0.59)
Iso Squat
Imp-L (N·s) −0.13 (0.59 to −0.85) −0.60 (0.14 to −1.33) −0.05 (0.67 to −0.77) −0.38 (0.34 to −1.10)
Imp-R (N·s) −0.01 (0.70 to −0.73) 0.03 (0.74 to −0.69)
JH-L (m) 0.33 (1.05 to −0.39) −0.03 (0.69 to −0.74) 0.33 (1.05 to −0.39) −0.03 (0.68 to −0.75)
JH-R (m) 0.33 (1.05 to −0.39) 0.33 (1.05 to −0.39)
SLCMJ
PF-L (N) −0.09 (0.63 to −0.81) −0.18 (0.53 to −0.90) −0.02 (0.69 to −0.74) −0.11 (0.61 to −0.82)
PF-R (N) −0.07 (0.64 to −0.79) −0.09 (0.63 to −0.80)
JH-L (m) −0.28 (0.44 to −1.00) 0.07 (0.79 to −0.64) −0.28 (0.44 to −1.00) −0.04 (0.67 to −0.76)
JH-R (m) −0.28 (0.44 to −1.00) 0.00 (0.72 to −0.72)
SLDJ
RSI-L −0.43 (0.29 to −1.15) −0.18 (0.54 to −0.90) −0.32 (0.40 to −1.04) −0.03 (0.69 to −0.74)
RSI-R −0.15 (0.57 to −0.87) −0.20 (0.52 to −0.92)
Iso = isometric; PF = peak force; Imp = impulse at 0.3 s; N = Newtons; N·s = Newton seconds; L = left; R = right;
SLCMJ = single leg countermovement jump; JH = jump height; m = meters; SLDJ = single leg drop jump;
RSI = reactive strength index.
Levels of agreement for asymmetry scores between test sessions were calculated using the Kappa
coefficient and are shown in Table 4. Results showed levels of agreement between test sessions
were fair to substantial for the isometric squat test (Kappa range = 0.29–0.64), substantial for the
CMJ (Kappa range = 0.64–0.66) and fair to moderate for the DJ (Kappa range = 0.36–0.56). Given the
changing nature of the direction of asymmetry between test sessions, individual asymmetry data are
presented in Figures 2–4.
Table 4. Kappa coefficients and descriptive levels of agreement showing how consistently asymmetry
favours the same leg between test sessions for the unilateral isometric squat, countermovement and
drop jump tests.
Test/Metric Kappa Coefficient Descriptor
Peak Force 0.64 Substantial
Isometric Squat
Impulse at 0.3s 0.29 Fair
Jump Height 0.64 Substantial
SLCMJ
Peak Force 0.66 Substantial
Jump Height 0.36 Fair
SLDJ
Reactive Strength Index 0.56 Moderate
SLCMJ = single leg countermovement jump; SLDJ = single leg drop jump.Sports 2019, 7, 58 8 of 14
Figure 2. Individual asymmetry data for peak force and impulse during the unilateral isometric squat test in both test sessions. Above 0 indicates larger score on right
leg and below 0 indicates larger score on left leg.Sports 2019, 7, 58 9 of 14
Figure 3. Individual asymmetry data for jump height and peak force during the unilateral countermovement jump test in both test sessions. Above 0 indicates larger
score on right leg and below 0 indicates larger score on left leg.Sports 2019, 7, 58 10 of 14
Figure 4. Individual asymmetry data for jump height and reactive strength index (RSI) during the unilateral drop jump test in both test sessions. Above 0 indicates
larger score on right leg and below 0 indicates larger score on left leg.Sports 2019, 7, 58 11 of 14
4. Discussion
The aims of the present study were threefold: (1) to determine the test-retest reliability of unilateral
strength and jumping-based tests that can be used to quantify asymmetries, (2) determine whether any
significant differences exist for asymmetry between test sessions when calculating differences from the
best trial and an average of all trials and, (3) determine how consistently asymmetries favour the same
side between tests sessions. Results showed moderate to excellent reliability for all tests both within
and between sessions. A significant difference in asymmetry (p = 0.04) was found for impulse during
the isometric squat when calculating asymmetry from the best trial. No other significant differences
in asymmetry were indicated. Kappa coefficients revealed fair to substantial levels of agreement for
asymmetry between test sessions, with the strongest consistency shown for the CMJ.
Data in Table 1 displays the within and between-session reliability for each test. A similar
trend was observed during both test sessions, with the greatest variability seen during the isometric
squat. Impulse in particular showed CV values > 10% on both limbs during both test sessions,
potentially indicating that practitioners should be cautious of using this metric if using the unilateral
isometric squat. Given the lower variability reported for this metric during bilateral isometric strength
assessments [8,36], this represents a novel finding when considering a unilateral version of this test.
In addition, results are comparable with previous literature using the unilateral isometric mid–thigh
pull. Dos’Santos et al. [7] reported CV values of 10.5–11.6% for impulse in both professional rugby
and collegiate athletes; thus, it would appear this metric may be subject to greater variability when
assessed unilaterally. Furthermore, it is possible that greater familiarization is required in order to
establish acceptable reliability for impulse during unilateral isometric strength assessments. Future
research should aim to include additional testing sessions in an attempt to establish when variability
has been reduced sufficiently (i.e.,Sports 2019, 7, 58 12 of 14
This is supported in part by Lake et al. [26] who investigated whether the peak and mean force methods
of calculating asymmetry agreed during a bilateral CMJ. Levels of agreement between methods were
assessed using the Kappa coefficient and ranged from 0.67–0.72, representing ‘substantial’ levels
of agreement. Whilst this may indicate a positive outcome, the authors proposed that given these
values were not near perfect (i.e., Kappa values at or close to 1), that the two methods of quantifying
asymmetry should not be used interchangeably. Furthermore, given the innate variability of asymmetry,
an average of all trials may capture some of the inconsistency seen across trials (noting that if using
unilateral test methods, the best score could be trial 1 on the left limb but trial 3 on the right limb).
Data in Table 4 displays the Kappa coefficients and accompanying descriptors for how consistently
asymmetry favoured the same leg between test sessions, for each metric. The Kappa coefficient
describes the proportion of agreement between two methods after any agreement by chance has
been removed [33]. Levels of agreement were fair to substantial (0.29–0.64) for the isometric squat,
substantial (0.64–0.66) for the CMJ and fair to moderate (0.36–0.56) for the DJ. Furthermore, it is
interesting to note that greater levels of agreement appear to be associated with improved test reliability,
noting that the CMJ showed the lowest CV values both within and between test sessions. These data
indicate that the direction of asymmetry (i.e., how consistently the same leg scores higher between test
sessions) varies considerably. Given this variable nature, it is suggested that individual data analysis is
a key consideration for practitioners when monitoring inter-limb asymmetry (see Figures 2–4). Despite
recent literature highlighting poor levels of agreement for the same metric across tests [11], to the
authors’ knowledge, this is the first study to report levels of agreement for the direction of asymmetry
over more than a single test session. Thus, direct comparisons with previous research are not possible
and requires further investigation using longitudinal study designs.
When interpreting the findings of the current study, practitioners should be aware of some
wider considerations on the topic of asymmetry. Firstly, in addition to longitudinal monitoring,
practitioners are advised to also consider more frequent monitoring in the short and long-term if
asymmetry profiling is deemed appropriate for the athlete. Jump tests are commonly included during
routine monitoring procedures [16,17] and practitioners may wish to consider asymmetry as a more
regular line of investigation during such protocols. Doing so would enable practitioners to effectively
determine trends in both the magnitude and direction of asymmetry. In turn, this may assist in the
decision-making process when considering targeted training interventions for athletes. Secondly,
testing modalities should always be considered within the context of athlete requirements when
using data to help inform practice. The present study used unilateral tests to detect asymmetry;
however, this may not always be appropriate. For example, in a sport such as weightlifting, virtually
all movements are bilateral and if asymmetry analysis is deemed necessary, it is more than likely that
test protocols should be conducted bilaterally to reflect the demands of the sport. Similarly, in team
sports, many movement patterns occur unilaterally (e.g., sprinting, changing direction, kicking), in
which case unilateral test protocols may be relevant. Practitioners are therefore advised to ensure that
procedures are ecologically valid for the population in question, regardless of whether asymmetry is
being investigated.
5. Conclusions
In summary, the magnitude of asymmetry appears to show significant differences between test
sessions for the isometric squat when computing data from the best trial but not from an average of
all trials. Given no training intervention was undertaken and no significant differences were found
between test sessions when computing asymmetry from the average of all trials, it is suggested that the
average method might be considered the most appropriate for calculating inter-limb differences.
The direction of asymmetry appears highly variable; thus, individual data analysis is a strong
consideration for practitioners and monitoring the direction of asymmetry may be more important
than purely the magnitude when the purpose is to measure changes over time.Sports 2019, 7, 58 13 of 14
Author Contributions: Conceptualization: C.B., P.R. and A.T.; Data Curation: C.B., S.C. and P.J.; Formal Analysis:
C.B., S.C. and P.J.; Investigation: C.B., S.C. and P.J.; Methodology: C.B., S.C. and P.J.; Resources: C.B., S.C. and A.T.;
Supervision: C.B., P.R. and A.T.; Visualization: C.B., P.R. and A.T.; Writing (Original Draft): C.B., P.R., S.C., P.J. and
A.T.; Writing (Review and Editing): C.B., P.R., S.C., P.J., A.T.
Funding: This research received no external funding.
Acknowledgments: The publication of this article was funded by the Qatar National Library
Conflicts of Interest: The authors declare no conflict of interest.
References
1. Bishop, C.; Read, P.; Chavda, S.; Turner, A. Asymmetries of the lower limb: The calculation conundrum in
strength training and conditioning. Strength Cond. J. 2016, 38, 27–32. [CrossRef]
2. Keeley, D.; Plummer, H.; Oliver, G. Predicting asymmetrical lower extremity strength deficits in college-aged
men and women using common horizontal and vertical power field tests: A possible screening mechanism.
J. Strength Cond. Res. 2011, 25, 1632–1637. [CrossRef] [PubMed]
3. Bell, D.; Sanfilippo, J.; Binkley, N.; Heiderscheit, B. Lean mass asymmetry influences force and power
asymmetry during jumping in collegiate athletes. J. Strength Cond. Res. 2014, 28, 884–891. [CrossRef]
[PubMed]
4. Ceroni, D.; Martin, X.; Delhumeau, C.; Farpour-Lambert, N. Bilateral and gender differences during
single-legged vertical jump performance in healthy teenagers. J. Strength Cond. Res. 2012, 26, 452–457.
[CrossRef] [PubMed]
5. Newton, R.; Gerber, A.; Nimphius, S.; Shim, J.; Doan, B.; Robertson, M.; Pearson, D.; Craig, B.; Hakkinen, K.;
Kraemer, W. Determination of functional strength imbalance of the lower extremities. J. Strength Cond. Res.
2006, 20, 971–977. [PubMed]
6. Sato, K.; Heise, G. Influence of weight distribution asymmetry on the biomechanics of a barbell squat.
J. Strength Cond. Res. 2012, 26, 342–349. [CrossRef] [PubMed]
7. Dos’Santos, T.; Thomas, C.; Jones, P.; Comfort, P. Assessing muscle-strength asymmetry via a unilateral-stance
isometric midthigh pull. Int. J. Sports Physiol. Perform. 2017, 12, 505–511. [CrossRef] [PubMed]
8. Hart, N.; Nimphius, S.; Cochrane, J.; Newton, R. Reliability and validity of unilateral and bilateral isometric
strength measures using a customised, portable apparatus. J. Aust. Strength Cond. 2012, 20, 61–67.
9. Costa Silva, J.; Detanico, D.; Dal Pupo, J.; Freitas, C. Bilateral asymmetry of knee and ankle isokinetic torque
in soccer players u20 category. Revista Brasileira de Cineantropometria & Desempenho Humano 2015, 17, 195–204.
[CrossRef]
10. Ruas, C.; Brown, L.; Pinto, R. Lower-extremity side-to-side strength asymmetry of professional soccer players
according to playing position. Kinesiology 2015, 2, 188–192.
11. Bishop, C.; Lake, J.; Loturco, I.; Papadopoulos, K.; Turner, A.; Read, P. Interlimb asymmetries: The need for
an individual approach to data analysis. J. Strength Cond. Res. 2018, Published ahead of print. [CrossRef]
12. Meylan, C.; McMaster, T.; Cronin, J.; Mohammed, N.; Rogers, C.; deKlerk, M. Single-leg lateral, horizontal,
and vertical jump assessment: Reliability, interrelationships, and ability to predict sprint and change of
direction performance. J. Strength Cond. Res. 2009, 23, 1140–1147. [CrossRef] [PubMed]
13. Maloney, S.; Fletcher, I.; Richards, J. A comparison of methods to determine bilateral asymmetries in vertical
leg stiffness. J. Sports Sci. 2016, 34, 829–835. [CrossRef] [PubMed]
14. Maloney, S.; Richards, J.; Nixon, D.; Harvey, L.; Fletcher, I. Do stiffness and asymmetries predict change of
direction performance? J. Sports Sci. 2017, 35, 547–556. [CrossRef] [PubMed]
15. Lake, J.; Mundy, P.; Comfort, P.; McMahon, J.; Suchomel, T.; Carden, P. Concurrent validity of a portable force
plate using vertical jump force-time characteristics. J. Appl. Biomech. 2018, 34, 410–413. [CrossRef] [PubMed]
16. Cormack, S.; Newton, R.; McGuigan, M.; Doyle, T. Reliability of measures obtained during single and
repeated countermovement jumps. Int. J. Sports Physiol. Perform. 2008, 3, 131–144. [CrossRef] [PubMed]
17. Gathercole, R.; Sporer, B.; Stellingwerff, T.; Sleivert, G. Alternative countermovement-jump analysis to
quantify acute neuromuscular fatigue. Int. J. Sports Physiol. Perform. 2015, 10, 84–92. [CrossRef] [PubMed]
18. Bishop, C.; Turner, A.; Jarvis, P.; Chavda, S.; Read, P. Considerations for selecting field-based strength and
power fitness tests to measure asymmetries. J. Strength Cond. Res. 2017, 31, 2635–2644. [CrossRef] [PubMed]Sports 2019, 7, 58 14 of 14
19. Read, P.; Oliver, J.; De Ste Croix, M.; Myer, G.; Lloyd, R. Consistency of field-based measures of
neuromuscular control using force-plate diagnostics in elite male youth soccer players. J. Strength Cond. Res.
2016, 30, 3304–3311. [CrossRef] [PubMed]
20. Turner, A.; Brazier, J.; Bishop, C.; Chavda, S.; Cree, J.; Read, P. Data analysis for strength and conditioning
coaches: Using excel to analyse reliability, differences, and relationships. Strength Cond. J. 2015, 37, 76–83.
[CrossRef]
21. Lockie, R.; Callaghan, S.; Berry, S.; Cooke, E.; Jordan, C.; Luczo, T.; Jeffriess, M. Relationship between
unilateral jumping ability and asymmetry on multidirectional speed in team-sport athletes. J. Strength
Cond. Res. 2014, 28, 3557–3566. [CrossRef] [PubMed]
22. Bishop, C.; Read, P.; McCubbine, J.; Turner, A. Vertical and horizontal asymmetries are related to slower
sprinting and jump performance in elite youth female soccer players. J. Strength Cond. Res. 2018, Published
ahead of print. [CrossRef] [PubMed]
23. Dos’Santos, T.; Thomas, C.; Jones, P.; Comfort, P. Asymmetries in single and triple hop are not detrimental to
change of direction speed. J. Trainol. 2017, 6, 35–41. [CrossRef]
24. Impellizzeri, F.; Rampinini, E.; Maffiuletti, N.; Marcora, S. A vertical jump force test for assessing bilateral
strength asymmetry in athletes. Med. Sci. Sports Exerc. 2007, 39, 2044–2050. [CrossRef] [PubMed]
25. Maloney, S. The relationship between asymmetry and athletic performance: A critical review. J. Strength
Cond. Res. 2018, Published ahead of print. [CrossRef] [PubMed]
26. Lake, J.; Mundy, P.; Comfort, P.; Suchomel, T. Do the peak and mean force methods of assessing vertical
jump force asymmetry agree? Sports Biomech. 2018, Published ahead of print. [CrossRef] [PubMed]
27. Maffiuletti, N.; Aagaard, P.; Blazevich, A.; Folland, J.; Tillin, N.; Duchateau, J. Rate of force development:
Physiological and methodological considerations. Eur. J. Appl. Phys. 2016, 116, 1091–1116. [CrossRef]
[PubMed]
28. Owen, N.; Watkins, J.; Kilduff, L.; Bevan, H.; Bennett, M. Development of a criterion method to determine
peak mechanical power output in a countermovement jump. J. Strength Cond. Res. 2014, 28, 1552–1558.
[CrossRef] [PubMed]
29. Chavda, S.; Bromley, T.; Jarvis, P.; Williams, S.; Bishop, C.; Turner, A.; Lake, J.; Mundy, P. Force-time
characteristics of the countermovement jump: Analyzing the curve in Excel. Strength Cond. J. 2018.
(Published ahead of print). [CrossRef]
30. Weir, J. Quantifying test-retest reliability using the intraclass correlation coefficient and SEM. J. Strength
Cond. Res. 2005, 19, 231–240. [PubMed]
31. Koo, T.; Li, M. A guideline of selecting and reporting intraclass correlation coefficients for reliability research.
J. Chiropr. Med. 2016, 15, 155–163. [CrossRef] [PubMed]
32. Atkinson, G.; Neville, A. Statistical methods for assessing measurement error (reliability) in variables relevant
to sports medicine. Sports Med. 1998, 26, 217–238. [CrossRef] [PubMed]
33. Hopkins, W.; Marshall, S.; Batterham, J.; Hanin, J. Progressive statistics for studies in sports medicine and
exercise science. Med. Sci. Sports Exerc. 2009, 41, 3–13. [CrossRef] [PubMed]
34. Cohen, J. A coefficient of agreement for nominal scales. Educ. Psychol. Meas. 1960, 20, 37–46. [CrossRef]
35. Viera, A.; Garrett, J. Understanding the interobserver agreement: The kappa statistic. Fam. Med. 2005, 37,
360–363.
36. Haff, G.; Stone, M.; O’Bryant, H.; Harman, E.; Dinan, C.; Johnson, R.; Han, K.-H. Force-time dependent
characteristics of dynamic and isometric muscle actions. J. Strength Cond. Res. 1997, 11, 269–272.
© 2019 by the authors. Licensee MDPI, Basel, Switzerland. This article is an open access
article distributed under the terms and conditions of the Creative Commons Attribution
(CC BY) license (http://creativecommons.org/licenses/by/4.0/).You can also read