Analysis of the Effect of Daily Water Intake on Oral Health: Result from Seven Waves of a Population-Based Panel Study - MDPI
←
→
Page content transcription
If your browser does not render page correctly, please read the page content below
water
Article
Analysis of the Effect of Daily Water Intake on Oral Health:
Result from Seven Waves of a Population-Based Panel Study
Yu-Rin Kim

                                          Department of Dental Hygiene, Silla University, 140 Baegyang-daero, 700 beon-gil, Sasang-gu,
                                          Busan 46958, Korea; dbfls1712@hanmail.net; Tel.: +82-10-6686-8130

                                          Abstract: Proper moisture is an essential condition for maintaining the homeostasis of the body,
                                          enhancing immunity, and preventing constipation, and it is an indispensable substance for main-
                                          taining human life and health. As the bacteria that cause oral disease are affected by water intake,
                                          there is a strong relationship between water intake and oral disease. Therefore, the purpose of
                                          this study is to determine the effect of daily water intake on oral disease. The data analyzed were
                                          from a seven-year period (2010–2017) from the National Health and Nutrition Survey, conducted
                                          annually by the Korea Centers for Disease Control and Prevention. Out of a total of 48,422 people,
                                          134 people in the ‘7 cups’ group were selected as subjects. Each time a person drank
                                          one less cup of water per day, the prevalence of periodontal disease increased by 1.018 times, the
                                          prevalence of dental caries increased by 1.032 times, and the experience of dental caries increased by
                                          1.075 times. Even in Model 2, for which age and gender were adjusted, there was a significant effect.
                                          In addition, there was a significant impact in Model 3, which adjusted for oral health behavior, except

                                   for permanent caries prevalence. Based on the above results, oral health behavior and state were
                                          positive in those who consumed more water per day. Therefore, it is suggested that the government’s
Citation: Kim, Y.-R. Analysis of the
                                          active promotion of water intake recommendations and policies should be prepared to include water
Effect of Daily Water Intake on Oral
                                          intake as a component of improving oral health.
Health: Result from Seven Waves of a
Population-Based Panel Study. Water
2021, 13, 2716. https://doi.org/          Keywords: habits; oral health; periodontal disease; self-care; water
10.3390/w13192716

Academic Editor: Vincenzo
Romano Spica                              1. Introduction
                                                Water accounts for 60% of an adult’s weight. Roughly 70% of the water is distributed
Received: 19 August 2021                  within the cells, while the rest is distributed outside the cells in the form of epilepsy,
Accepted: 25 September 2021
                                          plasma, lymphatic fluid, and other body fluids [1]. This water transports nutrients and
Published: 1 October 2021
                                          waste products as major components of blood and acts as a solvent for various biochemical
                                          reactions in the body [2]. In addition, it controls body temperature in the form of sweat,
Publisher’s Note: MDPI stays neutral
                                          digests food as a component of various digestive fluids, and acts as a lubricant to smoothly
with regard to jurisdictional claims in
                                          move joints and internal organs in the form of synovial fluid and mucus [3,4]. Water
published maps and institutional affil-
                                          also plays a role in protecting the internal organs and fetus in the cerebrospinal fluid and
iations.
                                          amniotic fluid of pregnant women. Therefore, proper moisture is an essential condition for
                                          maintaining the homeostasis of the body, enhancing immunity, and preventing constipation,
                                          and it is an indispensable substance in maintaining human life and health [5]. When the
                                          balance of water is broken or the body lacks too much water, the human body exhibits
Copyright: © 2021 by the author.          a dehydration reaction. If 2% of the total amount of water in the body decreases, we
Licensee MDPI, Basel, Switzerland.
                                          feel thirst, and if it decreases by 2–4%, muscle fatigue is easily induced, and motor and
This article is an open access article
                                          cognitive functions are reduced. If more than 10% is lost, fatal organ damage and clinical
distributed under the terms and
                                          shock can result and put a life at risk, whereas a loss of more than 15–20% can worsen
conditions of the Creative Commons
                                          dehydration, thereby leading to death [6,7]. Without water, humans can only survive for
Attribution (CC BY) license (https://
                                          2–4 days [5,8,9]; therefore, maintaining adequate moisture is very important. Since 5–10%
creativecommons.org/licenses/by/
4.0/).
                                          of water must be exchanged every day, the amount of water required per day depends on

Water 2021, 13, 2716. https://doi.org/10.3390/w13192716                                                       https://www.mdpi.com/journal/water
Water 2021, 13, 2716 2 of 10
body weight, temperature, activity, and body calorie consumption [10–13]. As such, the
total amount of water intake that must be supplied to our body from the outside is 1–3 L,
thereby indicating a wide range [14,15]. Although it is recommended to consume 30 mL
per kg of body weight [16] or 1 mL of water per kilocalorie [12], the amount of water that
adults consume through water or beverages per day is reported as an average of 2 L [17].
Moreover, as age increases, the intake of water decreases, leading to increased vulnerability
to many diseases [18]. Lack of water can cause systemic problems, as well as various
health-related symptoms in the oral cavity, such as dry mouth, burning in the mouth due
to thirst, or low saliva secretion. If these symptoms persist, it can become an environment
that causes oral disease [19]. Saliva is not only necessary to maintain the normal function of
oral tissues, but also to suppress oral disease occurrence, and if salivary secretion decreases
below normal levels, it can cause oral mucosal diseases and oral diseases. When salivation
is lowered, salivary buffering capacity and saliva pH are lowered, and this can significantly
cause and increase dental caries [20].
Dental diseases are broadly classified into dental caries and periodontal diseases, both
of which are caused by microbial infection. Among more than 500 kinds of bacteria present
in the oral cavity, the microbe that is most closely related to dental caries is Streptococcus
mutans (S. mutans), a decisive causative agent that induces tooth decay by damaging
the hard structure of the teeth [20–22]. Prevotella intermedia (P. intermedia), one of the
major pathogens of periodontal disease, is known to be a powerful causative agent of
adult periodontitis, pregnancy gingivitis, and ulcerative gingivitis [23,24], and it has been
reported to be found in oral lesions [22,23]. These bacteria are affected by the amount
of water intake; the prevalence of P. intermedia, in particular, decreased as the amount of
water intake increased [25]. In Hong’s [20] study, it was reported that less P. intermedia
causing the periodontal disease was detected in the group drinking 3 to 4 glasses of water
per day, and Jung et al. [25] reported that dental caries-causing S. mutans were detected
in the group with the least water intake. However, these differences were not significant
results and need to be re-confirmed. Therefore, it is necessary to evaluate the relationship
between dental caries and periodontal disease according to the amount of water ingested
per day. The majority of studies previously conducted have examined the relationship
between water intake and systemic diseases [3–9] and on water intake relationships in the
elderly [18,25]. Furthermore, there are few studies on the relationship between oral health
behavior and oral health state in all age groups. Therefore, this study aims to compare
demographic characteristics, oral health behaviors, and oral health state according to the
amount of water intake by using the 7-year data from the National Health and Nutrition
Survey, which represents the Korean people, and identify the substantial impact of water
intake on periodontal disease and dental caries in order to use the results as fundamental
data confirming the importance of water intake.
2. Materials and Methods
2.1. Study Design
Data for seven years (2010–2017) from the National Health and Nutrition Survey
conducted annually by the Korea Centers for Disease Control and Prevention were ana-
lyzed. Before analyzing the panel survey, we accounted for varying sample sizes from
2010 to 2017 and missing values of variables to ensure a balanced dataset. The National
Health and Nutrition Survey is a government-designated, statistics-driven study based
on Article 17 of the Statistics Act (approval no. 117002). In the 5th round, the 1st year
survey is 2010-02CON-21-C, the 2nd year survey is 2013-12EXP-03-5C, and the 3rd year
survey is 2012-01EXP-01-2C. In the 6th round, the 1st year survey is 2013-07CON-03-4C,
and the second year survey is 2013-12EXP-03-5C. In the 3rd year, the survey was conducted
without deliberation by the Research Ethics Review Committee, as it corresponds to the
research conducted by the State for public welfare directly pursuant to Subparagraph 1 of
Article 2 (2).conducted by the State for public welfare directly pursuant to Subparagraph 1 of A
2 (2).
Water 2021, 13, 2716 3 of 10
2.2. Study Population
The sampling was performed using a two-stage, stratified, cluster extraction m
2.2. Study Population
with probability proportionality. Of the total 64,758, 48,422 people were selected, ex
The sampling was performed using a two-stage, stratified, cluster extraction method
ing those who were taking medication, those with systemic diseases, and smoker
with probability proportionality. Of the total 64,758, 48,422 people were selected, excluding
pending
those who onwere
the taking
intakemedication,
of water,those
134 with
people in the
systemic ‘7 cups’
were classified. There were no other ingredients added to the water, and the standa group were
classified. There were no other ingredients added to the water, and the standard for 1 cup
1 cup is 200 mL (See Figure 1).
is 200 mL (See Figure 1).
Figure 1. The flow of sample selection in this study.
Figure 1. The flow of sample selection in this study.
2.3. Variables
2.3.1.
2.3. Dependent Variables
Variables
We identified demographic characteristics, oral health behaviors, and oral health
2.3.1. Dependent Variables
status as key dependent variables. Demographic characteristics considered were survey
year,We identified
gender, demographic
age, marital characteristics,
status, education, economy, andoralincome,
health confirmed
behaviors, andthe
using oral heal
tushealth survey
as key from the National
dependent Health Demographic
variables. and Nutrition Survey. Economy wasconsidered
characteristics classified into were s
‘currently
year, employed’
gender, or ‘unemployed’,
age, marital and income was
status, education, classifiedand
economy, into income,
‘low’, ‘middle-low’,
confirmed usin
‘middle’, ’middle-high’, and ‘high’. In the oral health behavior section, toothbrushing
health survey from
time consisted the and
of 9 items, National
the useHealth and Nutrition
of oral health Survey.
products consisted of Economy
5 items, with was clas
into ‘currently
1 for yes and 0 employed’ or ‘unemployed’,
for no. The dental and income
treatment consisted was
of 9 items, classified
with 1 for the into ‘low’, ‘m
case of
low’, ‘middle’,
receiving ’middle-high’,
treatment andof‘high’.
and 0 for the case In the treatment.
not receiving oral health behavior
To consider section,
oral health toothb
ing time consisted of 9 items, and the use of oral health products consistedyes
status, chewing inconvenience and experience in toothache were checked, with 1 for of 5 items
1 for yes and 0 for no. The dental treatment consisted of 9 items, with 1 for the c
receiving treatment and 0 for the case of not receiving treatment. To consider oral
status, chewing inconvenience and experience in toothache were checked, with 1 fWater 2021, 13, 2716 4 of 10
and 0 for no. Speech problems and chewing problems were measured on a 5-point scale;
the higher the score, the less serious the problem. Self-oral health consciousness was also
measured on a 5-point scale on which the lower the score, the better. Dental caries and
periodontal disease were directly examined by a public health dentist in the province at a
mobile examination center. A subject was recorded as having periodontal disease if their
periodontal pocket was more than 3 mm deep using a probe. Permanent tooth caries and
experience of permanent tooth caries were recorded by checking tooth caries using explorer.
The presence of the disease was marked as 1, and the absence of the disease was marked
as 0.
2.3.2. Independent Variables
We divided the population into three categories to determine their water intake. In
the KNHNS, respondents were asked the question, ‘How much water (mineral water) do
you drink per day?’ The unit was measured as ‘cup (200 mL)’, and it was divided into
4 groups as ‘7 cups’ according to water intake.
2.4. Statistical Analyses
Data analysis was conducted using IBM SPSS ver. 21.0 (IBM Co., Armonk, NY, USA),
and complex sampling analysis with stratification variables, colony variables, and weights
assigned was applied to all analyses. The comparison of demographic characteristics and
oral health behaviors according to 134 people in the ‘7 cups’
group was conducted using a complex sample chi-squared test. Logistic regression analysis
and linear regression analysis were performed in order to determine the effect of daily
water intake on oral health, and ‘Don’t Know’, ‘Not Applicable’, and ‘Missing Values’ in 8,
9, 88, and 99 were all excluded. Factors affecting the results of regression analysis were
identified and analyzed with three models (Model 1: crude model; Model 2: adjusted for
age and gender; Model 3: adjusted for oral health behavior). The number of subjects in
all tables was presented with an unweighted frequency, and the significance level of the
statistical test was set to 0.05.
3. Results
3.1. Demographic Characteristics According to Daily Water Intake
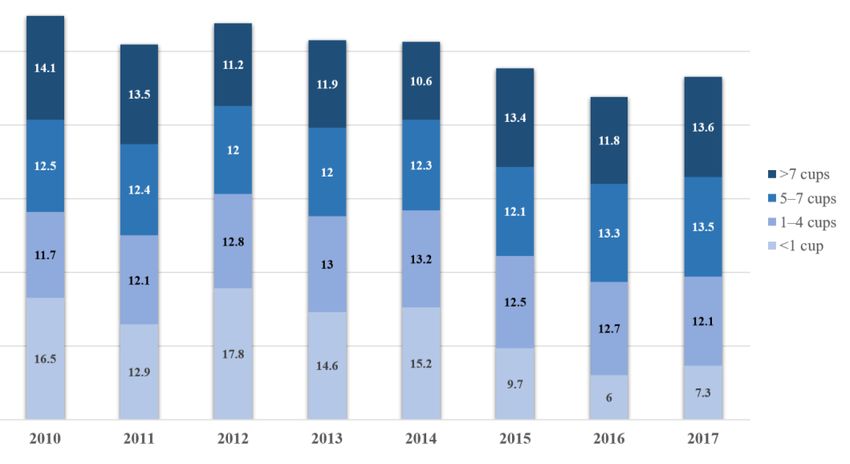
The ratio of the ‘7 cups’ group was highest in 2010 (Figure 2). In the ‘7 cups’ group, the ratio of ‘21–40 years old’ was higher, and in the ‘1–4 cups’ group
and ‘5–7 cups’ group, the ratio of ‘41–60 years old’ was higher. In the ‘7 cups’ group, the ratio of men was higher than that of women.
As for marital status, the ratio of married people was higher in all groups. In the ‘7 cups’ group, middle-low income was highest. In the ‘1–4 cups’ group,
low income was highest, and in the ‘5–7 cups’ group, middle income was highest. As for
education, in the ‘7 cups’ groups,
high school graduate was highest. In terms of economic activities, employed was higher
than currently unemployed regardless of the group. There were significant differences in
all items of demographic characteristics (Table 1) (p < 0.05).OR PEER REVIEW 5 of 10
Water 2021, 13, 2716 5 of 10
Figure 2. Percentage of daily water intake by year (%).
Figure 2. Percentage of daily water intake by year (%).
Table 1. Demographic characteristics according to daily water intake N (%).
Table 1. Demographic characteristics according to daily water intake N (%).
7 Cups
p
(N = 134) (N = 27,223) (N = 14,693) (N = 6372)
7 Cups
Age ≤20 21 (15.7) 7879 (26.1) 2772 (17.0) 1037 (14.7) p 0.000
134) 21–40 27,223)
34 (38.2)
14,693)
5048 (26.2)
(N = 6372) 1869 (38.7)
3300 (31.1)
≤20 21 (15.7)41–60 35 (27.0)
7879 (26.1) 6758(17.0)
2772 (28.8) 46541037
(35.1) (14.7) 2159 (35.1) 0.000
≥61 44 (19.1) 7538 (18.8) 3769 (16.8) 1307 (11.5)
21–40 Gender 34 (38.2)Male 5048 (26.2)
57 (46.0) 3300
10,189(31.1)
(42.0) 69351869
(54.6) (38.7) 3746 (66.2) 0.000
Female 77 (54.0) 17,034 (58.0) 7758 (45.4) 2626 (33.8)
41–60 35 (27.0) 6758 (28.8) 4654 (35.1) 2159 (35.1)
Married Single 42 (42.7) 9910 (39.3) 4149 (32.6) 1929 (36.3) 0.000
≥61 44 (19.1)
Married 7538 (18.8)
92 (57.3) 3769
17,271(16.8)
(60.7) 10,5311307
(67.4)(11.5) 4435 (63.7)
Male Income 57 (46.0)Low 23 (20.4)
10,189 (42.0) 5424(54.6)
6935 (21.2) 27373746
(19.9) (66.2) 1263 (20.5) 0.000 0.031
Middle-low 34 (25.7) 5567 (20.7) 2867 (20.0) 1271 (20.7)
Female 77 (54.0)
Middle 17,034 (58.0)
25 (17.5) 7758
5358(45.4)
(19.7) 30272626
(20.5) (33.8) 1249 (19.3)
Middle-high 27 (18.5) 5484 (19.8) 2939 (19.6) 1254 (19.6)
Single 42 (42.7)High 9910 (39.3)
22 (17.9) 4149
5170(32.6)
(18.7) 30241929
(20.1) (36.3) 1296 (19,9) 0.000
Married
Education 92 (57.3) 17,271 (60.7)
Elementary school 37 (19.9) 10,531
12,089 (67.4)
(35.8) 47004435
(24.0) (63.7) 1485 (16.7) 0.000
Middle school 17 (15.0) 2666 (11.1) 1670 (12.0) 807 (12.5)
Low 23 (20.4)
High school 5424 (21.2)
25 (25.6) 2737
5554(19.9)
(26.5) 39281263
(34.0) (20.5) 2017 (37.8) 0.031
University 43 (39.5) 5612 (26.6) 3725 (31.2) 1775 (33.1)
Middle-low 34 (25.7) 5567 (20.7) 2867 (20.0) 1271 (20.7)
Economic activity Employed 65 (61.2) 10,041 (55.2) 6818 (62.0) 3468 (67.0) 0.000
Middle 25 (17.5)
Unemployed 5358 (19.7)
47 (38.8) 3027
9475(20.5)
(44.8) 51491249
(38.0) (19.3) 1999 (33.0)
Note: By complex sample chi-square test, p < 0.05.
Middle-high 27 (18.5) 5484 (19.8) 2939 (19.6) 1254 (19.6)
High 22 (17.9) 3.2. Oral5170 (18.7)
Health 3024to(20.1)
Behavior According 1296 (19,9)
Daily Water Intake
Elementary In terms of toothbrushing, brushing before dinner and before going to bed was highest
37 (19.9) in the ‘7 cups’ group. There were significant differences
17 (15.0) in all items.
2666As(11.1)
for the use of1670 (12.0) products, the
oral health 807use
(12.5)
of electric toothbrushes was
school
highest in the ‘Water 2021, 13, 2716 6 of 10
‘>7 cups’ group; there were significant differences in all items except for the use of oral
health products. In dental treatment, simple caries treatment and prosthetic treatment
were highest in the ‘7 cups’ group. There were
significant differences in all items except went to the dentist, oral examination, simple
caries treatment, trauma treatment, and prosthetic treatment (Table 2) (p < 0.05).
Table 2. Oral health behavior according to daily water intake N (%).
7 Cups p
I brushed my teeth yesterday. (N = 45,858) 119 (98.2) 25,635 (98.0) 14,010 (98.9) 6094 (99.0) 0.000
I brushed my teeth before breakfast. (N = 12,762) 35 (31.2) 6698 (29.2) 4057 (31.3) 1972 (35.0) 0.000
I brushed my teeth after breakfast. (N = 31,825) 74 (61.2) 17,637 (65.9) 9936 (68.0) 4178 (65.1) 0.037
I brushed my teeth before lunch. (N = 589) 2 (1.3) 286 (1.2) 196 (1.3) 105 (1.8) 0.002
Toothbrushing I brushed my teeth after lunch. (N = 20,774) 54 (46.3) 11,373 (45.1) 6517 (47.4) 2830 (47.3) 0.000
I brushed my teeth before dinner. (N = 1012) 4 (3.6) 490 (2.1) 323 (2.4) 195 (3.3) 0.000
I brushed my teeth after dinner. (N = 27,191) 59 (49.5) 14,533 (56.0) 8771 (61.9) 3828 (61.8) 0.000
I brushed my teeth after a snack. (N = 1252) 1 (0.8) 624 (2.5) 424 (3.0) 203 (3.2) 0.002
I brushed my teeth before going to bed. (N = 18,974) 52 (45.0) 10,696 (44.2) 5596 (42.4) 2630 (45.7) 0.000
Use of oral health products (N = 2659) 7 (18.7) 1292 (22.8) 911 (25.3) 449 (23.8) 0.131
Use of floss (N = 7013) 16 (24.0) 3536 (21.6) 2344 (23.7) 1117 (25.1) 0.000
Oral health
Use of interdental brush (N = 6230) 8 (6.9) 3095 (18.1) 2098 (20.3) 1029 (22.3) 0.000
products
Use of mouthwash (N = 6184) 11 (12.6) 3008 (17.9) 2182 (21.4) 983 (20.9) 0.000
Use of electric toothbrush (N = 1758) 9 (10.8) 862 (5.2) 576 (5.8) 311 (6.8) 0.000
I went to the dentist. (N = 19,279) 44 (39.8) 10,685 (40.9) 6027 (42.3) 2523 (40.6) 0.092
I had an oral examination. (N = 14,173) 27 (65.2) 7852 (73.3) 4449 (74.3) 1845 (73.5) 0.374
I had periodontal treatment. (N = 3403) 5 (8.5) 1693 (15.7) 1196 (19.5) 509 (18.9) 0.000
Dental
I had simple caries treatment. (N = 5892) 13 (36.7) 3345 (31.6) 1784 (30.9) 750 (29.8) 0.383
Treatment
I had pulp treatment. (N = 3348) 5 (15.2) 1763 (16.8) 1091 (19.1) 489 (19.2) 0.010
(within the last
I had oral health care. (N = 7225) 12 (33.2) 3760 (37.5) 2401 (42.3) 1052 (43.8) 0.000
year)
I had surgical treatment. (N = 2343) 5 (16.9) 1201 (11.7) 776 (13.1) 361 (14.9) 0.000
I had trauma treatment. (N = 416) 1 (2.7) 226 (2.3) 119 (2.2) 70 (2.8) 0.364
I had prosthetic treatment. (N = 3972) 12 (20.2) 2158 (18.3) 1284 (19.6) 518 (18.3) 0.250
Note: By complex sample chi-square test, p < 0.05.
3.3. Oral Health Status According to Daily Water Intake
Chewing inconvenience was highest in the ‘1–4 cups’ group, and the experience in
toothache was highest in the ‘7 cups’ group, and self-oral health consciousness was worst
in the ‘Water 2021, 13, 2716 7 of 10
Table 3. Oral health status according to daily water intake N(%).
7 Cups p
Chewing inconvenience (N = 9222) 22 (21.2) 5148 (22.8) 2833 (20.8) 1219 (19.8) 0.000
Experience in toothache (N = 10,197) 37 (35.1) 5551 (30.4) 3180 (32.7) 1429 (32.7) 0.008
Oral health † Speech problem 4.26 ± 0.01 4.33 ± 0.01 4.40 ± 0.01 4.45 ± 0.01 0.000
status † Chewing problem 3.74 ± 0.13 3.70 ± 0.01 3.78 ± 0.01 3.85 ± 0.02 0.000
† Self-oral health consciousness 3.34 ± 0.10 3.28 ± 0.01 3.29 ± 0.01 3.33 ± 0.02 0.032
−
\ Oral disease Prevalence of periodontal disease Permanent caries prevalence Permanent caries experience
OR (95% CI) p OR (95% CI) p OR (95% CI) p
1.032 1.075
Model 1 1.018 (1.006~1.029) 0.002 0.000 0.000
(1.023~1.041) (1.062~1.089)
1.022 1.060
Model 2 1.018 (1.006~1.029) 0.003 0.000 0.000
(1.013~1.032) (1.046~1.073)
1.001 0.952
Model 3 1.097 (1.017~1.184) 0.017 0.947 0.032
(0.970~1.033) (0.911~0.996)
Note: By complex sample chi-square test, † by complex sample linear regression analysis, −\ by complex sample logistic regression analysis,
Model 1: crude model, Model 2: adjusted for age and gender, Model 3: adjusted for oral health behavior.
4. Discussion
As interest in immunity increases following the COVID-19 pandemic, interest in the
effect of water intake on immune function and systemic diseases is growing [26]. Recently,
it has been suggested that mild dehydration can lead to changes in various cognitive
functions, such as concentration, arousal, and short-term memory [27]. On the other
hand, Benton [28] argued that there are very few studies on the effect of dehydration
on cognitive function, and confounding factors such as fatigue and body temperature
related to dehydration are not well controlled, thereby making it difficult to draw a definite
conclusion. While studies on water, systemic diseases, and mental disorders continue,
studies confirming the relationship between water and oral disease are mostly those related
to bacteria [25] and those limited to the elderly [18,25]. For this reason, it is necessary to
expand these studies; as such, this study expanded and investigated subjects by using the
data from the National Health and Nutrition Survey representing Korea and analyzed the
relationship between water and oral disease through the data from 2010 to 2017.
Women’s water intake was lower than that of men, which is the same result reported
in studies conducted in the US and Canada [29–31] and is theorized to be a complex result
influenced by female hormones [32]. Differences in water intake according to gender are
an area requiring further research. In addition, it is necessary to consider socioeconomic
aspects to increase water intake, as the water intake was lower in high-income, education,
and unemployed states.
In regard to toothbrushing among the oral health behaviors, water intake was high
in all groups except for before dinner and before going to bed and was also high in all
groups using oral health products except for the use of electric toothbrushes in which
water intake was high. This indicates that oral health behavior is good in the group that
consumes more water per day, which is consistent with the study of Nam et al. [19] that
water intake behavior and oral care behavior are related. However, there is no relationship
between tongue brushing, the number of brushings, brushing time, and the use of auxiliary
oral hygiene products among oral health behaviors; as a result, further research is deemed
necessary. In addition, it was found that the group with high water intake received
relatively simple treatments and preventive treatments, and the group with low water
intake received more serious treatments. It is theorized that people receive more treatment
to maintain and promote oral health due to a higher degree of interest in health, including
water intake.
In the oral health status section, the group who consumed less water per day experi-
enced a high incidence of toothache and perceived that they had bad oral health status. In
addition, the group with high water intake had no speech problems, chewing problems,Water 2021, 13, 2716 8 of 10
or chewing inconvenience. As such, it was confirmed that oral health and water intake
are highly related, as oral health problems were low in the group who consumed more
water per day. In fact, the prevalence of periodontal disease increased by 1.018 times, the
prevalence of dental caries increased by 1.032 times, and the experience of dental caries
increased by 1.075 times each time a person drank one less cup of water per day. Although
this was analyzed by adjusting for age, gender, and oral health behavior affecting water
intake and oral disease, the result was found to be significant, thereby confirming the
importance of water intake for oral disease.
Since dental caries and periodontal disease are multifactorial diseases in which several
factors act in combination, water intake cannot be limited as the cause of increasing or
decreasing the likelihood of oral disease. In addition, periodontal disease was diagnosed
when the depth of the periodontal pocket was 3 mm or more in the examination for
the prevalence of periodontal disease investigated in the National Health and Nutrition
Examination Survey. This can lead to overdiagnosis if the depth of the periodontal pocket
is 3 mm in the case of prosthetic teeth or implants that are not natural teeth. Nevertheless, it
has been confirmed that water intake is highly related to oral diseases, and so it is thought
that a recommended intake of water should be included in dietary guidelines to prevent
oral diseases considering the importance of water intake. A limitation of this study is
that only associations, not causal relationships, can be drawn from the results owing to
its cross-sectional design, where investigations are restricted to a certain point within a
short window of time. Another limitation is that there are very few previous studies on
water intake and oral health behaviors and state for all age groups, so it was somewhat
difficult to compare and interpret the results of this study. A final limitation was that we
did not consider other sources of hydration (e.g., from other drinks and liquid foods, as
well as environmental (micro)/climatic conditions and lifestyles related to hydration, such
as humidity and temperature, physical activity, sport, drugs, water fluoridation area, eating
habits, etc.) that could influence the results of this study. Therefore, additional research
considering the various water sources of the subject is required. Despite these limitations,
it is meaningful that this study was analyzed through representative data of the National
Health and Nutrition Examination Survey to motivate Koreans regarding water intake.
Moreover, this study is significant in providing data that can be used for direction setting
when establishing policies or business plans for the recommendation of water intake at the
national level. The relationship between water intake and oral health requires further and
continuous research, and follow-up studies to establish standards of proper water intake in
order to lower oral disease are necessary.
5. Conclusions
Based on the above results, people who consumed more water were at lower risk of
dental caries and periodontal disease. Additionally, people who consumed more water
were at lower risk of poor oral health status. Therefore, it is concluded that the govern-
ment’s active promotion of water intake recommendations and policies should be prepared
to include water intake as important in support of improved oral health.
Funding: This research received no specific grant from funding agencies in the public, commercial,
or not-for-profit sectors.
Institutional Review Board Statement: The study was conducted according to the guidelines of the
Declaration of Helsinki, and approved by the Institutional Review Board (In the 5th round, the 1st
year survey is 2010-02CON-21-C, the 2nd year survey is 2013-12EXP-03-5C, and the 3rd year survey
is 2012-01EXP-01-2C. In the 6th round, the 1st year survey is 2013-07CON-03-4C, and the 2nd year
survey is 2013-12EXP-03-5C. In the 3rd year, the survey was conducted without deliberation by the
Research Ethics Review Committee, as it corresponds to the research conducted by the State for
public welfare directly pursuant to Subparagraph 1 of Article 2 (2).).
Informed Consent Statement: Informed consent was obtained from all subjects involved in the study.
Acknowledgments: This study used the KNHANES data.Water 2021, 13, 2716 9 of 10
Conflicts of Interest: The authors declare no conflict of interest.
References
1. Jéquier, E.; Constant, F. Water as an essential nutrient: The physiological basis of hydration. Eur. J. Clin. Nutr. 2010, 64, 115–123.
[CrossRef]
2. Perrier, E.; Vergne, S.; Klein, A.; Poupin, M.; Rondeau, P.; Le Bellego, L.; Armstrong, L.E.; Lang, F.; Stookey, J.; Tack, I. Hydration
biomarkers in free-living adults with different levels of habitual fluid consumption. Br. J. Nutr. 2013, 109, 1678–1687. [CrossRef]
3. Lee, J.S. The effects of gender, obesity rate, nutrition knowledge and dietary attitude on the dietary self-efficacy on adolescents.
Korean J. Community Nutr. 2003, 8, 652–657.
4. Swallow, J.A. Quantitative study of enamel dissolution under conditions of controlled hydrodynamics. J. Dent. Res.
1997, 56, 524–530. [CrossRef]
5. Verbalis, J.G. Disorders of body water homeostasis. Best Pract. Res. Clin. Endocrinol. Metab. 2003, 17, 471–503. [CrossRef]
6. EFSA Panel on Dietetic Products, Nutrition, Allergies. Scientific opinion on dietary reference values for water. EFSA J.
2010, 8, 1459.
7. Hillyer, M.; Menon, K.; Singh, R. The effects of dehydration on skill-based performance. Int. J. Sports Sci. 2015, 5, 99–107.
[CrossRef]
8. Daniels, M.C.; Popkin, B.M. Impact of water intake on energy intake and weight status: A systematic review. Nutr. Rev.
2010, 68, 505–521. [CrossRef] [PubMed]
9. Ruth, J.L.; Wassner, S.J. Body composition: Salt and water. Pediatr. Rev. 2006, 27, 181–187. [CrossRef]
10. Committee on Nutrition and the Council on Sports Medicine and Fitness. Sports drinks and energy drinks for children and
adolescents: Are they appropriate? Pediatrics. 2011, 127, 1182–1189. [CrossRef] [PubMed]
11. Sawka, M.N.; Latzka, W.A.; Matott, R.P.; Montain, S.J. Hydration effects on temperature regulation. Int. J. Sports Med.
1998, 19, S108–S110. [CrossRef] [PubMed]
12. Sawka, M.N.; Cheuvront, S.N.; Carter, R. Human water needs. Nutr. Rev. 2005, 63, S30–S39. [CrossRef] [PubMed]
13. Raman, A.; Schoeller, D.A.; Subar, A.F.; Troiano, R.; Schatzkin, A.; Harris, T.; Bauer, D.; Bingham, S.A.; Everhart, J.E.; Newman,
A.B.; et al. Water turnover in 458 American adults 40–79 yr of age. Am. J. Physiol. Renal Physiol. 2004, 286, F394–F401. [CrossRef]
[PubMed]
14. Food and Nutrition Board, Institute of Medicine. Dietary Reference Intakes for Water, Potassium, Sodium, Chloride, and Sulfate (the
US/Canada); Panel on Dietary Reference Intakes for Electrolytes and Water; The National Academies Press: Washington DC, USA,
2005; pp. 1–616. [CrossRef]
15. Chidester, J.; Spangler, A. Fluid intake in the institutionalized elderly. J. Am. Diet Assoc. 1997, 97, 23–28. [CrossRef]
16. Feddes, J.J.; Emmanuel, E.J.; Zuidhoft, M.J. Broiler performance, body weight variance, feed and water intake, and carcass quality
at different stocking densities. Poultry Sci. 2002, 81, 774–779. [CrossRef]
17. Pêgo, C.; Guelinckx, I.; A Moreno, L.; Kavouras, S.; Gandy, J.J.; Martinez, H.; Bardosono, S.; Abdollahi, M.; Nasseri, E.;
Jarosz, A.; et al. Total fluid intake and its determinants: Cross-sectional surveys among adults in 13 countries worldwide. Eur. J.
Nutr. 2015, 54, 35–43. [CrossRef]
18. Armstrong-Esther, C.; Browne, K.; Armstrong-Esther, D.; Sander, L. The institutionalized elderly: Dry to the bone! Int. J. Nurs.
Stud. 1996, 33, 619–628. [CrossRef]
19. Nam, J.Y.; Kim, H.J.; Park, S.M.; Choi, S.H.; Jeon, H.I.; Kim, M.J.; Lee, M.K. The influence of water drinking on oral management
behavior and bad breath in college students. AJMAHS 2017, 7, 421–429. [CrossRef]
20. Hong, M.H. Study on detection of oral bacteria in the saliva and risk factors of adults. JKAIS 2014, 15, 5675–5682. [CrossRef]
21. Kang, K.H.; Kim, Y.K.; Lee, H.S.; Jin, I. Analysis of gene expression in response to acid stress of streptococcus mutans Isolated
from a Korean child. JKAIS 2009, 10, 2990–2996. [CrossRef]
22. Sofia, D.F.; Marika, B.; Arthur, C.O. Streptococcus mutans, caries and simulation models. Nutriens 2010, 2, 290–298. [CrossRef]
23. Park, S.N.; Kook, J.K. Development of quantitative real-time PCR primers for detection of development prevotella intermedia.
Int. J. Oral Biol. 2015, 40, 205–210. [CrossRef]
24. Peck, S.Y.; Ku, Y.; Rhyu, I.C.; Hahm, B.D.; Han, S.B.; Choi, S.M.; Chung, C.P. The frequency of detecting prevotella intermedia and
prevotella nigrescens in Korean adult periodontitis patients. J. Periodontal Implant Sci. 2000, 30, 419–429. [CrossRef]
25. Joung, H.Y.; Choi, Y.; Choe, H.J.; Jung, I.H. A Convergence study of Water intake on relationship between Xerostomia, Halitosis,
Oral microorganisms in the Elderly. J. Korea Converg. Soc. 2019, 10, 309–316. [CrossRef]
26. Paik, I.Y.; Yun, D.S.; Suh, S.H.; Roh, H.T. Effects of Different Fluid Replacements during Exercise in High Ambient Temperature
on Inflammatory Cytokine Responses and Immune Function in Elite Athletes. KJSS 2011, 22, 2076–2087. [CrossRef]
27. Popkin, B.M.; D’Anci, K.E.; Rosenberg, I.H. Water, hydration, and health. Nutr. Rev. 2010, 68, 439–458. [CrossRef]
28. Benton, D. Dehydration influences mood and cognition: A plausible hypothesis? Nutrients 2011, 3, 555–573. [CrossRef] [PubMed]
29. Kant, A.K.; Graubard, B.I.; Atchison, E.A. Intakes of plain water, moisture in foods and beverages, and total water in the adult
US population—Nutritional, meal pattern, and body weight correlates: National Health and Nutrition Examination Surveys
1999–2006. Am. J. Clin. Nutr. 2009, 90, 655–663. [CrossRef] [PubMed]
30. Park, S.; Sherry, B.; O’Toole, T.; Huang, Y. Factors associated with low drinking water intake among adolescents: The Florida
Youth Physical Activity and Nutrition Survey, 2007. J. Am. Diet Assoc. 2011, 111, 1211–1217. [CrossRef] [PubMed]Water 2021, 13, 2716 10 of 10
31. Pintar, K.D.M.; Waltner-Toews, D.; Charron, D.; Pollari, F.; Fazil, A.; McEwen, S.A.; Nesbitt, A.; Majowicz, S. Water consumption
habits of a south-western Ontario community. J. Water Health 2009, 7, 276–292. [CrossRef] [PubMed]
32. Stachenfeld, N.S. Hormonal changes during menopause and the impact on fluid regulation. Reprod. Sci. 2014, 21, 555–561.
[CrossRef] [PubMed]You can also read