Facebook Friends? - Shorenstein Center
←
→
Page content transcription
If your browser does not render page correctly, please read the page content below

Facebook Friends?
    The Impact of Facebook’s News Feed Algorithm
          Changes on Nonprofit Publishers

                 Andrew Gruen1* and Aisha Townes2
1 Research fellow at the Shorenstein Center on Media, Politics and Public Policy;
            principal consultant, Working Paper, ag@workingpaper.co
2 Data science consultant to the Shorenstein Center on Media, Politics and Public

                                       Policy
                              * Corresponding author

                             October 16, 2018

                                       1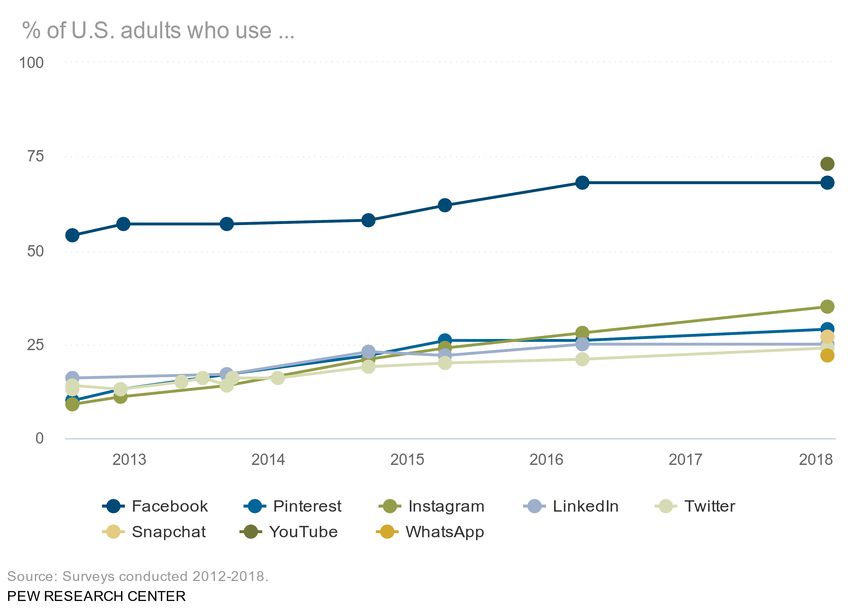
Contents
1 Introduction                                                                                      4
  1.1 Background . . . . . . . . . . . . . . . .   .   .   .   .   .   .   .   .   .   .   .   .    4
  1.2 January 2018 Changes . . . . . . . . . .     .   .   .   .   .   .   .   .   .   .   .   .    6
  1.3 Anecdotal Reports of Traffic Reductions      .   .   .   .   .   .   .   .   .   .   .   .    6
  1.4 Research Question . . . . . . . . . . . .    .   .   .   .   .   .   .   .   .   .   .   .    8

2 Methods                                                                                           8
  2.1 Cohort . . . . . . . . . . . . . . . . . . . . . .       .   .   .   .   .   .   .   .   .    8
  2.2 Data Sources . . . . . . . . . . . . . . . . . .         .   .   .   .   .   .   .   .   .    9
      2.2.1 Key Metrics: Sessions and Users . . . .            .   .   .   .   .   .   .   .   .   11
      2.2.2 A Note on Data from Google Analytics               .   .   .   .   .   .   .   .   .   12

3 Results                                                                12
  3.1 Traffic Sources in Context . . . . . . . . . . . . . . . . . . . . 12
  3.2 Facebook Referral Data . . . . . . . . . . . . . . . . . . . . . 14

4 Conclusions and Future Research                                                                  18

References                                                                                         20

List of Figures
   1    Top Social Media Usage in the U.S. . . . . . . . . . .                 .   .   .   .   . 5
   2    Facebook Referrals to Slate and Talking Points Memo                    .   .   .   .   . 7
   3    Google Analytics Sessions . . . . . . . . . . . . . . .                .   .   .   .   . 11
   4    Change in Traffic Sources by Users . . . . . . . . . .                 .   .   .   .   . 16
   5    Change in Traffic Sources by Sessions . . . . . . . . .                .   .   .   .   . 17

List of Tables
   1    Organizations in the Cohort . . . . . . . . . . . . . . .                  .   .   .   .    9
   2    Change in Total Users and Sessions . . . . . . . . . . .                   .   .   .   .   13
   3    Percentage Change in Each Google Analytics Channel .                       .   .   .   .   14
   4    Change in Facebook Referred Users and Sessions . . . .                     .   .   .   .   15
   5    Owned Traffic versus Traffic from Tech Platforms . . .                     .   .   .   .   19

                                     2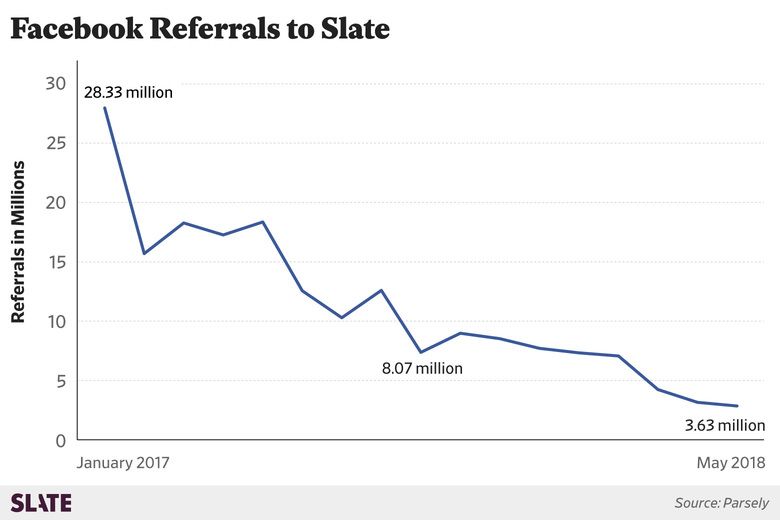
Abstract
    This paper analyzes the changes in traffic from Facebook to non-
profit news organizations before and after the major change to the
Facebook News Feed in January 2018, implemented in response to
the controversy over fake news dissemination from Russian meddling
in the 2016 presidential election in the United States. We find that
while the organizations in our cohort generally experienced a decline in
referral traffic from Facebook, it was more varied than the declines re-
ported among larger, commercial press outlets that released their own
Facebook referral data. We speculate that the variation and lower
overall decline may be due to how nonprofit news organizations’ sto-
ries are shared on Facebook. Further, we suggest additional research
into both the best practices of Facebook sharing for nonprofit news
organizations and how they can siphon additional control of their con-
tent distribution from third-party technology platforms to their own.

                                   3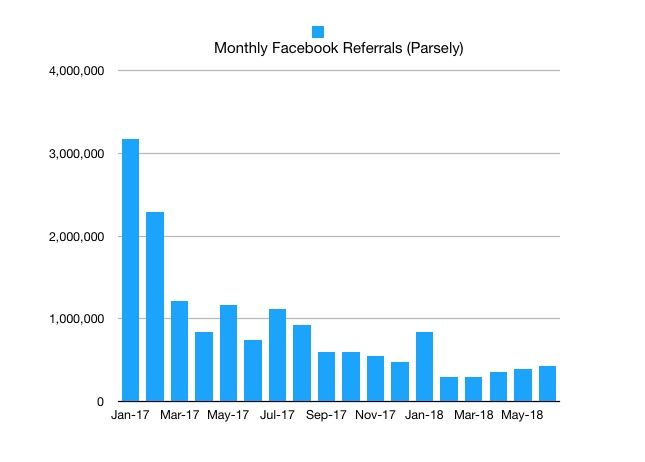
1     Introduction
In 2006, Facebook created a new product that would profoundly alter the
news-consuming habits of many, shift how news organizations thought about
distributing digital content, and even influence the course of elections and
modern democracy. The company introduced the “News Feed,” as a central
place where a user could see all the changes that had happened on the social
network while they had been away (Sanghvi 2006). It began with updates
such as who had become friends with whom, which groups users had joined,
or (always popular with college students) who had changed their relation-
ship status. As Slate’s senior technology reporter Will Oremus put it, the
News Feed was “a hub for updates about your friends’ activities on the site”
(Oremus 2016).

1.1    Background
As the product grew, more content appeared in the News Feed, including ma-
terial which had been posted by organizations (Murphy 2013). In addition
to incorporating more posts from more places in its News Feed, Facebook
also developed new ways to determine how to rank and display them (Ore-
mus 2016). The most important “signal” that Facebook engineers used to
determine the value of a given post was the then-new (2009) “like” button,
which users could click if they, well, liked a status update by a friend or a
story from a publisher. Oremus explained:

      The like button wasn’t just a new way for users to interact on the site.
      It was a way for Facebook to enlist its users in solving the problem of
      how best to filter their own news feeds. That users didn’t realize they
      were doing this was perhaps the most ingenious part. If Facebook had
      told users they had to rank and review their friends’ posts to help the
      company determine how many other people should see them, we would
      have found the process tedious and distracting. Facebook’s news feed
      algorithm was one of the first to surreptitiously enlist users in per-
      sonalizing their experience—and influencing everyone else’s (Oremus
      2016).1

  1. For more on how the News Feed itself works, and how it was developed, Oremus’s
2016 piece for Slate is highly instructive.

                                         4
Figure 1: Top social media usage in the U.S. as measured by Pew (Demo-
graphics of Social Media Users and Adoption in the United States 2018).
When Facebook expanded from a network for college students to one
of the largest social networks [see Figure 1 for U.S. social media usage over
time (Demographics of Social Media Users and Adoption in the United States
2018)], news organizations discovered they could use it to grow their audi-
ences. Indeed, social sharing of news, particularly on Facebook, became so
popular that it shifted how news sites were built. For example, organizations
realized that most traffic came “in the side door” and started adding links
to related or new stories at the bottom of a page, almost as if creating a
miniature home page (Seward 2014).
As Facebook continued to optimize its News Feed for posts that people
liked or clicked, etc., and news organizations continued to optimize their own
posts for traffic (clicks) from that feed, Facebook became an exceptionally
valuable source of traffic for many publishers. As The New York Times Mag-
azine’s John Herrman summarized in his profile “Inside Facebook’s (Totally
Insane, Unintentionally Gigantic, Hyperpartisan) Political-Media Machine”:
Facebook, from a publisher’s perspective, had seized the web’s means
of distribution by popular demand. A new reality set in, as a social-
media network became an intermediary between publishers and their
audiences. For media companies, the ability to reach an audience is
5fundamentally altered, made greater in some ways and in others more
challenging. For a dedicated Facebook user, a vast array of sources,
spanning multiple media and industries, is now processed through the
same interface and sorting mechanism, alongside updates from friends,
family, brands and celebrities (Herrman 2016).
Those other updates, from non-news entities masquerading as news or-
ganizations, were at the very moment of that profile, a significant and still
sub-rosa problem for Facebook.
1.2 January 2018 Changes
In the wake of the 2016 presidential election in the U.S., it came to light that
Russian government entities had used Facebook and posts in users’ News
Feeds to sow discord and disinformation in and among the American elec-
torate in an explicit attempt to influence its outcome (Isaac and Wakabayashi
2017). As a result, and under extreme public pressure, Facebook made sig-
nificant changes to how the News Feed algorithm ranked posts. On January
11, 2018, Facebook’s head of News Feed, Adam Mosseri, announced that the
company would “prioritize posts from friends and family over public content
... including videos and other posts from publishers or businesses,” via their
Pages (Mosseri 2018). He continued:
As we make these updates, Pages may see their reach, video watch
time and referral traffic decrease. The impact will vary from Page to
Page, driven by factors including the type of content they produce and
how people interact with it. Pages making posts that people generally
don’t react to or comment on could see the biggest decreases in distri-
bution. Pages whose posts prompt conversations between friends will
see less of an effect (Mosseri 2018).
1.3 Anecdotal Reports of Traffic Reductions
The first signs that this change might have had a significant impact on
publishers started to appear in February 2018. In Digiday, Lucia Moses
wrote that “Chartbeat data showed Facebook traffic to publishers declined
6 percent since the beginning of January.” Moses added that other propri-
etary tools from PopSugar and True Anthem suggested both modest declines
in Facebook referrals for some publishers and increases for others, just one
month after the changes (Moses 2018).
6(a) Slate (b) Talking Points Memo
Figure 2: Referrals from both Slate and Talking Points Memo decreased
during the period between January 2017 and June 2018. Both organizations
also saw downward referral trends following Facebook’s algorithm change in
January 2018 (Oremus 2018; Marshall 2018).
At the end of February, LittleThings, a publication focused on “a mix
of feel-good news and service content” for women, shut down, citing the
algorithm change as the key reason (Shields 2018).2 LittleThings’ CEO said
its organic (non-paid) traffic from Facebook dropped 75 percent, noting that
“no previous algorithm update ever came close to this level of decimation”
(Ha 2018).
Public conversation kicked off again in June 2018 when Slate published a
large feature on the impact these changes had on its Facebook referral traffic.
The results, it said, were devastating. The story noted that “for every five
people that Facebook used to send to Slate about a year ago, it now sends
less than one” (Oremus 2018). Slate also published a summary chart from its
analytics provider, shown in Figure 2a, which illustrates how traffic to Slate
from Facebook had been on the decline since January 2017, and took another
dip after the January 2018 News Feed changes. Other publishers followed
suit, including, for example, Josh Marshall at Talking Points Memo. His
data, shown in Figure 2b, showed similar decreases in traffic from Facebook
since the beginning of 2017 (with a small uptick after an extreme drop in
February 2018) (Marshall 2018).
2. The assets of LittleThings were later purchased by a mobile gaming company, which
relaunched the publisher. For more, see Mike Shields’s reporting in Business Insider
(Shields 2018).
71.4 Research Question
Given the public conversation around significant changes in Facebook re-
ferral traffic, we wanted to understand what happened for nonprofit news
publishers, especially since they are a rapidly growing segment of the news
ecosystem (Lewis 2018), and a core part of our research at the Shorenstein
Center.3
Put simply, this paper aims to investigate: What happened to referral
traffic from Facebook to nonprofit news organizations after the January 2018
News Feed changes?
This is particularly interesting to investigate because, unlike outlets such
as Slate, these organizations depend less on raw traffic numbers for revenue.
Instead, traffic and social interactions are measures of whether or not these
entities are having the kind of social impact intended. It’s not that traffic
numbers are entirely unrelated to revenue—for example, they are certainly
used to attract fundraising from foundations—but more that they are not
directly tied to revenue in the same way they may be at primarily advertising-
supported publications.4
In section 2, we identify the available data, selection methodology, and
analysis tools we use for this paper.
2 Methods
2.1 Cohort
In order to better understand the impact of the News Feed changes on non-
profit publishers, we collected data from a cohort of eight news organizations,
grouped into two categories: investigative and single-subject. The investiga-
tive group focuses on producing investigative journalism on a wide array
of topics, all in the national interest; whereas the single-subject group may
produce investigative journalism, it’s all in the context of a single subject.
The three investigative organizations are: the Center for Public Integrity,
ProPublica, and Reveal from The Center for Investigative Reporting. The
3. https://shorensteincenter.org/single-subject-news-sites-engagement/
4. For a detailed discussion on the role that organizations like those in our cohort are
playing in a broader news ecosystem, see the “Guide to Audience Revenue and Engage-
ment” (Hansen and Goligoski 2018).
8News Organization Type Topic URL
Center for Public Integrity Investigative Multiple https://www.publicintegrity.org
Chalkbeat Single-Subject Local education https://www.chalkbeat.org
The Hechinger Report Single-Subject Education innovation and inequality https://www.hechingerreport.org
The Marshall Project Single-Subject Criminal justice https://www.themarshallproject.org
ProPublica Investigative Multiple https://www.propublica.org
Reveal Investigative Multiple https://www.revealnews.org
The Trace Single-Subject Gun violence https://www.thetrace.org
The War Horse Single-Subject Veterans issues https://www.thewarhorse.org
Table 1: The eight organizations that make up the cohort for this study.
five single-subject organizations are: Chalkbeat, The Hechinger Report, The
Marshall Project, The Trace, and The War Horse.
The investigative organizations represent large subject areas and are uni-
fied more in their methodology and scope than in the specific subject matter
they discuss. Further, they distinguish themselves from the single-subject
group through the depth of reporting and analysis given to each individ-
ual story. Conversely, the single-subject publishers may provide significantly
more depth on a specific topic over time, and may even have radically more
reporting in any individual story. However, they are differentiated in that
they use multiple methods to cover the same topic over a long period of time.
In the same way that investigative organizations are unified by method, so
too are the single-subject publishers.
The complete cohort for this study, along with the relevant areas of focus,
are listed alphabetically in Table 1.
It should be noted that while this is an extremely small sample of or-
ganizations, and we do not suggest that it is broadly representative, we do
find the data to be of value. Primarily, it is from more organizations than
have previously been made public, and from a particular market segment
that is not only growing but has the potential to be normatively beneficial
for American democracy.
2.2 Data Sources
The data for this study was collected from Google Analytics and Data Stu-
dio, both part of the Google Marketing Platform.5 Google Analytics runs
5. In the middle of 2018, Google re-branded many of its marketing-
related tools under the banner brand “Google Marketing Platform,”
https://marketingplatform.google.com/about/
9a small JavaScript in the web browser of each visitor, which records data
about pages visited, time on site, characteristics of the computer visiting,
etc. Google Data Studio can extract data from multiple Google Analytics
properties (accounts) and run statistics on them together—a critical func-
tion for our research. We selected the Google Marketing Platform for two key
reasons. First, each of the organizations in our cohort already had Google
Analytics installed on its website. Second, by using the same system across
each cohort member, we could ensure that these data points were compara-
ble. Further, if Google Analytics systematically under- or over-counts any
particular metric, it should do so similarly for each cohort member. As noted
above in regard to our small sample size, we also note here that using Google
Analtyics as a data source is also a limited view into what is happening within
Facebook. For example, it cannot track other factors—such as the number of
“likes” an organization’s Facebook page receives—which might also impact
referrals.6
To collect data, we created a “channel” within Google Analytics, which
are “groupings of ... traffic sources,” which we applied to each organization
(About Channel Groupings 2018). Our channel searched for as many per-
mutations of Facebook domains as possible in order to capture all traffic,
including that which originated from mobile devices. We used facebook.
com, developers.facebook.com, en-gb.facebook.com, l.facebook.com,
lm.facebook.com, m.facebook.com, mtouch.facebook.com, and
touch.facebook.com in our channel definition.
In addition, for other analyses, we utilized the default channels in Google
Analytics. These include: Affiliates, Direct, Display, Email, Organic Search,
Other, Other Advertising, Paid Search, Referral, and Social; these channels
are defined in the Google Analytics documentation,7 but are primarily the
common use of the terms. For example, “Social” would include traffic from
Facebook, but not from a WordPress hosted blog. Further, some of the
channels are not listed in our tables and figures because they were not present
in the data for our cohort (e.g., Affiliates, Display, and Other Advertising).
6. For a more in-depth discussion of the epistemology of case selection, see Robert
Stake’s concept of the “opportunity to learn” (Stake 2005). We follow Stake’s opportunity
to learn in that we define it as the ability to gain access to data.
7. See https://support.google.com/analytics/answer/3297892.
10Figure 3: Google Analytics uses this figure in its documentation to illustrate
how sessions can be viewed as a wrapper around a set of activities and events
(How a session is defined in Analytics 2018).
2.2.1 Key Metrics: Sessions and Users
For analysis, we selected two primary metrics: sessions and users. Together
these helped us to create a picture of the traffic from Facebook to each news
organization’s website.
Sessions are defined as “a group of user interactions with [a] website that
take place within a given time frame [30 minutes]. ... a session [is] the
container for the actions a user takes on your site” (Pageview 2018). Thus,
a session can contain multiple activities. Google uses the diagram shown
in Figure 3 to illustrate the concept of a session. Sessions are a particularly
useful metric to answer our research question because they group the number
of times someone comes to a site and browses around as a result of a link
from Facebook. Sessions is more instructive than the raw number of page
views,8 because our interest is not in the total volume of articles read, but
how much traffic is flowing from Facebook to each of the news organizations’
sites.
Google Analytics defines users as “how many users are engaged with your
site” (How users are identified for users metrics 2018). To do so, Analytics
assigns a unique identifier to each user, which is transmitted with each page
view and estimates that the error rate is “typically less than 2%” (How users
are identified for users metrics 2018). Users helps us to understand what
sessions alone does not: the number of people who generate those sets of
interactions.
As such, together, the counts of sessions and users creates a full picture
8. Google defines these as “an instance of a page being loaded (or reloaded) in a browser”
(Pageview 2018).
11of the traffic visiting the websites in our cohort from Facebook. They show
both the count of individuals and the average depth of their interaction. For
example, a single user might be responsible for five sessions over a given
period of time.
2.2.2 A Note on Data from Google Analytics
Google Analytics is not a static store of previously recorded data. The com-
pany continually tunes its algorithms and samples the data it has collected,
meaning that running to the same query at a different time might result in
the display of different data (About Data Sampling 2018).
Further, due to the flexibility of Google Analytics, it is possible to config-
ure the tool in many different ways. We encountered two organizations that
were set up differently than the other six, coded for anonymity as S-C and
S-D. These organizations configured permissions such that source traffic data
is based on a sample of the data instead of a count of every session and user.
Google Analytics estimated the traffic sources for S-C with 25 percent and
S-D with 35 percent of available data. This sampled data is used throughout
the paper whenever we reference a traffic channel. However, we were able to
determine the accurate count of total sessions and users without sampling.
Further, this does not impact our labeling of referral traffic from Facebook,
as discussed in subsection 3.2, because this was a custom query that pulled
complete, non-sampled data for each organization.
3 Results
Below we present the results of our analysis. In order to protect the privacy
of our cohort members, we have anonymized the data by presenting a code
instead of the organization’s name. We use the same code for each organi-
zation throughout the paper, and we differentiate between investigative and
single-subject organizations by the prefix I- and S-, respectively. We also
present percent change data instead of raw counts of metrics.
3.1 Traffic Sources in Context
In order to understand the role of traffic from Facebook, we began by exam-
ining all traffic to each organization.
12News Percentage Change Percentage Change
Organization Users Sessions
I-A 1.78% 0.84%
I-B 0.03% -0.66%
I-C -3.14% -5.26%
S-A 13.35% 6.57%
S-B 14.71% 16.14%
S-C 23.01% 20.71%
S-D 11.38% 10.08%
S-E 76.23% 71.52%
Table 2: Percent change in total users and sessions at each organization in
the cohort in the three months before and after the News Feed modifications.
First, we looked at the change in total users and sessions in the three
months prior to and after the News Feed change. These results are presented
in Table 2. In the three months after the changes, the investigative organi-
zations saw small changes in both metrics, whereas the entire single-subject
cohort saw growth. In almost all cases, both metrics move together—that
is, they show approximately the same percent change in users and sessions.
This is simply explained: adding more users doesn’t change the typical user
behavior. Each user is still coming roughly the same number of times as
older ones. There are two outliers in the case of the single-subject cohort:
S-A and S-E. In the case of S-A, the number of sessions grew only about half
as much as the number of users. One potential explanation of this is that a
burst of new users arrived to see a single piece and never returned. In the
case of S-E, growth was very robust.9
Next, using Google Analytics’ acquisition report, we examined the overall
composition of traffic to each member of the cohort. We present the results
of this analysis in Figure 4, Figure 5, and Table 3 using our metrics of
users and sessions, respectively. In both figures, we show the composition
9. The growth at this publisher was across nearly every metric available and is at-
tributable to a major news story of national interest, in its subject area, that occurred
after the News Feed change. Perhaps most interesting about this is the robustness of
growth in search referrals for S-E, suggesting that people sought out information on the
news topic and found S-E as a source.
13Users I-A I-B I-C S-A S-B S-C S-D S-E
Direct -10.17% 14.31% -7.52% -0.38% 42.53% 68.28% 11.82% 60.06%
Email -10.97% -13.09% 0.13% -93.37% -48.77% 0.61% 12.33% 714.75%
Organic Search 15.57% -3.04% 6.41% 16.07% 36.59% 28.63% 24.53% 141.03%
Other 87.30% -25.43% 22.47% 150.00% -19.47% -57.89% 53.68% 2930.77%
Paid Search 0.10% -71.38% null null null null null null
Referral 5.18% 3.70% 1.51% 412.08% 29.59% 88.85% 23.16% 126.63%
Social -4.38% -5.04% -25.91% -28.97% 11.12% -3.69% -13.96% 79.98%
Sessions I-A I-B I-C S-A S-B S-C S-D S-E
Direct -11.33% 20.49% -5.03% 0.18% 36.82% 74.65% 11.82% 67.99%
Email -13.99% -25.25% 8.10% -93.69% -53.55% 8.30% 13.30% 258597.33%
Organic Search 17.89% -5.46% 7.77% 33.60% 28.03% 30.07% 26.04% 154.24%
Other 92.27% -23.11% 17.33% 50.00% -23.58% -49.33% 55.43% 1492384.62%
Paid Search -0.19% -72.36% -33.33% null null null null null
Referral 3.71% 3.63% -1.86% 596.46% 15.41% 96.43% 28.84% 143.86%
Social -3.46% -0.18% -22.49% -31.10% 8.86% -2.98% -12.85% 90.61%
Table 3: Percentage change in the three months pre- and post-News Feed
change, by Google Analytics channel, for users and sessions. Decreases ap-
pear red, and increases appear green.
of traffic for the three months prior to and three months after News Feed
changes. Traffic is grouped using the default Google Analytics channels:
Direct, Email, Organic Search, Other, Referral, and Social. In the table,
we show the percentage change over the same time period, and in the same
categories. Cells with growth over the period are filled in green, whereas
those with loss are red, for legibility.
Some of the changes in traffic by channel were highly consistent across
every member of the cohort, as shown in Table 3. Referral traffic was most
consistent; it increased users visiting the entire cohort, and increased sessions
for all but I-C, where they were down ≈2%. Organic search traffic was
also extremely consistent; it grew in terms of users and sessions for every
organization except I-B, where users were down ≈3% and sessions ≈5.5%.
Also consistent, and expected, was a decrease in traffic from social media.
Just two organizations saw growth in terms of users and sessions: S-B and
S-E. As noted above, however, S-E saw large growth across all channels.
3.2 Facebook Referral Data
Referral traffic from Facebook for our cohort was very similar to that of all so-
cial media referral traffic. Comparing the social referrals from Table 3 (which
14News Percentage Change Percentage Change
Organization Users Sessions
I-A -13.20% -6.71%
I-B 10.16% 5.71%
I-C -32.53% -37.97%
S-A -33.41% -31.18%
S-B 1.77% 4.50%
S-C -9.37% -10.83%
S-D -29.59% -30.60%
S-E 53.56% 49.47%
Table 4: Percent change in referrals from Facebook by users and sessions
at each organization in the cohort in the three months before and after the
News Feed modifications.
consist of Facebook in addition to other social media) and the extracted Face-
book referrals in Table 4, we saw only one discrepancy, I-B, which experienced
very small losses from social media overall and slight gains from Facebook.
However, when looking for a trend across organizations, the most notable
feature of the data is its inconsistency. Three organizations (I-C, S-A, and
S-D) saw declines of ≈30% in terms of users and sessions from Facebook,
where two (I-A and S-C) were ≈10%. Of the three organizations that saw
growth in referrals from Facebook, S-B saw marginal improvement in users,
at ≈2% but larger lift in terms of sessions, at ≈5%.10 I-B saw low growth
with a lift of ≈10% in users and ≈6% in sessions from Facebook. And S-E,
the outlier of the cohort, saw users grow ≈54% and sessions by ≈49.5% from
Facebook.
10. This is an interesting combination, as it suggests that S-B has found a way to get its
current readers to come back more often.
1516
Figure 4: The composition of all traffic to each cohort member, by the percent of total users, in the three
months before and after the News Feed algorithm change, as measured by the Google Analytics acquisition
report.17
Figure 5: The composition of all traffic to each cohort member, by the percent of total sessions, in the three
months before and after the News Feed algorithm change, as measured by the Google Analytics acquisition
report.4 Conclusions and Future Research
The data from our cohort of nonprofit publishers agrees generally with the
public anecdotes told by and about Facebook’s News Feed change: referral
traffic did decrease. However, it also shows significantly more nuance than
has been published previously. Whereas Slate and Talking Points Memo saw
precipitous drops, the publishers in this cohort saw mild to moderate ones.
Further, the data shows that, on the whole, the organizations in our cohort
continued to grow in the face of these changes, and that there was large
variation in what could be expected from Facebook.
If, as the Shorenstein Center does, one believes that nonprofit publishers
are to play an important role in the future of our journalism ecosystem,
this is an undeniable good. Regardless of the actions of a large technology
company—which no news organization could ever hope to control—there are
paths to growth and serving an audience.
That said, due to the extremely large variation in the experience of each
organization in our cohort, more research is required. Still, two speculative
conclusions stand out.
First, if one takes Facebook’s change announcement at face value, it could
be that it was never intended to impact this group of publishers. If, for exam-
ple, the primary way that the organization’s links are shared on Facebook is
by users instead of by the organization’s own page, its standing in the News
Feed could improve as a result of this change. Put another way, it could
be that these organizations were not equipped to game the system in the
way that larger publishers could. Indeed, in the same piece where Oremus
lamented the decline in Facebook traffic, he explained how the company ac-
tively bought traffic using various intermediaries, all of which contributed to
Facebook referrals (Oremus 2018). In the case of this nonprofit cohort, some
did attempt to buy traffic, but it was on an incredibly small scale, as shown
in Figure 4 and Figure 5. Further research, perhaps incorporating data from
Facebook’s own CrowdTangle tool, would be particularly helpful. It could,
perhaps, help small organizations understand how to encourage the right
kind of social sharing by their audience. It would also be extremely useful to
conduct preliminary research on the methods that small news organizations
could use to conduct these experiments (on how to best use the Facebook
News Feed for growing traffic) on their own. One could imagine a repository
of methods that helps publications learn which kinds of advertising A/B tests
to run and what to learn from them.
18Second, obviously, other acquisition strategies are taking the place of
Facebook. Email is of particular interest to the Shorenstein Center, as is the
referral data presented in Table 3. While not universal, S-E shows growth in
traffic from email. This corresponds with Shorenstein Center experiments in
improving each of the cohort’s email newsletters.11 Further, as highlighted
by Jacque Boltik’s 2017 analysis, the value of email as a traffic source is that
it can be controlled by the news organization in a much more significant way
than other technology platforms (Boltik and Mele 2017).
I-A I-B I-C S-A S-B S-C S-D S-E
Users
Direct + Email -11.71% 14.90% -3.08% -28.06% 26.68% 51.11% 12.00% 406.79%
Search + Social 7.32% -4.20% -1.32% -9.41% 17.10% 19.57% 13.25% 140.73%
Sessions
Direct + Email -10.31% 10.95% -6.27% -25.92% 19.62% 40.26% 11.91% 61.19%
Search + Social 5.17% -3.48% -3.69% -11.57% 21.06% 17.89% 11.60% 128.17%
Table 5: Percentage change in the three months pre- and post-News Feed
change, combining the Direct, Email, Search, and Social Google Analytics
channels. Direct and Email are more directly controlled by the news organi-
zations themselves than Search and Social.
To that end, we asked: what happened to traffic controlled by our cohort
members versus that sent by platforms? The results, shown in Table 5, were
not as enlightening as we had hoped. While these groupings may be a useful
management tool—consistent growth in Direct and Email traffic could be
expected almost regardless of the vagueries of a platform’s algorithmic change
du jour —in the case of our cohort, there was little consistency.
A real-world experiment to determine the extent to which nonprofit news
organizations could use social media platforms to drive email capture and
a separate relationship with readers would be another useful piece of future
research.
11. See, for example, the report on the December 2017 Shorenstein confer-
ence on email newsletters for the cohort, by Emily Roseman, available on
Medium: https://medium.com/single-subject-news-project/six-lessons-about-email-and-
audience-growth-for-nonprofit-news-e05b8ea46a63
19References
About Channel Groupings. 2018. Google Analytics Help. Accessed July 27.
https://support.google.com/analytics/answer/6010097.
About Data Sampling. 2018. Google Analytics Help. Accessed July 29.
https://support.google.com/analytics/answer/2637192.
Boltik, Jacque, and Nicco Mele. 2017. Using Data Science Tools for Email
Audience Analysis. Shorenstein Center on Media, Politics & Public
Policy, October. Accessed July 13, 2018. https:
//shorensteincenter.org/email-analysis-research-guide/.
Demographics of Social Media Users and Adoption in the United States.
2018. Pew Research Center. Accessed August 8.
http://www.pewinternet.org/fact-sheet/social-media/.
Ha, Anthony. 2018. LittleThings Blames Its Shutdown on Facebook
Algorithm Change. TechCrunch, February. Accessed August 9, 2018.
https://techcrunch.com/2018/02/28/littlethings-shutdown/.
Hansen, Elizabeth, and Emily Goligoski. 2018. Guide To Audience Revenue
and Engagement. Columbia Journalism Review, February. Accessed
October 9, 2018. https://www.cjr.org/tow_center_reports/guide-
to-audience-revenue-and-engagement.php.
Herrman, John. 2016. Inside Facebook’s (Totally Insane, Unintentionally
Gigantic, Hyperpartisan) Political Media Machine. The New York
Times Magazine, August. Accessed August 8, 2018.
https://www.nytimes.com/2016/08/28/magazine/inside-
facebooks-totally-insane-unintentionally-gigantic-
hyperpartisan-political-media-machine.html.
How a session is defined in Analytics. 2018. Google Analytics Help.
Accessed July 27.
https://support.google.com/analytics/answer/2731565?hl=en.
How users are identified for users metrics. 2018. Google Analytics Help.
Accessed July 29.
https://support.google.com/analytics/answer/2992042?hl=en.
20Isaac, Mike, and Daisuke Wakabayashi. 2017. Russian Influence Reached
126 Million Through Facebook Alone. The New York Times, October.
Accessed July 13, 2018.
https://www.nytimes.com/2017/10/30/technology/facebook-
google-russia.html.
Lewis, Charles. 2018. The Pace of Nonprofit Media Growth Is Picking Up.
The Conversation, July. Accessed August 11, 2018.
http://theconversation.com/the-pace-of-nonprofit-media-
growth-is-picking-up-98376.
Marshall, Josh. 2018. How Facebook Punked and then Gut Punched the
News Biz. Talking Points Memo, June. Accessed August 9, 2018.
https://talkingpointsmemo.com/edblog/how-facebook-punked-
and-then-gut-punched-the-news-biz.
Moses, Lucia. 2018. As Promised, Facebook Traffic to News Publishers
Declines Again, Post News-Feed Change. Digiday, February. Accessed
August 9, 2018. https://digiday.com/media/promised-facebook-
traffic-news-publishers-declines-post-news-free-change/.
Mosseri, Adam. 2018. Bringing People Closer Together. Facebook
Newsroom, January. Accessed July 23, 2018.
https://newsroom.fb.com/news/2018/01/news-feed-fyi-
bringing-people-closer-together/.
Murphy, Samantha. 2013. The Evolution of Facebook News Feed. Mashable,
March. Accessed July 23, 2018. https:
//mashable.com/2013/03/12/facebook-news-feed-evolution/.
Oremus, Will. 2016. Who Controls Your Facebook Feed. Slate, January.
Accessed August 7, 2018.
http://www.slate.com/articles/technology/cover_story/2016/
01/how_facebook_s_news_feed_algorithm_works.single.html.
. 2018. The Great Facebook Crash. Slate, June. Accessed July 15,
2018. https://slate.com/technology/2018/06/facebooks-
retreat-from-the-news-has-painful-for-publishers-
including-slate.html.
Pageview. 2018. Google Analytics Help. Accessed July 27.
https://support.google.com/analytics/answer/6086080?hl=en.
21Sanghvi, Ruchi. 2006. Facebook Gets a Facelift. Facebook.com, September.
Accessed July 13, 2018.
https://www.facebook.com/notes/facebook/facebook-gets-a-
facelift/2207967130/.
Seward, Zarchary M. 2014. The Homepage Is Dead, and the Social Web Has
Won—Even at The New York Times. Quartz, May. Accessed
August 8, 2018. https://qz.com/209950/the-homepage-is-dead-
and-the-social-web-has-won-even-at-the-new-york-times/.
Shields, Mike. 2018. Facebook’s Algorithm Has Wiped Out a Once
Flourishing Digital Publisher. Business Insider, February. Accessed
August 9, 2018.
https://www.businessinsider.com/littlethings-online-
publisher-shuts-down-and-blames-facebook-algorithm-2018-2.
Stake, Robert E. 2005. “Qualitative Case Studies.” In Handbook of
qualitative research, 3rd Edition, edited by Norman K Denzin and
Yvonna S Lincoln. Thousand Oaks: Sage Publications. isbn:
0761927573.
22You can also read