Developing and validating an individual-level risk calculator for COVID-19 in the United States
←
→
Page content transcription
If your browser does not render page correctly, please read the page content below
Developing and validating an individual-level risk
calculator for COVID-19 in the United States
Xindi Hu ( chu@mathematica-mpr.com )
Mathematica https://orcid.org/0000-0002-4299-3931
Jennifer Starling
Mathematica
Erin Lipman
Mathematica
Emma Pendl-Robinson
Mathematica https://orcid.org/0000-0002-2318-9614
Article
Keywords: COVID-19, risk assessment, 19andMe
Posted Date: April 28th, 2021
DOI: https://doi.org/10.21203/rs.3.rs-456971/v1
License: This work is licensed under a Creative Commons Attribution 4.0 International License.
Read Full License
Page 1/17
Abstract
COVID-19 is one of the leading causes of death in the United States. Certain subsets of the U.S.
population account for a disproportionately large number of deaths, and risk varies widely across
individuals. Evidence-based risk assessment tools customized to individuals can help users understand
their risk level and risk management strategies. Here we present the 19andMe COVID-19 Risk Calculator
that we developed and validated to assess COVID-19 risks based on geography, demographics, health
condition and adherence to public health guidelines. The calculator, which is reviewed periodically to
reflect the most recent evidence, is publicly available through both a web-based tool (167,276 visitors
between April 1, 2020, and January 13, 2021) and an Application Programming Interface. To validate our
methods, we compared risk scores for a set of users from Nexoid’s COVID-19 survival calculator (n =
51,799) using multiple publicly available calculators: 19andMe, Nexoid and the COVID-19 Estimated Risk
(COVER). Mortality risk estimates were consistent between 19andMe and Nexoid, with 98.5% of users
within 10% of each other (Spearman correlation rs = 0.91). We also correlated exposure risk estimates
between 19andMe and Nexoid (rs = 0.48). The risk estimates for hospitalization, admission to intensive
care unit and mortality were consistent between 19andMe and COVER (rs = 0.89, 0.87 and 0.93
respectively).

Introduction
The COVID-19 pandemic, a disease outbreak caused by the SARS-CoV-2 virus, has caused more than
550,000 deaths in the United States as of April 2021, putting it among the leading causes of death in the
country1. Since the beginning of the pandemic, news media
(https://www.nytimes.com/interactive/2020/us/coronavirus-us-cases.html; https://covidtracking.com/),
non-profit organizations (https://coronavirus.jhu.edu/us-map;
https://usafacts.org/visualizations/coronavirus-covid-19-spread-map/) and governmental sources
(https://www.cdc.gov/coronavirus/2019-ncov/cases-updates/index.html) have reported daily and
cumulative case and death counts. However, it is challenging to put these numbers into perspective,
leaving people unsure about their risks of contracting COVID-19 through community exposure and of
severe outcomes from COVID-19. In addition, evolving and conflicting public health recommendations
result in uncertainties surrounding the actionable steps the public can take to mitigate exposure risk2,3.
There are a wide range of infection rates in different cities, counties and states, and these rates changed
during different waves of the pandemic4. Multiple host factors and environmental factors contribute to
the differential levels of risks from COVID-19, including geography5, demographics6,7, health conditions
(https://www.cdc.gov/coronavirus/2019-ncov/need-extra-precautions/people-with-medical-
conditions.html)8, and health behaviors9–11. Once infected with COVID-19, people exhibit a range of
health outcomes, from asymptomatic infections, to mild symptoms, to severe symptoms that require
hospitalization or intensive medical intervention12, with impacts varying widely by population segment.
Science around COVID-19 is both imperfect and always evolving. Therefore, risk assessment tools using

                                                  Page 2/17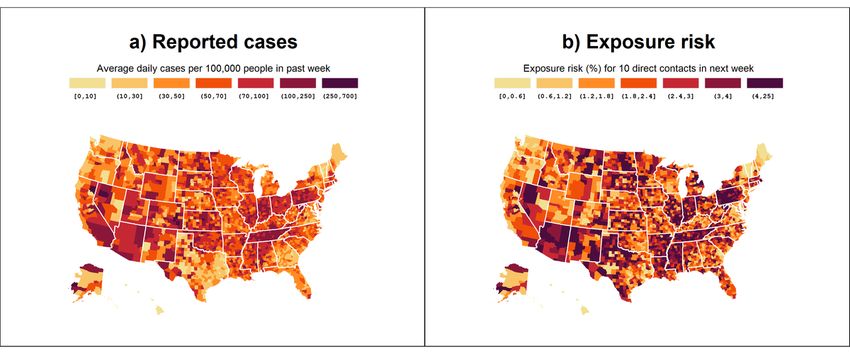
the latest scientific evidence and individual customization can help the public understand their risk
profiles and effective risk management strategies.

The scientific community has developed a number of individualized COVID-19 risk assessment tools.
COVID-19 Estimated Risk (COVER) scores13, developed by the Observational Health Data Sciences and
Informatics collaborative, and the C-19 index (http://c19survey.closedloop.ai/), developed by
Closedloop.ai, predict susceptibility to severe health outcomes from COVID-19 (such as risks for
hospitalization, intensive services and mortality) using patient-level data on age, sex and pre-existing
conditions. Tools that focus only on susceptibility overlook exposure risk, which is based on factors such
as whether local transmission is active and whether participants are engaging in behaviors such as mask
wearing, handwashing and social distancing. MyCOVIDRisk (https://mycovidrisk.app/) and Pandemic
Footprint Index (https://www.pandemic-footprint.com/) focus on the risk of exposure and infection based
on the user’s location, activity and mitigation strategies, but exclude susceptibility risk. The COVID-19
Mortality Risk Calculator (https://covid19risktools.com:8443/riskcalculator#mainbody)14 and the UK-
based Nexoid COVID-19 Survival Calculator (hereinafter Nexoid;
https://www.covid19survivalcalculator.com) consider both susceptibility and exposure risks. However,
both calculators consider mortality as the health endpoint for susceptibility, providing an incomplete
picture of severe health outcomes related to COVID-1914. Lastly, with multiple risk calculators available to
the public and each with its own limitations and assumptions, there is a need to evaluate the consistency
of results reported across multiple risk calculators.

In this paper, we present the COVID-19 individual risk calculator (“19andMe”) that we developed and
validated, which integrates user input with the best available information from official surveillance reports
and peer-reviewed literature. First, we estimated the risk of contracting COVID-19 on the basis of
prevalence in the local community, social contacts, symptoms and preventative measures. We then
estimated the susceptibility of severe COVID-19 outcomes as a function of age, sex and pre-existing
medical conditions. We combined exposure and susceptibility into a single numeric risk score, ranging
from 1 to 100, to indicate low, medium, or high levels of COVID-19 risk. Our aim was to educate the public
and provide guidance that may reduce rates of transmission and mortality. We developed an open-source,
web-based interactive COVID-19 risk calculator for general public consumption, including the only
available Application Programming Interface (API) for easy integration with other decision support tools.
To externally validate our calculation, we compared individual-level estimates with results from Nexoid
and COVER. These two tools were good candidates for validation because Nexoid made its anonymized
data publicly available, and COVER made its risk estimation formulas publicly available. Our risk
calculator provides estimates of users’ risk profiles and encourages behaviors that reduce individual- and
community-level COVID-19 risk (social distancing, wearing masks, and getting vaccinated, for example).
On a policy level, effective pandemic management requires accurate and equitable risk assessment. The
risk calculator presented here promotes risk stratification and effective management of population
health. The risk score can be used to effectively allocate vaccine and other pandemic management
resources.

                                                   Page 3/17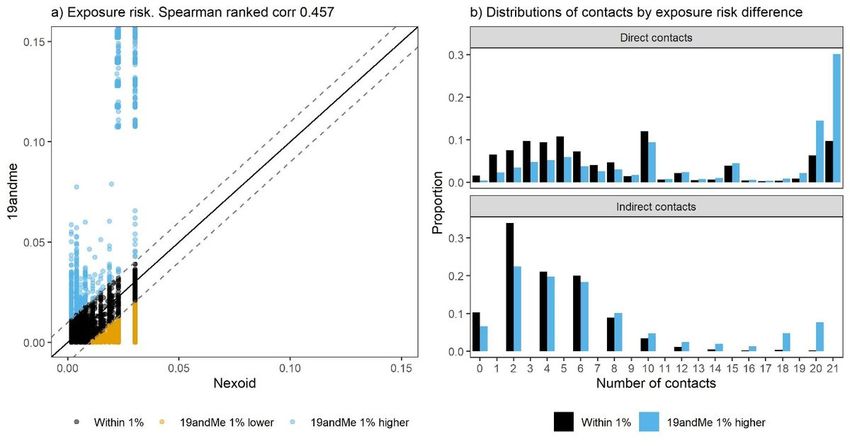
Results
We first describe the end products of our work, which make our algorithm available to the public: the
19andMe web application and the 19andMe API. We then illustrate how our use of underreporting factors
in calculating exposure risk captures variability in exposure risk that is not reflected in reported case
counts alone; taking these factors into account provides users with a more accurate sense of their relative
risk over time than can reported case counts alone. Finally, we present validation results for comparisons
with Nexoid and COVER.

Availability of algorithm to the public. We made the algorithm publicly available in April 2020 through a
web-based interactive risk calculator (https://19andme.covid19.mathematica.org). Users answer
questions in three sections: (1) About You, (2) Pre-existing Conditions and (3) Your Behavior
(supplemental information [SI] Figure S1). In January 2021, we added a fourth section on vaccination
status, but this update is outside the scope of this paper. After providing inputs, the user sees a risk gauge
with their overall risk score, between 1 and 100, color-coded into three categories: 1 to 30 (low risk, green),
31 to 70 (medium risk, yellow), and 71 to 100 (high risk, red). Under the risk gauge, the app provides
detailed statistics on exposure risk, susceptibility risk, and the effect of modifiable behaviors such as
handwashing and wearing personal protective equipment (PPE) (SI Figure S2).

To aid integration with other digital health tools, we developed an API to allow batch processing of
calculations (https://api.covid19.mathematica.org/score). Documentation and access key instructions
for the API is available at https://github.com/mathematica-mpr/covid_risk_score/wiki/19andMe-API-
documentation.

Comparison of estimated COVID-19 exposure risk with reported case prevalence. The 19andMe app helps
users understand their risk of community transmission by estimating the number of active cases in their
county and their risk of exposure, determined from their location and the number of close contacts
(defined as more than 10 minutes at a distance of less than six feet)
(https://www.cdc.gov/coronavirus/2019-ncov/global-covid-19/operational-considerations-contact-
tracing.html). For users who live with other people, the direct contacts of their household members
become indirect contacts of the user. Because testing kits were limited in the early stage of the pandemic
and asymptomatic individuals did not seek care, the actual number of SARS-CoV-2 infections is most
likely greater than the number of officially reported cases. We developed a method based on delay-
adjusted case fatality rates to estimate county-level underreporting factors15. Figure 1 shows the average
number of daily clinically confirmed cases per 100,000 people (Fig. 1A) and the 19andMe estimated
exposure risks, assuming the user has 10 direct contacts (Fig. 1B) between December 8, 2020, and
December 15, 2020. The first map shows only reported cases, whereas the exposure risks shown on the
second map rely on the total estimated number of cases calculated by using an estimated underreporting
factor.

                                                   Page 4/17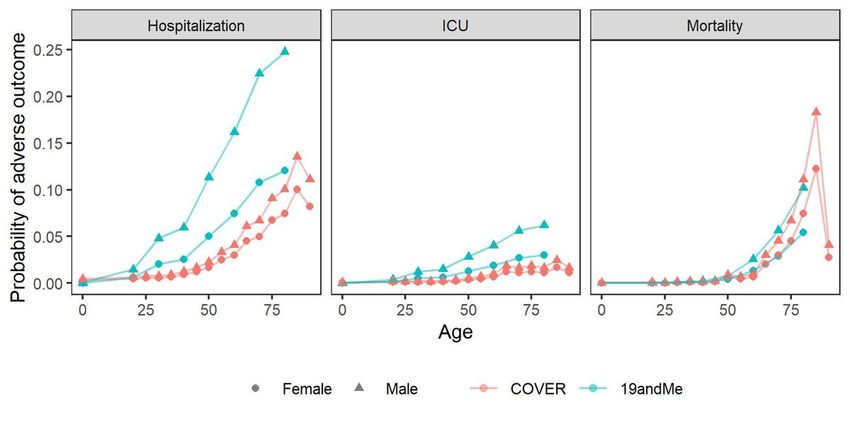
In Fig. 1, reported cases and exposure risk have similar ordinal ranking of states (Spearman correlation
coefficient 0.65, p = < 0.001). However, by incorporating the underreporting factor, the exposure map
captures between-states and within-state variability not represented by case counts alone. For example,
clinically confirmed case prevalence is higher in counties in Utah than in counties in Texas, but after
accounting for the underreporting factors of the two states (Utah: 1.3x; Texas: 5.0x), the estimated
exposure risk is lower in Utah than in Texas. Similar underreporting multipliers estimated using
seroprevalence surveys by Angulo and co-authors corroborate our findings16. The exposure risk map also
shows greater variance within states. For example, the case count in Bertie County and Mecklenburg
County in North Carolina is 59 cases per 100,000 people. However, their underreporting factors are
different; taking the underreporting factor into account, the estimated exposure risk in Bertie County is
4.5%, and 1.1% in Mecklenburg County.

Underreporting factors increase the accuracy of exposure risk over time. We estimate the underreporting
factor as the ratio between the delay-adjusted 90-day case fatality rate (CFR) and the infection fatality
rate (IFR), using deaths as a more reliable indicator of prevalence than case counts. Figure 2A shows the
CFR nationally (dashed lines) and for the five states with the highest cumulative case counts. These rates
are compared to the IFR reported by Russell and co-authors17 in March 2020 and the Institute for Health
Metrics and Evaluation (IHME) in November 2020
(http://www.healthdata.org/sites/default/files/files/Projects/COVID/briefing_US_20201112.pdf). The
CFR and the estimated underreporting factor decreased substantially from May 2020 to February 2021,
as the proportion of infected individuals got tested, diagnosed and reported changes16. As of February
18, 2021, the national underreporting factor using the IMHE IFR was 2.3. The CFR varies substantially by
state. For example, in May 2020, the CFR was higher in New York and Illinois than in Florida and Texas;
however, by October 2020, this trend had reversed18.

The correction for underreporting provides users with a more accurate sense of their relative risk over time
than does case count alone (Fig. 2B). For example, by reported case count (black line), the peak in cases
during the winter 2020 national surge was many times larger than the peak during the initial spring 2020
period. However, after adjusting for underreporting using the IFR from Russell and co-authors for the
spring 2020 period (red) and the updated IHME IFR for the winter 2020 surge (blue), the magnitude of the
surges is more comparable. The app would show a similar exposure risk during the spring 2020 and
winter 2020 peaks for a user in an average county with similar behavior.

Validation analyses using Nexoid. Mortality risk estimates were consistent between 19andMe and Nexoid
(Spearman correlation 0.91, p < 0.001). We obtained 51,799 publicly available Nexoid user records and
calculated 19andMe mortality and exposure risks for comparison. For 98.5% of these records (n =
51,024), results from the two apps were within 10% of each other; for 0.03% (n = 18), 19andMe estimates
were at least 10% lower than Nexoid; and for 1.5% (n = 757), 19andMe estimates were at least 10% higher
than those from Nexoid (Fig. 3A). All users in the higher and lower bands were over age 60. We found
evidence that racial distributions differ across bands (p < 0.001). For the lower band, all 18 users were
Black (Fig. 3B). After adjusting for race by matching the 18 users with White users who have otherwise
                                                  Page 5/17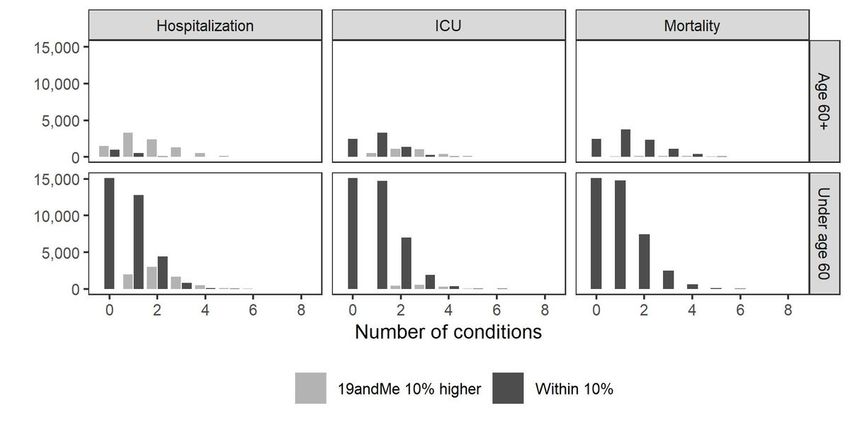
equivalent demographics and behaviors, the estimates were in the within 10% or higher band, in line with
other estimates for users over age 60. For the higher-band users over age 60, we found evidence of
different mean numbers of pre-existing conditions (p < 0.001) (Fig. 3B). We also found evidence of
differences in proportions for the incidence of diabetes, heart disease, hypertension, immune disease,
kidney disease, lung disease, obesity, and smoking in the within-10% versus the higher band (all p < 0.001,
adjusted for multiple comparisons). We did not find evidence of differences in types of employment
between the two bands (p = 0.080).

Exposure risk estimates were also correlated between 19andMe and Nexoid (Spearman correlation 0.48,
p < 0.001). Of the 51,799 users, 78.4% (n = 40,600) had results from two apps within 1% of each other,
13.6% (n = 7,043) had 19andMe estimates at least 1% lower than Nexoid, and 8.0% (n = 4,156) had
19andMe estimates at least 1% higher than Nexoid (Fig. 4A). For users in the higher band, the mean
number of direct and indirect contacts differed (p < 0.001 for both), with the number of direct and indirect
contacts larger in the higher band (Fig. 4B). Handwashing and mask wearing were less prevalent in the
higher band (p < 0.001 for both). For users in the lower band, several factors absent from 19andMe were
associated with higher Nexoid risk estimates: the presence of pre-existing conditions (diabetes or kidney,
liver, or lung disease, p < 0.001), employment in the healthcare sector (p < 0.001), use of public transit (p <
0.001), and working outside the home (p < 0.001).

Validation analyses using COVER. The risk estimates for hospitalization, intensive care unit (ICU)
admission, and mortality were consistent between 19andMe and COVER, with Spearman correlations of
0.89, 0.87, and 0.93, respectively. Of the 51,678 users, 68% (n = 35,103) were within 10% of each other for
hospitalization, 91% (n = 46,951) were within 10% for ICU, and 99% (n = 50,972) were within 10% for
mortality. For nearly all of the remainder of users, 19andMe estimates were at least 10% higher than
those from COVER (Figure S3), with only n = 4, n = 0 and n = 73 users having COVER estimates more than
10% higher than 19andMe for hospitalization, ICU, and mortality, respectively. For all three outcomes,
users under age 60 were very likely to be in the within 10% band (82%, 97% and 100% for hospitalization,
ICU, and mortality, respectively), and users age 60 and older were less likely to be in the within-10% band,
especially for hospitalization (16%, 69%, and 94%, respectively). For the hospitalization and ICU
outcomes, much of this discrepancy between the calculators for older users can be attributed to
19andMe’s higher baseline risks (risks before adjusting for underlying conditions) relative to COVER
(Fig. 5). For both older and younger users, users in the higher band had more pre-existing conditions than
those in the within-10% band (Fig. 6, p < 0.001 for all outcomes and both age groups). Among users under
age 60 for all three outcomes, we also found evidence of differences in proportions for the incidence of
diabetes, heart disease, hypertension, immune disease, kidney disease, lung disease, obesity and
smoking in the within 10% versus higher band (all p < 0.001, adjusted for multiple comparisons). For
users age 60 and older, we found evidence of differences in proportions for all eight conditions for ICU
risk all p < 0.001, adjusted for multiple comparisons) and mortality (all p < 0.001, except for renal disease,
which was 0.02, adjusted for multiple comparisons), and for all conditions except renal disease and lung
disease for hospitalization (all p < 0.01, adjusted for multiple comparisons).

                                                   Page 6/17
Discussion
Our 19andMe COVID-19 risk calculator combines publicly available information with user input to provide
users a better understanding of their COVID-19 risk and the benefits of adhering to public health
guidelines. As scientific understanding of COVID-19 evolves, we incorporate new studies to align the
algorithm with the latest science. As the economy starts to reopen and vaccines become widely available,
it is important to equip the public with essential decision support tools to help them plan their daily
activities. Variance in exposure risk could influence the number of people with whom individuals choose
to interact. Some state and local governments have released guidance about creating “social bubbles”, in
which a small group of people agree to limit their direct contacts to people within the bubble
(https://covid-19.acgov.org/covid19-assets/docs/shelter-in-place/20-14c-social-distancing-eng.pdf;
https://hawaiicovid19.com/social-bubble-faq/). The decision to join a social bubble, and the number of
people within the social bubble, depends on an individual’s risk tolerance level as well as on exposure risk
in the local community.
At the population level, our calculator allows risk stratification and supports effective pandemic
management. 19andMe provides information that can inform targeted public health interventions such
as test screening and contact tracing, while avoiding the unintended consequences of broad interventions
such as lockdowns for individuals, households and country economies19. Risk assessment tools can also
be used to facilitate vaccine distribution to those at highest risk of severe COVID-19, which could
effectively reduce deaths and transmission20–22.
Validation is an important tool in gaining public confidence in COVID-19 risk calculators, increasing
transparency and clarifying sources of differences in reported risk methodology. We found that 19andMe
and Nexoid were well aligned in both mortality and exposure risk estimates, with discrepancies explained
by different choices in which covariates to include and the degree of adjustment for factors such as pre-
existing conditions and advancing age. Our choice to exclude race from 19andMe, as it is likely a proxy
for inequities in healthcare quality and access and is not causal, results in lower mortality risk compared
with Nexoid for Black users over age 60. 19andMe also estimates higher mortality risk for patients over
age 60 with multiple pre-existing conditions. For exposure risk, 19andMe makes stronger upward
adjustments for more contacts, has a wider range and more granular measure for the number of
contacts, and makes stronger downward adjustments for mask wearing and handwashing. Additionally,
Nexoid incorporates factors that 19andMe does not, such as working outside the home, public transit use,
and healthcare sector employment. We found that 19andMe and COVER were well aligned in risks for
hospitalization, ICU, and mortality. Differences are explained by 19andMe’s higher base rates for
hospitalization and ICU, and 19andMe’s stronger upward adjustments for pre-existing conditions,
including some that COVER excludes (for example, smoking and obesity). Smoking and obesity, both of
which increase a user’s risk score in 19andMe but are not considered in COVER, are the two most
common underlying health factors in the Nexoid validation data set.
Page 7/17Our study has several limitations. In the exposure module, the calculator includes person-to-person
droplet transmission among those in close contact (defined by the Centers for Disease Control and
Prevention as being closer than 6 feet apart for more than 10 minutes; see
https://www.cdc.gov/coronavirus/2019-ncov/global-covid-19/operational-considerations-contact-
tracing.html), and does not capture fleeting encounters with strangers, airborne transmission (the
presence of microbes within droplet nuclei, which can remain in the air for long periods of time and can
be transmitted to others over a greater distance), or contaminated surfaces. It also does not consider the
characteristics of the environment in which the close contact occurs, for example, whether the
interactions are outdoors or indoors and whether the space is well ventilated23. In the susceptibility
calculations, our estimates relied on published effect sizes in the literature and therefore are subject to
the same biases as these published results, such as unreported confounders for severe outcomes,
selection bias from unreported COVID-19 cases, and generalization bias. Finally, as with all similar
calculators, we account for a limited number of user characteristics. Risk scores should be interpreted as
an average risk for people whose characteristics and behaviors are similar to those of the user; however,
they may be misinterpreted as reflecting truly individual risk (e.g., they are subject to the “ecological
fallacy” whereby factors that increase risk on average may not increase risk for individuals). This
limitation could lead users to fail to account for how individual confounding factors could influence their
specific individual risk.
Methods
Risk calculator overview. The public may come into contact with the SARS-CoV-2 virus through
interactions with infected individuals. The local transmission level is a major determinant of infection
risk24. In addition, social distancing and personal hygiene (handwashing and wearing PPE) also affect
the individual risk of exposure12,25. Once an individual is infected, different host predisposition factors
may determine the course of the illness, its progression, and the outcome of COVID-1912,26,27. Our
19andMe COVID-19 risk score calculator, which estimates a COVID-19 risk score as the product of
“exposure” and “susceptibility”, normalized by the analogous quantity for the flu for the average
American, and logarithmically scaled to fit on an interpretable scale (Figure S4).
Exposure risk is estimated in a three-step process. First, we calculate an individual’s probability of
contracting COVID-19 in the next week from community transmission, taking into account the community
prevalence of COVID-19 in the user’s county and the number of close contacts. If the user reports having
potential symptoms of COVID-19, we calculate the probability that the user currently has COVID-19 on the
basis of their symptoms28, and we combine that probability with the probability of the user contracting
COVID-19 through community transmission. Second, we account for underreporting of COVID-19 cases
due to asymptomatic cases and the limited availability of tests through a modified version of the delay-
adjusted case fatality ratio methodology published by Russell and co-authors. Finally, we modify the
exposure risk by looking at the user’s reported behavior, including the use of PPE and handwashing10,29.
Page 8/17Susceptibility is characterized by the probability of hospitalization, ICU admission, or death. It is a
function of age, sex and pre-existing medical conditions (https://www.cdc.gov/coronavirus/2019-
ncov/need-extra-precautions/people-with-medical-conditions.html). This calculation relies on the
probabilities of the baseline rate for different age groups and on the odds ratios of how sex and pre-
existing medical conditions change the probability of severe health outcomes, determined from the
published literature; specific rates are updated periodically as the literature rapidly evolves. We have
added new risk factors that increase the severity of COVID-19, such as pregnancy, sickle cell disease, and
cancer 30–32, as newer evidence has become available.
Exposure probability and susceptibility probability are combined in a unified risk score, normalized by the
average probabilities of exposure and of developing severe health outcomes due to seasonal flu, and log-
transformed to fit on a 1 to 100 scale for interpretation. We report the technical details of developing the
“exposure module”, “susceptibility module”, and “risk characterization module” in the supplemental
information.
Validation analyses using Nexoid. We compared exposure and mortality risk estimates from 19andMe
with Nexoid, as Nexoid has made anonymous individual-level records publicly available under the
“Attribution 4.0 International (CC BY 4.0)” license. Each Nexoid record corresponds to one user’s
anonymized inputs to the risk calculator, including exposure and mortality risk estimates and geographic,
demographic, behavioral and medical information. The validation includes all Nexoid users who were in
the United States between August 12, 2020, and November 10, 2020 (n = 51,779). We calculated mortality
and exposure risk using 19andMe’s batch API functionality for each Nexoid user (see the supplemental
information).
We first compared 19andMe versus Nexoid mortality risk, establishing similarity by Spearman correlation
and characterizing users with discrepancies exceeding 10% in either direction (discrepancy bands are
within 10%, 19andMe 10% lower, 19andMe 10% higher). For users under age 60, all mortality risk
estimates were within 10%. For users over 60, because 19andMe does not account for race whereas
Nexoid does, we tested whether the distribution of race was the same in all three discrepancy bands. After
identifying that all users in the lower band were Black, we used matching to compare Nexoid mortality
scores for similar but non-Black users to the corresponding 19andMe scores. For the higher-band users
over age 60, we compared the mean number of pre-existing conditions to the within 10% band. We tested
differences in proportions of diabetes, heart disease, hypertension, immune disease, kidney disease, lung
disease, obesity, and smoking, adjusting for multiple comparisons. We also tested for difference in
employment types in the higher versus the within 10% band, and for difference in the proportions of
COVID-19 symptoms.
We compared per-week exposure risk estimates for 19andMe and Nexoid, again establishing similarity
using Spearman correlation. As the range of exposure risks is smaller than the conditional probability of
mortality risk if infected, we characterized users with discrepancies exceeding 1% in either (discrepancy
bands are within 1%, 19andMe 1% lower, 19andMe 1% higher). For users in the lower band, we tested for
Page 9/17difference in the proportions of several conditions (diabetes, as well as heart, kidney, liver, and lung
disease), living in a nursing home or assisted care facility, employment in the healthcare sector, public
transit use, and work outside the home. Nexoid accounts for these factors, whereas 19andMe does not.
For users in the higher band, we compared mean direct and indirect contact counts to the within-1% band
and tested for differences of proportions for handwashing and mask wearing.
Validation analyses using COVER. To validate 19andMe against COVER, we computed the COVER scores
of hospitalization (COVER-H), necessity for intensive services (COVER-I), and fatality (COVER-F) for each
user in the Nexoid dataset using the algorithm described in Williams and co-authors13. As with the Nexoid
validation, we established similarity via Spearman correlation and characterized users with discrepancies
exceeding 10% in either direction. Details about validation analyses using COVER are reported in
supplemental information Sect. 3. All statistical analyses were performed in R 4.0.2 (https://www.r-
project.org/).
Declarations
Data availability
The 19andMe risk calculator is available at https://19andme.covid19.mathematica.org. All data used in
this study are publicly available. USAFacts data on COVID-19 cases and deaths, which are updated daily,
are available at https://usafacts.org/visualizations/coronavirus-covid-19-spread-map. The Nexoid COVID-
19 survival calculator’s anonymized data are available at
https://www.covid19survivalcalculator.com/en/download.
Code availability
Code for data analyses described in this article can be accessed at https://github.com/mathematica-
mpr/covid_risk_score_paper.
Acknowledgements
We thank the following individuals at Mathematica for their contribution to the development of the data
pipeline and API: Max Dulieu, George Gallo, Sean Kirk, Margaret Luo and Aaron White. We thank the
following individuals for their expert review: George Luo, Matt Salganik, Kelsey Skvoretz and Fei Xing.
References
1. Woolf, S. H., Chapman, D. A. & Lee, J. H. COVID-19 as the Leading Cause of Death in the United
States. JAMA (2020) doi:10.1001/jama.2020.24865.
Page 10/172. Nagler, R. H. et al. Public perceptions of conflicting information surrounding COVID-19: Results from
a nationally representative survey of U.S. adults. PLOS ONE 15, e0240776 (2020).
3. A modelling framework to assess the likely effectiveness of facemasks in combination with ‘lock-
down’ in managing the COVID-19 pandemic | Proceedings of the Royal Society A: Mathematical,
Physical and Engineering Sciences. https://royalsocietypublishing.org/doi/10.1098/rspa.2020.0376.
4. Solis, J., Franco-Paredes, C., Henao-Martínez, A. F., Krsak, M. & Zimmer, S. M. Structural Vulnerability
in the U.S. Revealed in Three Waves of COVID-19. Am. J. Trop. Med. Hyg. 103, 25–27 (2020).
5. Allcott, H. et al. What Explains Temporal and Geographic Variation in the Early US Coronavirus
Pandemic? https://www.nber.org/papers/w27965 (2020) doi:10.3386/w27965.
6. Davies, N. G. et al. Age-dependent effects in the transmission and control of COVID-19 epidemics.
Nat. Med. 26, 1205–1211 (2020).
7. Scully, E. P., Haverfield, J., Ursin, R. L., Tannenbaum, C. & Klein, S. L. Considering how biological sex
impacts immune responses and COVID-19 outcomes. Nat. Rev. Immunol. 20, 442–447 (2020).
8. Williamson, E. J. et al. Factors associated with COVID-19-related death using OpenSAFELY. Nature
584, 430–436 (2020).
9. Haque, M. Handwashing in averting infectious diseases: Relevance to COVID-19. J. Popul. Ther. Clin.
Pharmacol. 27, e37–e52 (2020).
10. Chu, D. K. et al. Physical distancing, face masks, and eye protection to prevent person-to-person
transmission of SARS-CoV-2 and COVID-19: a systematic review and meta-analysis. Lancet Lond.
Engl. 395, 1973–1987 (2020).
11. Lewnard, J. A. & Lo, N. C. Scientific and ethical basis for social-distancing interventions against
COVID-19. Lancet Infect. Dis. 20, 631–633 (2020).
12. Gasmi, A. et al. Individual risk management strategy and potential therapeutic options for the COVID-
19 pandemic. Clin. Immunol. Orlando Fla 215, 108409 (2020).
13. Williams, R. D. et al. Seek COVER: Development and validation of a personalized risk calculator for
COVID-19 outcomes in an international network. medRxiv 2020.05.26.20112649 (2020)
doi:10.1101/2020.05.26.20112649.
14. Jin, J. et al. Individual and community-level risk for COVID-19 mortality in the United States. Nat.
Med. 27, 264–269 (2021).
15. Carfì, A., Bernabei, R., Landi, F., & for the Gemelli Against COVID-19 Post-Acute Care Study Group.
Persistent Symptoms in Patients After Acute COVID-19. JAMA 324, 603 (2020).
16. Russell, T. W. et al. Estimating the infection and case fatality ratio for COVID-19 using age-adjusted
data from the outbreak on the Diamond Princess cruise ship. medRxiv 2020.03.05.20031773 (2020)
doi:10.1101/2020.03.05.20031773.
17. Angulo, F. J., Finelli, L. & Swerdlow, D. L. Estimation of US SARS-CoV-2 Infections, Symptomatic
Infections, Hospitalizations, and Deaths Using Seroprevalence Surveys. JAMA Netw. Open 4,
e2033706 (2021).
Page 11/1718. Russell, T. W. et al. Estimating the infection and case fatality ratio for COVID-19 using age-adjusted
data from the outbreak on the Diamond Princess cruise ship. medRxiv 2020.03.05.20031773 (2020)
doi:10.1101/2020.03.05.20031773.
19. Yang, C. et al. Taking the pulse of COVID-19: a spatiotemporal perspective. Int. J. Digit. Earth 13,
1186–1211 (2020).
20. Hargreaves, J. R. & Logie, C. H. Lifting lockdown policies: A critical moment for COVID-19 stigma.
Glob. Public Health 15, 1917–1923 (2020).
21. Medicine, N. A. of S., Engineering, and, Division, H. and M., Practice, B. on P. H. and P. H., Policy, B. on
H. S. & Coronavirus, C. on E. A. of V. for the N. Framework for Equitable Allocation of COVID-19
Vaccine. (National Academies Press, 2020).
22. Bubar, K. M. et al. Model-informed COVID-19 vaccine prioritization strategies by age and serostatus.
Science 371, 916–921 (2021).
23. Fair Allocation of Scarce Medical Resources in the Time of Covid-19 | NEJM.
https://www.nejm.org/doi/10.1056/NEJMsb2005114.
24. Morawska, L. et al. How can airborne transmission of COVID-19 indoors be minimised? Environ. Int.
142, 105832 (2020).
25. Andersen, L. M., Harden, S. R., Sugg, M. M., Runkle, J. D. & Lundquist, T. E. Analyzing the spatial
determinants of local Covid-19 transmission in the United States. Sci. Total Environ. 754, 142396
(2021).
26. Lipsitch, M., Swerdlow, D. L. & Finelli, L. Defining the Epidemiology of Covid-19 — Studies Needed. N.
Engl. J. Med. 382, 1194–1196 (2020).
27. Giagulli, V. A. et al. Worse progression of COVID-19 in men: Is testosterone a key factor? Andrology 9,
53–64 (2021).
28. Kwok, S. et al. Obesity: A critical risk factor in the COVID-19 pandemic. Clin. Obes. 10, e12403 (2020).
29. Menni, C. et al. Real-time tracking of self-reported symptoms to predict potential COVID-19. Nat. Med.
26, 1037–1040 (2020).
30. Jefferson, T. et al. Physical interventions to interrupt or reduce the spread of respiratory viruses:
systematic review. BMJ 336, 77–80 (2008).
31. Panepinto, J. A. et al. Coronavirus Disease among Persons with Sickle Cell Disease, United States,
March 20–May 21, 2020 - Volume 26, Number 10—October 2020 - Emerging Infectious Diseases
journal - CDC. doi:10.3201/eid2610.202792.
32. Kuderer, N. M. et al. Clinical impact of COVID-19 on patients with cancer (CCC19): a cohort study. The
Lancet 395, 1907–1918 (2020).
33. Wastnedge, E. A. N. et al. Pregnancy and COVID-19. Physiol. Rev. 101, 303–318 (2020).
34. Institute for Health Metrics and Evaluation. COVID-19 Results Briefing: the United States of America.
20 http://www.healthdata.org/sites/default/files/files/Projects/COVID/briefing_US_20201112.pdf
(2020).
Page 12/1735. USAFacts Institute. US Coronavirus Cases and Deaths. USAFacts.org
https://usafacts.org/visualizations/coronavirus-covid-19-spread-map/ (2021).
Figures
Figure 1
The spatial pattern of 19andMe estimated COVID-19 exposure risk is consistent with reported cases, but
with some differences. a) Average daily reported cases per 100,000 people by county, for the week of
December 8¬–15, 2020. b) Estimated exposure risks by county, assuming the user has 10 direct contacts
in a week. Panel b incorporates underreporting factor to capture variability across and within states. The
reported case count and deaths data are from USAFacts
(https://usafacts.org/visualizations/coronavirus-covid-19-spread-map/).
Page 13/17Figure 2
19andMe estimates underreporting of COVID-19 cases as the ratio of the case fatality rate (CFR) to the
infection fatality rate (IFR), as deaths are less likely to be underreported than cases30. a) CFR decreases
over time nationally and at the state level, resulting in smaller underreporting adjustments as case
reporting improves. Horizontal lines show the IFRs reported in March (red) and November 2020
(blue)17,33. b) National 14-day average reported (black) and underreporting-adjusted case counts based
on the two IFR estimates (dashed red, blue)34. The decrease in the underreporting factor over time
Page 14/17reflects improved case reporting, whereas the updated IFR estimates reflect updated literature. 19andMe
switched from the older IFR to the newer IFR in December 2020.
Figure 3
Comparison of mortality risk estimates for 19andMe and Nexoid. a) Nexoid versus 19andMe mortality
risk estimates, by age cohort (above or below 60) and discrepancy band. Estimates are within 10% for all
users under 60; for the older cohort, estimates are still largely aligned. b) Distribution of number of pre-
existing conditions, by discrepancy band and race for users over age 60. The larger number of pre-
existing conditions captures patients with a more complex medical history. All users in the lower band are
Black.
Page 15/17Figure 4
Comparison of exposure risk estimates for 19andMe and Nexoid. a) Nexoid versus 19andMe exposure
risk estimates, by discrepancy band. b) Distribution of direct and indirect contacts, by exposure risk
difference for users where 19andMe and Nexoid are within 1%, versus users where 19andMe estimates
are at least 1% higher. 19andMe increases risk estimates for high contact numbers to a larger degree than
does Nexoid.
Page 16/17Figure 5
Comparison of hospitalization, ICU, and mortality risk estimates for 19andMe and COVER, by age and sex
for users with no underlying conditions. The two estimates are similar for ICU and mortality; the 19andMe
hospitalization risk estimates are higher than those for COVER.
Figure 6
Distribution of number of pre-existing conditions, by discrepancy band, shown separately for users age
60 and above and users under age 60. Users in the higher band had more pre-existing conditions than did
users in the within 10% band.
Supplementary Files
This is a list of supplementary files associated with this preprint. Click to download.
SupplementaryInformationsubmit.docx
Page 17/17You can also read