Development of coronary dysfunction in adult progeny after maternal engineered nanomaterial inhalation during gestation
←
→
Page content transcription
If your browser does not render page correctly, please read the page content below
www.nature.com/scientificreports
OPEN Development of coronary
dysfunction in adult progeny
after maternal engineered
nanomaterial inhalation
during gestation
Sara B. Fournier1, Vincent Lam2, Michael J. Goedken3, Laura Fabris4 &
Phoebe A. Stapleton1,2*
Maternal exposure to environmental contaminants during pregnancy can profoundly influence the
risk of developing cardiovascular disease in adult offspring. Our previous studies have demonstrated
impaired cardiovascular health, microvascular reactivity, and cardiac function in fetal and young
adult progeny after maternal inhalation of nano-sized titanium dioxide (nano-TiO2) aerosols
during gestation. The present study was designed to evaluate the development of cardiovascular
and metabolic diseases later in adulthood. Pregnant Sprague–Dawley rats were exposed to nano-
TiO2 aerosols (~ 10 mg/m3, 134 nm median diameter) for 4 h per day, 5 days per week, beginning
on gestational day (GD) 4 and ending on GD 19. Progeny were delivered in-house. Body weight
was recorded weekly after birth. After 47 weeks, the body weight of exposed progeny was 9.4%
greater compared with controls. Heart weight, mean arterial pressure, and plasma biomarkers of
inflammation, dyslipidemia, and glycemic control were recorded at 3, 9 and 12 months of age, with
no significant adaptations. While no clinical risk factors (i.e., hypertension, dyslipidemia, or systemic
inflammation) emerged pertaining to the development of cardiovascular disease, we identified
impaired endothelium-dependent and -independent arteriolar dysfunction and cardiac morphological
alterations consistent with myocardial inflammation, degeneration, and necrosis in exposed progeny
at 12 months. In conclusion, maternal inhalation of nano-TiO2 aerosols during gestation may promote
the development of coronary disease in adult offspring.
Early life exposures profoundly influence the risk of developing disease later in life. This concept, identified as the
Developmental Origins of Health and Disease (DOHaD) paradigm, hypothesizes that environmental exposures
during critical periods of growth and development in early life (i.e. gestation) may predispose an individual to
chronic disease in adulthood. The most notable examples describe the development of cardiovascular and meta-
arker1. In these seminal studies, Barker and colleagues present the intrauterine
bolic diseases in offspring, by B
origins of cardiovascular and metabolic disease and identify strong correlations between intrauterine or fetal
growth restriction and the development of cardiovascular and metabolic diseases later in l ife2–4.
More recent studies demonstrate maternal exposure to environmental contaminants results in increased
ffspring5. Unfortunately, of the 425 publications identified between 1988 and 2014,
risk of adult disease in o
only 15% focused on cardiovascular or metabolic outcomes; furthermore, only 28 publications focused on
in utero exposures only and none evaluated air pollution or particulate matter (PM) exposure as an initiat-
ing source5. Epidemiological evidence demonstrates that exposure to ambient particulate matter, at any point
between pre-conception and birth, results in reduced fetal growth6. Additionally, data derived from the Boston
1
Environmental and Occupational Health Sciences Institute, Rutgers University, 170 Frelinghuysen Road,
Piscataway, NJ 08854, USA. 2Department of Pharmacology and Toxicology, Ernest Mario School of Pharmacy,
Rutgers University, 160 Frelinghuysen Rd., Piscataway, NJ 08854, USA. 3Research Pathology Services, Rutgers
University, 41 Gordon Road, Piscataway, NJ 08854, USA. 4Department of Material Science and Engineering,
School of Engineering, Rutgers University, 607 Taylor Rd., Piscataway, NJ 08854, USA. *email: stapleton@
eohsi.rutgers.edu
Scientific Reports | (2021) 11:19374 | https://doi.org/10.1038/s41598-021-98818-8 1
Vol.:(0123456789)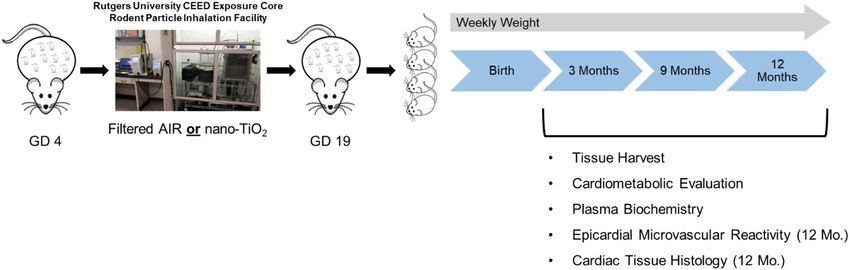
www.nature.com/scientificreports/
Group Number of litters (n) Gestation length (days) Average pups per litter Male/female (%) Mortality Health concerns
11.00 ± 0.41 50.00
AIR 4 22.25 ± 0.25 3 Tumor (1)
(n = 11) 50.00
12.75 ± 0.48 56.00
ENM 4 22.50 ± 0.50 2 Seizure (1)
(n = 12–14) 44.00
Table 1. Litter characteristics. Values are shown as mean ± SEM. Statistics were analyzed with a students T-test
(p < 0.05).
Birth Cohort suggests that maternal exposure to fine ambient PM (PM2.5) during the third trimester is associated
with increased blood pressure in children7. Ultimately, exposure to air pollution early in life has been linked to
the development of cardiovascular disease8 and impaired cardiac function9,10. The progression of cardiovascular
disease has been attributed to increased risk factors, including obesity, hypertension and metabolic disease8. In
laboratory mouse models, in utero exposure to diesel exhaust PM results in increased weight gain, reduced blood
pressure, and cardiac hypertrophy attributed to pressure overload culminating in an increased susceptibility to
heart failure in male offspring at 3 months of age11,12. Interestingly, male mice directly exposed to diesel exhaust
PM did not exhibit symptoms of heart failure for up to 6 months post-exposure13, suggesting that these outcomes
are directly associated with gestational exposure.
Engineered nanomaterials (ENM) have been previously utilized as a surrogate to represent ultrafine PM
(PM0.1)14. Presently, titanium dioxide nanomaterials (nano-TiO2) are one of the most prolific nanoparticles
applied to domestic and industrial products. The production of nano-TiO2 has increased substantially over the
last decade, with an estimated 2.5 million tons to be produced in 202515. Studies focused on occupational expo-
sure, regulation and risk management of nano-TiO2 have identified associations between occupational exposure
to nano-TiO2 and pulmonary inflammation, oxidative stress, cytotoxicity, and fibrosis16,17. Based on experimental
evidence from inhalation studies, TiO2 has been classified by the International Agency for Research on Cancer
(IARC) as possibly carcinogenic to h umans18.
Studies of maternal exposure to nano-TiO2 during gestation has been shown to impair maternal and offspring
health19–24. Unfortunately, data focused on the development of cardiovascular and metabolic disease after in
utero exposure to nano-TiO2 is limited19,25. Previous studies have identified plausible mechanisms of progeny
impairment following maternal exposure to T iO2 during pregnancy including fetal growth restriction, particle
translocation, systemic inflammation, oxidative stress, and epigenetic modifications19,25–27. These conditions may
promote the development of traditional cardiovascular risk factors including hypertension, obesity, dyslipidemia,
and diabetes. We identified a 32% reduction in fetal growth in litters from dams exposed to nano-TiO2 aerosols
via whole-body inhalation for more than 10 days of p regnancy24. Evaluations of female progeny have identified
impaired endothelium-dependent dilation of the coronary microvasculature at 3 months; additionally, there have
been significant reductions in mitochondrial respiration in the left ventricle providing evidence of an association
between cardiovascular and metabolic impairments and gestational exposure to nano-TiO228. Further, a study
by Hathaway et al. reported functional impairments to cardiomyocyte function and bioenergetics in young adult
rats after maternal exposure to nano-TiO2 aerosols throughout gestation22.
While these initial studies have demonstrated impairments in cardiovascular health, microvascular reactivity
and cardiac function in young adult progeny after maternal exposure to nano-TiO2 aerosols during gestation,
the timeline of disease development and progression remains unclear. Furthermore, traditional clinical mark-
ers of cardiovascular and metabolic disease have not yet been evaluated. Therefore, the purpose of this study
was to track traditional markers of cardiovascular and metabolic disease in progeny from birth to 1 year of age
after maternal inhalation of nano-TiO2 particles during gestation. Our results provide evidence that gestational
exposure to nano-TiO2 significantly impairs progeny coronary health; however, this outcome is not associated
with the presentation of traditional cardiovascular risk factors including obesity, dyslipidemia, systemic inflam-
mation, or impaired glycemic control.
Results
Litter characteristics. Average length of gestation, average number of pups per litter, and sex ratio
(expressed as percent male) are reported in Table 1. No differences in litter characteristics were observed between
sham-control and exposure groups.
Progeny growth. Average interval body weights of offspring until 1 year of age are presented in Fig. 1. The
average body weight of nano-TiO2 exposed offspring are similar compared with average body weight of off-
spring exposed to filtered air in the first 3 months (rapid growth phase). The average body weight of nano-TiO2
exposed offspring was significantly higher compared with the average body weights of sham-control offspring in
the 15-week moving average reported at week 47 (Fig. 1) (p < 0.01, two-way ANOVA followed by LSD post hoc
multiple comparison). Average body weights of ENM-exposed offspring tended to be greater compared with
average body weights of sham-controls during the maintenance phase of growth, however these differences were
not significant. At week 47, average body weight from offspring exposed to nano-TiO2 was approximately 9.4%
greater compared with average body weight of offspring exposed to filtered air.
Progeny blood pressure and heart weight. There were no significant differences in MAP (Fig. 2) or
heart weight (Fig. 3) in exposed offspring compared with control offspring at 3, 9 or 12 months. This suggests
Scientific Reports | (2021) 11:19374 | https://doi.org/10.1038/s41598-021-98818-8 2
Vol:.(1234567890)www.nature.com/scientificreports/
Body Weight
week 14
1000
Rapid Growth Maintenance Growth
AIR 䗢
ENM 䗢
800 AIR 䗠
Body Weight, grams
* ENM 䗠
AIR
600
ENM
400
200
0
0 10 20 30 40 50
Age, weeks
Figure 1. Body weight. Interval body weight (mean ± SEM) versus Age (weeks) of offspring from Sham-Control
and ENM groups. *Indicates p ≤ 0.05 versus Sham-Control (AIR) group.
Figure 2. Mean Arterial Pressure. Mean arterial pressure (MAP) for Sham-Control (gray bars) and ENM (black
bars) offspring at 3 and 9 months of age. Values are shown as mean ± SEM.
3 Months 9 Months 12 Months
2.5 2.5 2.5
2.0 2.0
Heart Weight, g
Heart Weight, g
Heart Weight, g
2.0
1.5 1.5
1.0 1.0
1.5
0.5 0.5
0.0 0.0 1.0
AIR ENM AIR ENM AIR ENM
Figure 3. Heart Weight. Heart weight of offspring in Sham-Control (gray bars) and ENM (black bars) offspring
at 3, 9, and 12 months of age. Values are shown as mean ± SEM. Statistics were analyzed with a Students T-test
(p < 0.05).
Scientific Reports | (2021) 11:19374 | https://doi.org/10.1038/s41598-021-98818-8 3
Vol.:(0123456789)www.nature.com/scientificreports/
Passive outer diameter
Group n Inner diameter (µm) Wall thickness (µm) Tone (%) (µm) Passive wall thickness (µm)
AIR 4 67.50 ± 16.48 25.13 ± 1.59 48.40 ± 12.36 183.50 ± 27.50 23.50 ± 1.68
ENM 5 96.00 ± 16.54 26.40 ± 3.21 40.25 ± 11.96 211.20 ± 9.22 22.00 ± 3.52
Table 2. Coronary arteriole characteristics. Coronary arteriole characteristics in Sham-control and ENM
groups. Values are shown as mean ± SEM. Statistics were analyzed with a students T-test (p < 0.05).
Endothelium-Dependent Dila on
A 90
80
Air
*
ENM
Diameter (% Relaxa on)
70
60 *
50
40 *
30
20
10
0
(10-9) (10-8) (10-7) (10-6) (10-5) (10-4)
-10
-20
Log Ach [M]
Endothelium-Independent Dila on
B 70
60
Air *
EN...
Diameter (% Relaxa on)
50 * *
40
30
20
10
0
(10-9) (10-8) (10-7) (10-6) (10-5) (10-4)
-10
Log SNP [M]
Figure 4. Vascular reactivity of coronary resistance arterioles at 12 months. (A) Endothelium-dependent
dilation of coronary arterioles from Sham-Control and nano-TiO2-exposed animals at 12 months was
determined using pressure myography. ACh, Acetylcholine. (B) Endothelium-independent dilation of coronary
arterioles from Sham-Control and nano-TiO2-exposed animals at 12 months was determined using pressure
myography. SNP, Sodium nitroprusside. Values are shown as mean ± SEM. n = 4–5. Statistics were analysed with
two-way ANOVA., *Indicates p ≤ 0.05 versus Sham-Control (AIR) group.
the offspring exposed to nano-TiO2 aerosols during gestation do not develop systemic hypertension or cardiac
hypertrophy.
Coronary vascular reactivity. At 12 months, pressure myography was used to evaluate microvascular
reactivity of isolated coronary arterioles in response to chemical stimuli. The characteristics of these arterioles
can be found in Table 2. Inner diameter and wall thickness were recorded after vessel equilibration and prior to
the addition of any chemical agonists; the passive measures were recorded after the reactivity assessments and
the addition of C a2+-free PSS (Table 2). No significant differences between the control and exposed arterioles
were noted.
To assess endothelium-dependent [acetylcholine (ACH, 1 × 10⁻⁹ to 1 × 10⁻⁴ M)], and endothelium-inde-
pendent [sodium nitroprusside (SNP, 1 × 10⁻⁹ to 1 × 10⁻⁴ M)], reactivity. Endothelium-dependent (Fig. 4A) and
-independent (Fig. 4B) reactivity was significantly blunted in exposed offspring compared with controls.
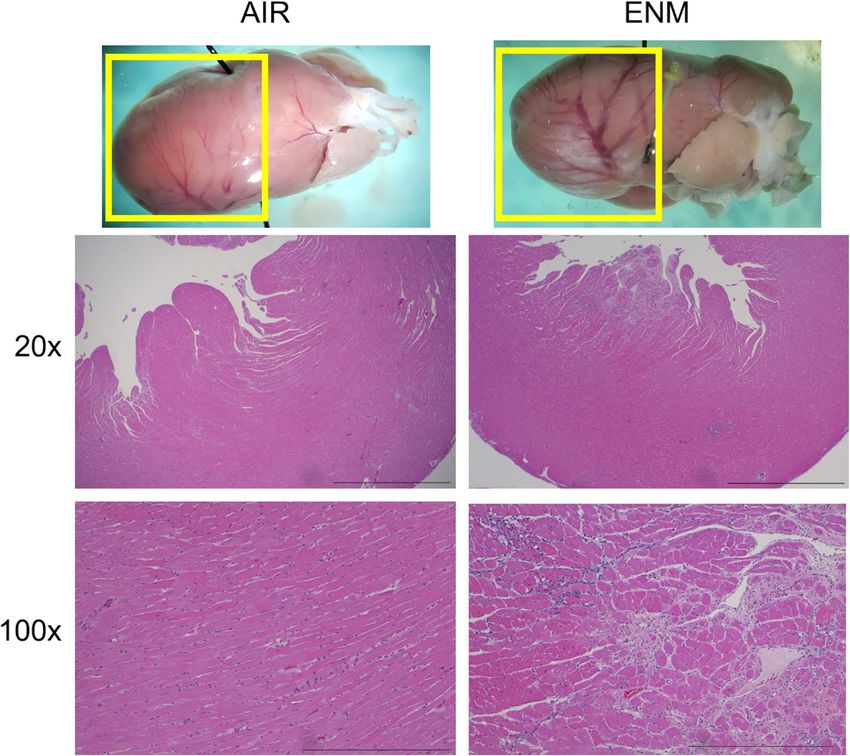
Histopathology. Histological analysis of cardiac tissue (Fig. 5) from F1 offspring of pregnant dams at
12 months exposed to nano-TiO2 revealed histopathological alterations compared with control tissue. These
alterations were characterized by multifocal myocardial inflammation, degeneration, necrosis, loss and/or fibro-
sis. Findings were principally located in left ventricular free wall subepicardial and/or subendocardial paren-
Scientific Reports | (2021) 11:19374 | https://doi.org/10.1038/s41598-021-98818-8 4
Vol:.(1234567890)www.nature.com/scientificreports/
Figure 5. Histological analysis of cardiac tissue at 12 months. Histological analysis of cardiac tissue from
offspring of pregnant dams exposed to nano-TiO2 at 12 months revealed histopathological alterations
compared with tissue from the Sham-Control (AIR) group. n = 3. Reference bar at 20× = 2 mm. Reference bar at
100× = 500 μm.
chyma. Collectively, these histopathological alterations suggest that chronic in utero exposure to nano-TiO2
beginning at GD 4 induces alterations in cardiac morphology that persist into middle age.
Assessment of metabolic plasma proteins. A lack of significant differences between the groups indi-
cates that chronic exposure to nano-TiO2 in utero beginning at GD 4 is not modulating plasma concentrations
of cholesterol, HDL, LDL, or triglycerides (Fig. 6).
Assessment of inflammatory or vascular injury plasma proteins. There were no significant differ-
ences in the inflammatory markers measured between the control and exposed groups indicating that chronic
exposure to nano-TiO2 in utero beginning at GD 4 is not modulating plasma concentrations of general inflam-
matory or vascular injury biomarkers (Fig. 7).
Discussion
Our studies are the first to evaluate progeny health and the development of cardiovascular disease up to
12 months of age. These results suggest that gestational exposure to nano-TiO2 contributes to the development
of cardiovascular and coronary heart disease, as presented in Figs. 4 and 5, but this outcome is not associated
with the development of traditional cardiovascular risk factors. In this study, animals exposed during gestation
weighed more than controls at 47 weeks of age (Fig. 1). Upon further review this outcome was likely driven by
an unequal sex ratio between the groups, with more males in the exposed group and more females in the control
group, as males are naturally larger than females. While there were 93 progeny in both the control and exposed
groups, this outcome was determined by a greater percentage of large males in the exposed cohort (57% male
with an average weight of 854 g) and a greater percentage of smaller females (65% female with an average weight
of 533 g) in the control group. While the exposed males weighted less than the control males at this time point,
shift in the sex ratio likely skewed the combined weight results (Fig. 1).
Exposed offspring presented blood lipid and cholesterol levels that were similar to the control (Fig. 6). Fur-
thermore, there were no systemic markers of inflammation altered during adulthood after gestational exposure
to nano-TiO2 aerosols (Fig. 7). Therefore, assessments of hypertension, dyslipidemia, glycemia, and inflammation
Scientific Reports | (2021) 11:19374 | https://doi.org/10.1038/s41598-021-98818-8 5
Vol.:(0123456789)www.nature.com/scientificreports/
3 Months Total Cholesterol 3 Months HDL 3 Months LDL 3 Months Triglycerides 3 Months Glucose
1000 60 20 250 500
Concentration, mg/dL
Concentration, mg/dL
Concentration, mg/dL
Concentration, mg/dL
Concentration, mg/dL
800 200 400
15
40
600 150 300
10
400 100 200
20
5
200 50 100
0 0 0 0 0
AIR ENM AIR ENM AIR ENM AIR ENM AIR ENM
9 Months Total Cholesterol 9 Months HDL 9 Months LDL 9 Months Triglycerides 9 Months Glucose
1000 60 40 500 500
Concentration, mg/dL
Concentration, mg/dL
Concentration, mg/dL
Concentration, mg/dL
Concentration, mg/dL
800 400 400
30
40
600 300 300
20
400 200 200
20
10
200 100 100
0 0 0 0 0
AIR ENM AIR ENM AIR ENM AIR ENM AIR ENM
12 Months Total Cholesterol 12 Months HDL 12 Months LDL 12 Months Triglycerides 12 Months Glucose
250 80 50 400 400
Concentration, mg/dL
Concentration, mg/dL
Concentration, mg/dL
Concentration, mg/dL
Concentration, mg/dL
40 350
60 300
200
30 300
40 200
20 250
150
20 100
10 200
100 0 0 0 150
AIR ENM AIR ENM AIR ENM AIR ENM AIR ENM
Figure 6. Metabolic panel. Plasma cholesterol, HDL, LDL, and triglycerides were assessed in offspring between
Sham-Control or ENM groups at 3, 9, and 12 months of age. HDL, High density lipoprotein; LDL, low density
lipoprotein. Values are shown as mean ± SEM.
in offspring exposed to nano-TiO2 provided null results; yet evaluations of epicardial arteriolar function at 3
onths28 and 12 months demonstrated endothelium-dependent and -independent dysfunction (Fig. 4).
m
Endothelium-dependent dysfunction is often associated with a reduction in nitric oxide (NO) bioavailability
during the development of cardiovascular disease; however, animals in this study also demonstrated an attenuated
endothelium-independent response in the presence of a NO donor (Fig. 4B). These results indicate dysfunction
of the relaxation of vascular smooth muscle (VSM) of the epicardial arterioles. This is a unique outcome, and the
molecular mechanism(s) of this dysfunction are unclear but may be associated with inhibition of normal VSM,
cGMP or NADPH oxidase signalling29. Chronic impairment in left ventricular coronary blood flow throughout
adulthood may produce the cardiac morphological changes described in Fig. 5. Interestingly, the inflammation
and necrosis in hearts from exposed offspring did not lead to an increase in gross heart weight (Fig. 3). These
results suggest that the microvascular and coronary impairments observed in this study may not lead to tradi-
tional risk factors of cardiovascular disease.
The mechanisms promoting the developmental onset of coronary and cardiac dysfunction after maternal
exposure to nano-TiO2 aerosols is likely a local multifactorial cascade involving particle translocation, oxidative
stress, and epigenetic modifications. Engineered nanomaterials have been identified in the placenta and fetal
compartment after within 24-h after maternal pulmonary exposure20,30. Recently, studies quantified titanium in
human placental and fetal meconium confirming maternal exposure and fetal translocation during p regnancy31.
Nano-sized materials, including nano-TiO2 particles, have been shown to access and accumulate in the fetal heart
after maternal exposure32. Direct nano-TiO2 particle-cellular interactions have been shown to impact human
DNA methylation33, thus promoting the theory that nano-TiO2 translocation to the fetal heart may promote epi-
genetic mechanisms of cardiac dysfunction. Furthermore, direct nano-TiO2 particle and cardiomyocyte interac-
tions reduce cellular metabolic activity and increase oxidative stress34. Oxidative stress within BEAS-2B cells has
been shown to impact epigenetic processes through increased histone acetylation and decreased m ethylation35.
Oxidative stress may also play a role in endothelium-dependent dysfunction and reduced coronary microvascular
dilation, further promoting dysregulation of local oxygen delivery and utilization28. Therefore increased oxida-
tive stress due to nanoparticle translocation and accumulation in the heart may further alter coronary function.
Due to the transgenerational coronary toxicity, genetic modifications may play a significant role in disease
progression after gestational nano-TiO2 exposure19. Transcriptomic analyses of fetal rat coronary tissue have
revealed epigenetic modifications in cardiac, immune, hepatic, renal, and growth s ignalling21, with primary focus
Scientific Reports | (2021) 11:19374 | https://doi.org/10.1038/s41598-021-98818-8 6
Vol:.(1234567890)www.nature.com/scientificreports/
Figure 7. Inflammation and Vascular Injury panel. Plasma IL-10, IL1-β, Leptin, MCP-1, VEGF, GRO, and
sE-Selectin were assessed between Sham-Control or ENM offspring at 3, 9, and 12 months of age. IL-10,
interleukin 10; IL-1β, interleukin 1 beta; MCP-1, monocyte chemoattractant protein-1; VEGF, Vascular
endothelial growth factor. Values are shown as mean ± SEM.
on inflammatory signalling and the cardio-hepatic-renal axis. Extrapolation of these alterations into adulthood
could manifest as systemic inflammation and impaired blood pressure control; however, neither were reported
in the current study. Further study of epigenetic adaptations to offspring after maternal nano-TiO2 inhalation
during pregnancy identify increased DNA methylation in fetal hearts (GD 15), but this outcome is not sustained
in young adult mice at 11 weeks of a ge36. These results may indicate that these epigenetic alterations are not
sustained into adulthood, or that physiological compensatory mechanisms may impact functional outcomes.
Unfortunately, these studies have yet to be conducted.
Overall, these results identified the development of coronary artery disease and cardiac morphological
changes in rats at 1 year of age after gestational exposure to nano-TiO2 particles through maternal whole-body
inhalation. These cardiovascular perturbations were not attributed to the development of traditional risk factors
of cardiovascular disease including obesity, hypertension, dyslipidemia, or impaired glycemic control. These data
are vital to the understanding of the DOHaD hypothesis as it pertains to cardiovascular disease and contribute
to the concept that maternal environmental exposure during pregnancy may be identified as a risk factor for the
development of cardiovascular disease in offspring.
Materials and methods
Nanomaterial characterization. Nano-titanium dioxide (nano-TiO2) powder was acquired from Evonik
(Aeroxide TiO2, Parsippany, NJ). Previous characterization of this powder has determined the composition to
be anatase (80%) and rutile (20%) TiO2, with a primary particle size of 21 nm and a surface area of 48.08
mg2/g24. Characterization of these particles was re-confirmed via dynamic light scattering (DLS) techniques
using Zetasizer Nano ZS by Malvern. The size of the agglomerated nanoparticles in d iH2O was measured as
231 ± 21 nm with Non-Invasive Backscatter optics (NIBS) using a 4 mW, 633 nm l aser37. Nano-TiO2 powder was
dried, sieved, and stored under vacuum prior to aerosolization.
Experimental animal model. Pregnant, gestational day (GD) 3 Sprague–Dawley (SD) rats were pur-
chased from Charles River Laboratories (Kingston, NY) and allowed ad libitum access to food and water. All
dams were randomly assigned to either Sham-Control (n = 4) or Exposed (n = 5) groups.
Rats were exposed for 4 h per day, 5 days per week, during GD 4–GD 19 of pregnancy. This equated to
10.0 ± 0.58 days of exposure. The last exposure was completed approximately 36–48 h before delivery (Fig. 8).
This exposure paradigm has previously demonstrated fetal growth restriction and impaired fetal coronary health
Scientific Reports | (2021) 11:19374 | https://doi.org/10.1038/s41598-021-98818-8 7
Vol.:(0123456789)www.nature.com/scientificreports/
Figure 8. Experimental design. Timed-pregnant Sprague–Dawley rats were assigned to Sham-Control or ENM
groups. All animals underwent chronic (4 h/day) whole body exposure to nano-sized titanium dioxide (nano-
TiO2) aerosols or filtered air, beginning at gestational day (GD) 4. Rats delivered (GD 20–22) and offspring
were weighted weekly. Body weight intervals were calculated from the weekly weights based on critical stages
of rodent growth. Tissue from progeny was collected at 3 months, 9 months and 12 months for analysis. GD,
Gestational day; CEED, Center for Environmental Exposures and Disease.
after gestational e xposure22,24,36,38,39. For this study we elected to leave dams and litters untouched for one week
to prevent maternal rejection of the fetus.
Male and female offspring remained with mothers until weaning, between 3–4 weeks of age, and were ran-
domly assigned to 3, 9, or 12 month groups (n = 8–10 progeny per group). Rat ages extrapolate to approximately
10, 24, and 30 human years, r espectively40. Care was taken to select one male and one female offspring from each
litter for assessment. Over the course of the study, 3 control and 2 exposed offspring were removed from study
due to health concerns (Table 1). Animals were housed in an AAALAC accredited facility at Rutgers University.
All procedures were approved by the Institutional Animal Care and Use Committee of Rutgers University, were
executed in accordance with the standards set forth in the “Guide for the Care and Use of Laboratory Animals”
of the National Research Council of the National Academies and was conducted in accordance with ARRIVE
guidelines.
Engineered nanomaterial whole‑body inhalation exposure. Maternal exposures to nano-TiO2
were performed using a custom rodent inhalation facility designed for whole-body aerosolized nanomaterial
inhalation as previously described37 (IEStechno, Morgantown, WV). The collective exposure system consists of
a vibrating fluidized bed, a Venturi vacuum pump, cyclone separator, impactor and mixing device, an animal
housing chamber, and real-time monitoring devices with feedback control. Nano-TiO2 aerosols were gener-
ated via a high velocity air stream passing through the vibrating fluidized bed and into the Venturi vacuum
pump. From there, the aerosols entered the cyclone separator to remove agglomerates greater than 400 nm at an
input flow rate of 60 l/min of clean dry air before entering the exposure chamber. Relative mass concentration
(9.57 ± 0.3 mg/m3; IEStechno, Morgantown, WV) of the aerosols and size distribution (133.73 ± 1.87 nm; SMPS,
TSI, Shoreview, MN) and were monitored in real time (Figure S1). Particle concentration was verified through
gravimetric sampling wherein aerosols were collected on a 47 nm PTFE membrane filter and an XP2U micro-
balance (Mettler Toledo, Switzerland).
Each exposure lasted approximately 4 h/day, with a calculated lung daily deposition of 43.8 ± 1.2 μg. Lung
deposition was calculated based on previously described mouse methodology and normalized to rat weight and
to pregnant rat minute ventilation using the equation: D = F·V·C·T, where F is the deposition fraction (14%),
V is the minute ventilation based on body weight, C equals the mass concentration (mg/m3), and T equals the
exposure duration (minutes)14,24. Control animals were exposed within the same inhalation facility to HEPA-
filtered air only for 10 days using an identical protocol.
Body weights. Body weights for all progeny were measured and recorded once a week from the first week
after birth to approximately 1 year.
Growth data was analyzed in accordance with an approach to the evaluation of rodent growth data in toxicol-
ogy studies by Hoffman et al.41. Weekly data were reported for the first four weeks. Growth data from subsequent
weeks were pooled across relevant time intervals to obtain an interval average for each animal within each
analysis interval. After collecting weekly data for the first 4 weeks after birth, a three-week moving average was
calculated every two weeks at weeks 5, 7, 9, 11, and 13. Thereafter, a five-week moving average was calculated
every 4 weeks at weeks 16, 20, and 24 followed by a fifteen-week moving average every 14 weeks at weeks 33, and
47. Data is reported as male, female, and combined progeny for both the control and exposed groups.
Mean arterial pressure (MAP). Rats were anesthetized with isoflurane gas (5% induction, 3% mainte-
nance). The right carotid artery was cannulated to directly assess mean arterial pressure (MAP). A BLPR2 pres-
sure transducer (World Precision Instruments, Sarasota, FL) was used in conjunction with a blood pressure
monitor (World Precision Instruments, Sarasota, FL) to measure MAP.
Scientific Reports | (2021) 11:19374 | https://doi.org/10.1038/s41598-021-98818-8 8
Vol:.(1234567890)www.nature.com/scientificreports/
Isolated microvessel preparation. Isolated microvessel responses were recorded in a subset of animals
at 12 months of age. Following blood collection, the heart was removed, flushed of excess blood, and placed in
physiological salt solution (PSS (in mmol/l): 129.8 NaCl, 5.4 KCl, 0.5 N aH2PO4, 0.83 M gSO4, 19 N aHCO3, 1.8
CaCl2, and 5.5 glucose; pH 7.35–7.40) and chilled to 4 °C for dissection. Coronary resistance arterioles (< 160
um maximum diameter) from the left anterior descending (LAD) artery distribution were isolated, excised, and
transferred to a vessel chamber (Living Systems Instrumentation, Burlington, VT, USA) containing oxygenated
PSS as previously described28,42. Vessel segments were cannulated with glass pipettes and secured using nylon
suture (11–0 ophthalmic, Alcon, UK). Arterioles were extended to their in situ length, pressurized to 45 mmHg
with PSS, superfused with warmed (37 °C) oxygenated (21% O 2–5% CO2–74% N2) PSS at a rate of 10 ml/minute
and allowed to develop spontaneous tone over 30 min of equilibration. Vessel diameters were measured using
video calipers (Colorado Video, Boulder, CO, USA).
Following equilibration arteriolar responsiveness to chemical agents was assessed randomly to avoid any
ordering effects. Relaxation responses were evaluated via cumulative addition of 100 µL acetylcholine (ACH;
1 × 10⁻⁹ to 1 × 10⁻⁴ M; MP Biomedicals LLC, Santa Ana, CA, USA) to assess endothelium-dependent reactivity
or sodium nitroprusside (SNP; 1 × 10⁻⁹ to 1 × 10⁻⁴ M; Thermo Fisher Scientific, Waltham, MA, USA) to assess
endothelium-independent reactivity. Following assessments of arteriolar reactivity, the superfusate was replaced
with Ca2+-free PSS to establish passive tone. All pharmacological agents were dissolved in PSS.
Spontaneous tone was calculated by the following equation: [(DM − DI)/DM] × 100, where DM is the maximal
diameter recorded at 45 mm Hg for the coronary arterioles under C a2+-free PSS, and D
I is the initial steady-state
diameter achieved prior to the experimental period.
The responses to ACH and SNP are presented as percent relaxation from spontaneous baseline diameter:
[(DSS − DCON)/(DM − DCON)] × 100, where DSS remains the steady-state diameter achieved after each chemical
bolus, and D CON is the control diameter measured immediately prior to the dose–response experiment. All
experimental periods were at least two minutes, and all steady-state diameters were collected for at least one
minute. These studies were not blinded as the researcher performing these assessments (PS) also prepared the
animals for exposure.
Histology. All histological examinations were performed using standard laboratory procedures.
Representative hearts from a subset of animals at 12 months of age were fixed in 10% neutral buffered for-
malin, embedded in paraffin blocks, and sectioned to 4 µm-thick sections that were subsequently mounted onto
glass slides. Hematoxylin and eosin (H&E) stained slides were assessed by an ACVP board-certified veterinary
pathologist who was blinded to the treatment group.
Blood collection. Under isoflurane sedation, blood was collected for clinical chemistry prior to euthanasia.
Approximately 4–5 cc of blood was collected directly from the carotid artery cannula and divided into EDTA
vacutainers. Blood was centrifuged (1100 RCF, 10 min) to separate the plasma from other constituents. After
centrifugation plasma was removed with a transfer pipette, flash frozen in liquid nitrogen, and stored at − 80 °C
until analysis. Hearts were removed at sacrifice, after rinsing with 4 °C physiological salt solution, hearts were
blotted on a Kimwipe® and weighed.
Plasma biochemistry. Plasma total cholesterol (TC, Pointe Scientific, Canton, MI), auto low density lipo-
protein (autoLDL, Pointe Scientific, Canton, MI), auto high density lipoprotein (autoHDL, Pointe Scientific,
Canton, MI), and triglyceride (TG, Pointe Scientific, Canton, MI), concentrations were quantitated in duplicate
using enzymatic assays with commercially available reagents (Pointe Scientific, Canton, MI) according to manu-
facturer’s instructions in progeny at 3, 9 and 12 months of age.
Multiplex protein analysis. Circulating concentrations for cytokines and chemokines (Leptin, TNFɑ,
GRO IL-4, IL-1β, IL-6, IL-10, IFNγ, MCP-1, VEGF, RANTES) in plasma from Control and Exposed animals
were estimated using a Millipore Rat Cytokine/Chemokine Assay (EMD Millipore) at 3, 9, and 12 months of age.
Briefly, specific proteins bound to fluorescent beads were detected using a mix of protein-specific, biotinylated
detector antibodies followed by incubation with streptavidin-PE. Circulating concentrations for biomarkers of
vascular injury (sICAM-1 and sE-Selectin) in plasma from Control and Exposed animals were estimated using
a Millipore Rat Vascular Injury Assay (EMD Millipore).
Statistics. All data, with the exception of growth, were assessed by maternal dam not individual progeny.
Growth data was analyzed between treatment groups using a two-way ANOVA and was followed by the least-
significant difference test (LSD) for multiple comparisons. All statistical analysis was completed with GraphPad
Prism 8 (San Diego, CA, USA). Point-to-point differences in the body weight were evaluated using two-way
repeated measures analysis of variance (ANOVA) followed by LSD post hoc multiple comparison. Metabolic,
inflammatory, and vascular injury data were evaluated using two-way repeated measures analysis of variance
(ANOVA) with a Tukey’s post hoc analysis when significance was found. Pressure myography data was evaluated
using first-order regression equations developed to assess line slope relationships (SigmaPlot 11.0, Systat, San
Jose, CA). All data are expressed as mean ± SEM and significant results are indicated at p ≤ 0.05.
Scientific Reports | (2021) 11:19374 | https://doi.org/10.1038/s41598-021-98818-8 9
Vol.:(0123456789)www.nature.com/scientificreports/
Received: 12 July 2021; Accepted: 15 September 2021
References
1. Barker, D. J. The fetal and infant origins of adult disease. BMJ 301, 1111 (1990).
2. Fall, C. H. D. in Early Life Origins of Health and Disease (eds E. Marelyn Wintour & Julie A. Owens) 8–28 (Springer, 2006).
3. Barker, D. J., Bull, A. R., Osmond, C. & Simmonds, S. J. Fetal and placental size and risk of hypertension in adult life. BMJ 301,
259–262. https://doi.org/10.1136/bmj.301.6746.259 (1990).
4. Barker, D. J., Osmond, C., Golding, J., Kuh, D. & Wadsworth, M. E. Growth in utero, blood pressure in childhood and adult life,
and mortality from cardiovascular disease. BMJ 298, 564–567. https://doi.org/10.1136/bmj.298.6673.564 (1989).
5. Heindel, J. J., Skalla, L. A., Joubert, B. R., Dilworth, C. H. & Gray, K. A. Review of developmental origins of health and disease
publications in environmental epidemiology. Reprod. Toxicol. 68, 34–48. https://doi.org/10.1016/j.reprotox.2016.11.011 (2017).
6. Nobles, C. J. et al. Ambient air pollution and fetal growth restriction: Physician diagnosis of fetal growth restriction versus
population-based small-for-gestational age. Sci. Total Environ. 650, 2641–2647. https://doi.org/10.1016/j.scitotenv.2018.09.362
(2019).
7. Zhang, M. et al. Maternal exposure to ambient particulate matterwww.nature.com/scientificreports/
38. Kunovac, A., Hathaway, Q. A., Pinti, M. V., Taylor, A. D. & Hollander, J. M. Cardiovascular adaptations to particle inhalation
exposure: Molecular mechanisms of the toxicology. Am. J. Physiol. Heart Circ. Physiol. 319, H282-h305. https://doi.org/10.1152/
ajpheart.00026.2020 (2020).
39. Hathaway, Q. A. et al. miRNA-378a as a key regulator of cardiovascular health following engineered nanomaterial inhalation
exposure. Nanotoxicology 13, 644–663. https://doi.org/10.1080/17435390.2019.1570372 (2019).
40. Sengupta, P. The laboratory rat: Relating its age with human’s. Int. J. Prev. Med. 4, 624–630 (2013).
41. Hoffman, W. P., Ness, D. K. & van Lier, R. B. Analysis of rodent growth data in toxicology studies. Toxicol. Sci. 66, 313–319. https://
doi.org/10.1093/toxsci/66.2.313 (2002).
42. Stapleton, P. A. et al. Impairment of coronary arteriolar endothelium-dependent dilation after multi-walled carbon nanotube
inhalation: A time-course study. Int. J. Mol. Sci. 13, 13781–13803. https://doi.org/10.3390/ijms131113781 (2012).
Acknowledgements
We would like to recognize Ms. Charlotte Love and Brittany Phan for their work weighing the animals pertaining
to Figure 1. This work was supported by the National Institute of Environmental Health Sciences (R00-ES024783
and R01-ES031285), Rutgers Center for Environmental Exposures and Disease (P30-ES005022), and Rutgers
Joint Graduate Program in Toxicology (T32-ES007148). Lastly, we have no conflict of interest to report.
Author contributions
S.F. assisted with experimental design, data collection, data analysis, figure development, and writing of the
original manuscript; V.L. assisted with data collection and data analysis; M.G. completed the histological studies
and interpreted the results; L.F. characterized the nanomaterial for these studies and interpreted the results; P.S.
assisted with development of the experimental design, data analysis and writing of the manuscript and revision.
Competing interests
The authors declare no competing interests.
Additional information
Supplementary Information The online version contains supplementary material available at https://doi.org/
10.1038/s41598-021-98818-8.
Correspondence and requests for materials should be addressed to P.A.S.
Reprints and permissions information is available at www.nature.com/reprints.
Publisher’s note Springer Nature remains neutral with regard to jurisdictional claims in published maps and
institutional affiliations.
Open Access This article is licensed under a Creative Commons Attribution 4.0 International
License, which permits use, sharing, adaptation, distribution and reproduction in any medium or
format, as long as you give appropriate credit to the original author(s) and the source, provide a link to the
Creative Commons licence, and indicate if changes were made. The images or other third party material in this
article are included in the article’s Creative Commons licence, unless indicated otherwise in a credit line to the
material. If material is not included in the article’s Creative Commons licence and your intended use is not
permitted by statutory regulation or exceeds the permitted use, you will need to obtain permission directly from
the copyright holder. To view a copy of this licence, visit http://creativecommons.org/licenses/by/4.0/.
© The Author(s) 2021
Scientific Reports | (2021) 11:19374 | https://doi.org/10.1038/s41598-021-98818-8 11
Vol.:(0123456789)You can also read