The Strain-Rate Sensitivity of High-Strength High-Toughness Steels
←
→
Page content transcription
If your browser does not render page correctly, please read the page content below
SANDIA REPORT
SAND2007-0036
Unlimited Release
Printed January 2007

The Strain-Rate Sensitivity of High-
Strength High-Toughness Steels
Brad L. Boyce, Thomas B. Crenshaw, and Morris F. Dilmore

Prepared by
Sandia National Laboratories
Albuquerque, New Mexico 87185 and Livermore, California 94550

Sandia is a multiprogram laboratory operated by Sandia Corporation,
a Lockheed Martin Company, for the United States Department of Energy’s
National Nuclear Security Administration under Contract DE-AC04-94AL85000.

Approved for public release; further dissemination unlimited.

Issued by Sandia National Laboratories, operated for the United States Department of
Energy by Sandia Corporation.

NOTICE: This report was prepared as an account of work sponsored by an agency of
the United States Government. Neither the United States Government, nor any agency
thereof, nor any of their employees, nor any of their contractors, subcontractors, or their
employees, make any warranty, express or implied, or assume any legal liability or
responsibility for the accuracy, completeness, or usefulness of any information,
apparatus, product, or process disclosed, or represent that its use would not infringe
privately owned rights. Reference herein to any specific commercial product, process, or
service by trade name, trademark, manufacturer, or otherwise, does not necessarily
constitute or imply its endorsement, recommendation, or favoring by the United States
Government, any agency thereof, or any of their contractors or subcontractors. The
views and opinions expressed herein do not necessarily state or reflect those of the United
States Government, any agency thereof, or any of their contractors.

Printed in the United States of America. This report has been reproduced directly from
the best available copy.

Available to DOE and DOE contractors from
         U.S. Department of Energy
         Office of Scientific and Technical Information
         P.O. Box 62
         Oak Ridge, TN 37831

           Telephone:         (865) 576-8401
           Facsimile:         (865) 576-5728
           E-Mail:            reports@adonis.osti.gov
           Online ordering:   http://www.osti.gov/bridge

Available to the public from
         U.S. Department of Commerce
         National Technical Information Service
         5285 Port Royal Rd.
         Springfield, VA 22161

           Telephone:         (800) 553-6847
           Facsimile:         (703) 605-6900
           E-Mail:            orders@ntis.fedworld.gov
           Online order:      http://www.ntis.gov/help/ordermethods.asp?loc=7-4-
0#online

                                            2
SAND2007-0036
Unlimited Release
Printed January 2007
The Strain-Rate Sensitivity of High-
Strength High-Toughness Steels
B. L. Boyce and T. B. Crenshaw
Materials Science and Engineering
Sandia National Laboratories
P.O. Box 5800
Albuquerque, NM 87185-0889
M. F. Dilmore
AFRL/MNMW
Eglin AFB, FL
Abstract
The present study examines the strain-rate sensitivity of four high strength, high-
toughness alloys at strain rates ranging from 0.0002 s-1 to 200 s-1: Aermet 100, a modified
4340, modified HP9-4-20, and a recently developed Eglin AFB steel alloy, ES-1c. A
refined dynamic servohydraulic method was used to perform tensile tests over this entire
range. Each of these alloys exhibit only modest strain-rate sensitivity. Specifically, the
strain-rate sensitivity exponent m, is found to be in the range of 0.004 – 0.007 depending on
the alloy. This corresponds to a ~10% increase in the yield strength over the 7-orders of
magnitude change in strain-rate. Interestingly, while three of the alloys showed a
concominant ~3-10% drop in their ductility with increasing strain-rate, the ES1-c alloy
actually exhibited a 25% increase in ductility with increasing strain-rate. Fractography
suggests the possibility that at higher strain-rates ES-1c evolves towards a more ductile
dimple fracture mode associated with microvoid coalescence.
3Acknowledgements
The authors would like to thank V. Luk, D. Dederman, and D. Frew for their
administrative and fiscal support for this project under the auspices of the DOD/DOE MOU
TCG XI. BLB would like to thank R. Grant for SEM documentation of fracture surfaces,
and would also like to thank Prof. D. Matlock of the Colorado School of Mines for fruitful
discussions on this topic.
4Contents:
1. Introduction .............................................................................................................. 7
2. Materials................................................................................................................... 8
3. Testing Method ...................................................................................................... 11
4. Results .................................................................................................................... 14
5. Discussion .............................................................................................................. 19
6. Summary: Implications for Designers .................................................................. 20
7. References .............................................................................................................. 21
Distribution ................................................................................................................. 22
56
1. Introduction

        Reliable design of structural components requires an understanding of their material
properties under relevant conditions. In the case of earth-penetrating munitions or gravity-
dropped weapons, which are traditionally constructed from high-strength, high-toughness
steels, this requires an understanding of the dynamic mechanical properties at relevant
strain-rates. Specifically, these types of impact environments typically involve impact
durations where the maximum strain is reached within ~1 ms of initial contact. In a metal
which undergoes 50% strain, such an impact corresponds to a strain rate of 500 s-1. The
focus of the present study is to establish the rate-dependent tensile behavior of several high-
strength steel alloys at strain rates approaching this regime.

        There is very limited data available in the literature regarding deformation behavior
at strain rates in the range of 10-500 s-1. This is partially due to the difficulty in testing in
this “intermediate” or “sub-Hopkinson” strain-rate regime, where rates are faster than the
traditional quasi-static equilibrium of a conventional stress- or strain-controlled tensile test
and slower than the single-wave mechanics of a split-Hopkinson bar test. These difficulties
have led to numerous published datasets of questionable validity, where undesired
“oscillations” or “ringing” in the force signal were merely smoothed numerically after the
test. The present study employs recently developed damping and robust load cell design to
greatly mitigate these convoluting effects.

        One of the most notable datasets in the literature regarding the behavior of steels in
the sub-Hopkinson rate regime was published by Bleck and Schael in 2000 [1]. The authors
were themselves aware of the challenge of accurately testing at these intermediate rates,
noting: “At high strain rates the force signal was superimposed by oscillations caused by the
inertia of the test equipment making the direct determination of characteristic values
impossible. Therefore a cubic spline was utilized to approximate the unfiltered stress-strain
signal...”. In spite of these limitations, their compiled results provide a snapshot as to the
possible expectations for changes in mechanical behavior at intermediate rates. As shown in
Figure 1, their study examined the strain-rate sensitivity of a wide range of steels including
austenitic stainless steels (1.4301, 1.4318), TRIP steel, dual-phase steels (DP600, DP800,
DP1000), a high-strength steel (ZStE340), and a deep-drawing grade (DC04). All of the
alloys showed a similar expected strain-rate dependence on yield strength: shallow at low
rates, and ever steeper with increasing strain rate. The strongest alloy, DP1000 with a yield

                                              7
strength of ~620 MPa at 0.005 s-1, showed the most dramatic strain-rate sensitivity on yield
strength, increasing to 900 MPa at the dynamic rate ~200 s-1. Ductility behavior was less
consistent: the austenitic stainless alloys showed marked loss of ductility as strain rate rose
from 0.005 s-1 to 1 s-1, whereas other alloys either showed essentially no ductility change, or
only showed significant changes in ductility at the faster strain rates. The previous study on
behavior of steels in the sub-Hopkinson regime suggests that these alloys become most
strain-rate sensitive only at the highest strain-rates approaching ~200 s-1. Thus, had their
study only extended to 10 s-1, a typical limit for many previous conventional strain-rate
sensitivity studies, much of the dynamic strengthening effect would not have been observed.
This result provides additional motiviation for characterizing the mechanical response of
impact-susceptible structural materials at the strain-rates of relevance.
DC04
ZStE340
DP600
1000 120 DP800
TRIP
DC04 DP1000
ZstE30 DP1000 1.4301
900 DP600 100 1.4318
DP800
Total Elongation (%)
Yield Strength (MPa)
TRIP 1.4301
800 DP1000
1.4301 80
1.4318
1.4318
700
DP800
60 ZStE340
1.4318
600
DC04
TRIP 40 TRIP
500 ZStE340 DP600
DP600
DC04
1.4301 20 DP800
400 DP1000
300 0
0.001 0.01 0.1 1 10 100 1000 0.001 0.01 0.1 1 10 100 1000
Strain Rate (1/s) Strain Rate (1/s)
Figure 1. Strain-rate sensitivity in the sub-Hopkinson regime for several European ferrous
alloys. Based on Ref. [1].
2. Materials
Four high-strength steel alloys were considered in this evaluation: one commercial
alloy, Aermet 100; two modified alloys based on commercially available products: 4340M
(modified based on AISI 4340) and 9420M (modified based on HP9-4-20); and one newly
developed graded, ES-1c. The compositions of the alloys are listed in Table 1. Aermet 100
was supplied by Carpeneter Steel and the other three alloys were obtained as development
heats by AFRL. Each of these four alloys are under consideration for emerging earth
penetrating munitions applications.
8Table 1. Composition of four high-strength steel alloys
ES1-c 4340M HP9-4-20M Aermet 100
C 0.26 0.33 0.18 0.22
Mn 0.65 0.75 0.3 0.01
Si 1 0.25 0.03
Ni 1 2.3 9 11.22
Cr 2.6 1.1 0.75 3.01
Mo 0.42 0.45 1 1.16
Co 4.5 13.46
W 1.0
V 0.07 0.1 0.12
The heat treatments used for the alloys are as follows:
ES1-C (1) Ramp temperature to 1200F@220F/hour and hold for 5 hours, ramp to
austentizing temperature of 1750F@220F/hour; hold for 20 minutes for the first inch of
thickness and increase the hold temperature by 10 minutes/inch for each additional inch of
thickness (minimum hold temperature of 30 minutes.). (2) Oil quench to 200F and place in
400F furnace. Increase tempering temperature to 500F@100F/hour and hold for 4 hours, air
cool.
4340M (1) Ramp to normalizing temperature of 1650F@220F/hour; hold for 1 hour for
the first inch of thickness and increase the hold temperature by 1 hour/inch for each
additional inch of thickness (minimum hold temperature of 1 hour) and air cool. Ramp to
the austentizing temperature of 1525F@220F/hour; hold for 1 hour for the first inch of
thickness and increase the hold temperature by 1 hour/inch for each additional inch of
thickness (minimum hold temperature of 1 hour). (2) Oil quench to 200F and place in 500F
furnace; increase tempering temperature to 925F@100F/hour and hold for 3 hours, air cool.
HP9-4-20M (1) Ramp to normalizing temperature of 1650F@220F/hour; hold for 1 hour
for the first inch of thickness and increase the hold temperature by 1 hour/inch for each
additional inch of thickness (minimum hold temperature of 1 hour) and air cool. Ramp to
the austentizing temperature of 1550F@220F/hour; hold for 1 hour for the first inch of
thickness and increase the hold temperature by 1 hour/inch for each additional inch of
thickness (minimum hold temperature of 1 hour). (2) Oil quench to 200F and place in 500F
furnace; increase tempering temperature to 1050F@100F/hour and hold for 3 hours, air cool.
9Aermet 100 Ingot supplied are vacuum induction melted/vacuum arc re-melted
(VIM/VAR). Ramp furnace to the austentizing temperature of 1625F and hold for 1 hour,
air cool, refrigerate at -100F for 1 hour, air warm, temper at 900F for 5hours and air cool.
Aermet 100 (UNS K92580) is presently the “gold standard” for steels possessing a
combination of exceptionally high strength and toughness. Aermet 100 is a one of the
newest alloys in a lineage of secondary hardening Ni-Cr-Mo-Co steels, originally developed
in the early 1970’s, including HP9-4-20, HY180, AF1410, and Aermet 310. The alloying
elements in these Ni-Cr-Mo-Co steels impart the high strength and high toughness while
maintaining admirable stress-corrosion cracking properties (KIscc ~35 ksi√in for Aermet
100), good hardenability for large section sizes, and good weldability. These alloys
typically contain 9-11% Ni, which improves toughness, improves strength by solid solution,
promotes hardenability, and lowers the ductile-to-brittle transition temperature to well below
room temperature. Cr and Mo promote hardenability and strength without contributing to
embrittlement. Co additions result in a much more pronounced secondary-hardening peak,
thereby contributing substantially to strength for tempering temperatures in excess of 400°F.
Further details of the metallurgy associated with these steels can be found in Ref. [2].
The primary limiting factor in the selection of Aermet 100 for many structural
applications is the cost. In 2002, the ingot price for Aermet 100 was ~$10/lb. This cost is
largely driven by the cost of expensive alloying elements, i.e. cobalt and nickel, and also by
the proprietary
protection of the
alloy. HP9-4-20, an
alternative alloy
from the same
genre as Aermet
100 with less nickel
and cobalt, costs Figure 2. Cylindrical threaded tensile bar design. Dimensions
less than half that of are in inches.
Aermet 100, and
therefore receives consideration in spite of its somewhat diminished strength values. More
traditional quench and temper steels, such as 4340 (UNS J24055) can provide reasonable
combinations of strength and toughness at a much reduced cost due to the lack of expensive
alloying elements, and the relatively simple processing requirements.
103. Testing Method
Cylindrical threaded dogbone tensile bars were extracted from the longitudinal axis
of parent billet material, as shown in Fig. 2. The gage section of the tensile bars was only
0.5 inches long so that a strain rate of ~200 s-1 could be obtained for a displacement rate of
100 inch/s.
All tensile tests were performed on a MTS servohydraulic loadframe controlled by
an MTS 458 analog controller; the loadframe includes integrated high-speed actuator and
hydraulic pressure accumulators capable of displacement rates from quasi-static to over 300
inch/s. This servohydraulic tensile method permitted both the load frame configuration and
the specimen design to remain constant at all strain rates ranging from 200
s-1, thereby eliminating potential errors induced by changes in the test set-up. High-speed
tests required a so-called “slack adapter”, shown in Fig. 3, which permitted >2 inches of
actuator travel before load was applied to the tensile bar, so that the actuator could attain its
desired velocity prior to the start of the tensile test.
The most challenging aspect of dynamic tensile testing at strain rates in the range of
10-1000 s-1 is the control and mitigation of dynamic elastic stress waves which propagate
through the specimen, loadcell, and test frame. These stress waves can produce (a)
inhomogeneous stresses within the tensile bar, (b) time-dependent oscillations in stresses
within the tensile bar, and/or (c) apparent time-dependent oscillations in force as measured
by the load cell. To mitigate these effects, a 0.25-inch thick piece of rubber was used at the
interface between the slack-adapter pin and the lower specimen grip which minimized the
generation of high-amplitude elastic stress waves generated by initial impact. Also, two
resonance-resistant custom made load cells were employed directly at either end of the
tensile bar to ensure dynamic equilibrium. These load cells proved to dramatically reduce
apparent force oscillations compared to off-the-shelf dynamic quartz load washers, as shown
in Fig. 4. Further details of the test setup and design can be found in Ref. [3].
11Figure 3. Experimental configuration with two custom load cells and a standard quartz
load cell.
Strain was measured with a Vishay Micromeasurments Group high-elongation
uniaxial strain gage affixed to the middle of the gage section. The load cell and strain gage
signals were conditioned and amplified by a Vishay Micromeasurements Group 2300-series
amplifier. Data was collected by a triggered Tektronix TDS-3014B digital storage
oscilloscope for dynamic tests, or by a Data Translations 12-bit USB data acquisition card
for the slow tests which lasted >60s.
Data analysis is summarized in Fig. 4 using the example of a HyTuf alloy at a
nominal actuator displacement rate of 280”/sec. Fig. 4a shows the force-time profile from
both upper and lower custom-made load cells, showing reasonably good agreement and
minimal oscillations compared to the off-the-shelf quartz cell. This plot also shows the
linear displacement-time profile for the actuator travel. The entire duration of the test from
elastic loading to fracture was less than 0.5 ms. In Figs. 4b-d, a similar test is shown with
data from a high-elongation strain gage attached to the gage-section of the test sample. In
Fig. 4b, the strain signal is non-linear during initial load up, as the rubber pad is compressed.
This ramp in strain-rate during elastic loading dampens inertial shock in the system. From
this direct measure of strain, we can determine that the strain-rate at yield in the gage section
was ~500 s-1, which is consistent with the displacement rate of 280”/sec and the gage length
of 0.5”. Figs 4c and 4d show the engineering stress-strain behavior and the extraction of the
0.2% offset yield strength, respectively.
12Post-mortem fractographic analysis was performed with a JEOL JSM-5900LV
scanning electron microscope (SEM) with a tungsten filament. Also, reduction in area and
total elongation of the tensile bars were determined using optical metrology on fiduciaries
within the gage section.
Figure 4. (a) Force-time profile from a tensile test on a Hy-Tuf alloy at a displacement
rate of ~280”/sec showing the improved quality of the custom load cells over the quartz
load cells and showing the linearity of the displacement ramp over the test duration. (b)
Force-time profile from a similar test at 280”/sec on Hytuf showing the strain signal from
the gage section, (c) data from (b) plotted as stress-strain, (d) 0.2% offset line used to
determine yield stress.
132500 2500
Aermet 100 4340M
2000 2000
Engineering Stress (MPa)
Engineering Stress (MPa)
1500 1500
200 [1/s]
1000 1000 1 [1/s]
1 [1/s]
0.005 [1/s]
0.005 [1/s]
500 500 0.0002 [1/s]
200 [1/s]
0.0002 [1/s]
1 [1/s]
0.005 [1/s] 0.0002 [1/s]
0.0002 [1/s] 0.0002 [1/s]
0 0
0 2 4 6 8 10 0 2 4 6 8 10
Engineering Strain (%) Engineering Strain (%)
2500 2500
9420M ES-1C
2000 2000
Engineering Stress (MPa)
Engineering Stress (MPa)
1500 1500
1000 1000
200 [1/s]
200 [1/s] 200 [1/s]
200 [1/s]
1 [1/s]
1 [1/s] 1 [1/s]
500 1 [1/s] 500
0.005 [1/s]
0.005 [1/s] 0.005 [1/s]
0.005 [1/s] 0.0002 [1/s]
0.0002 [1/s] 0.0002 [1/s]
0.0002 [1/s]
0 0
0 2 4 6 8 10 0 2 4 6 8 10
Engineering Strain (%) Engineering Strain (%)
Figure 5. Engineering stress-strain curves for the four high-strength steel alloys under
evaluation at strain rates ranging from 0.0002 s-1 to 200 s-1.
4. Results
The engineering stress-strain curves obtained on each of the four alloys are shown in
Figure 5 for strain rates ranging from quasi-static (0.0002 s-1) to dynamic (200 s-1). The data
shown in Figure 5 only extend to strains of 10%: the high-elongation strain gages were
unreliable at higher strains, which prevented the determination of the entire stress-strain
curve. For the three of the alloys supplied by AFRL (4340M, HP9-4-20M, and ES-1c), at
least two tests were completed for each test condition, thereby providing evidence of
reproducibility. It is clear from this Figure that all four alloys showed a slight increase in
14yield strength with strain rate over the 6 orders of magnitude that were spanned in this study.
The strength increase, while small, could be clearly distinguished from specimen-to-
specimen scatter. Work-hardening rate appeared to be largely unaffected by strain-rate.
Also, other characteristic features were seen at all strain-rates: for example, ES1-c showed
noticeable curvature in the stress-strain curve at yield whereas 9420M showed a sharp
transition from elasticity to plasticity.
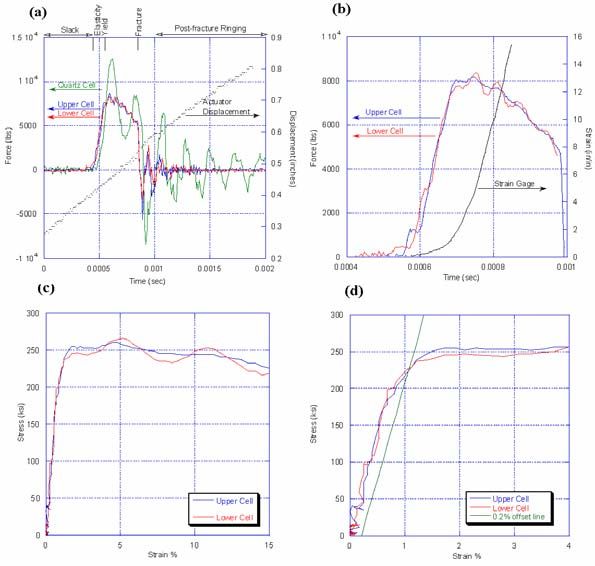
A more succinct picture of the strain-rate sensitivity of these alloys can be obtained
by examining the trends in yield and ultimate strength as a function of strain-rate, shown in
Figure 6. For each of these trends, a somewhat arbitrary trendline is included to help
distinguish the datasets. From this plot, each of the four alloys show a ~150 MPa increase in
yield strength from 0.0002 s-1 to 200 s-1, and a somewhat smaller increase in ultimate
strength over the same range. 4340M, HP9-4-20M, and ES-1c all showed the expected non-
linear strain-rate trend which was shallow at lower strain rates and steeper at the higher
strain rates. Aermet 100 appeared to show a somewhat discontinuous jump in strength at
intermediate strain rates, although its actual trend may be less obvious due to the lack of test
repetitions.
This figure also includes the strain-rate dependence of ductility, as described by the
reduction in cross-sectional area of the necked region observed after fracture. From this
Figure, there are some distinct alloy-dependent differences in strain-rate sensitivity on
ductility. Specifically, Aermet 100, HP9-4-20M, and 4340M all show slight-to-moderate
loss in ductility as strain-rates increase from quasi-static to dynamic. Aermet 100, which
shows the most significant loss of ductility, merely falls from 69% to 61% reduction in area
over 6 orders of magnitude in strain-rate. The modest loss of ductility in these alloys is
somewhat expected, in correspondence to observed increases in strength. Surprisingly, the
ES-1c alloy actually showed significant gains in ductility with strain rate: with reduction-in-
area rising from 40% to ~51% over the strain-rate range. These trends will be discussed in
the following section.
The fracture surfaces were inspected in the SEM to observe strain-rate dependent
changes in fractography. In all cases, the cylindrical tensile bars resulted in a cup-and-cone
fracture morphology. In general, the cup-and-cone morphology, illustrated in Figure 7,
consists of a “fibrous zone” at the center of the tensile bar associated with early coalescence
15Displacement Rate (in/s) and slow, stable crack growth, a “radial
-6 -5
10 10 0.0001 0.001 0.01 0.1 1 10 100
2000
zone” emanating away from the fibrous
zone corresponding to fast, unstable crack
1800
propagation, and a “shear-lip zone”
around the rim of fracture associated with
Yield Strength (MPa)
1600
final failure dictated by the planes of
maximum shear ahead of the growing
crack tip.
1400
The observed low-magnification
1200
fracture surfaces for each of the four
alloys are shown in Figure 8 for four
2200
1000
strain-rates. Both 4340M and HP9-4-
2000 20M exhibit dramatic “radial marks” in
the radial zone at slow strain rates, which
Ultimate Strength (MPa)
1800 are not apparent at the faster strain-rates.
In the other two alloys, ES-1c and Aermet
1600
100, there are no dramatic radial marks at
1400
any strain rate. The only strain-rate
dependent fractographic characteristic
1200 that was consistent among all four alloys
was the relative size of the shear lip,
1000
75
which grows with increasing strain rate.
70
65
Reduction In Area (%)
60
55
50
45
Aermet 100
40 4340M
9420M
ES-1C
35
-5
10 0.0001 0.001 0.01 0.1 1 10 100 1000
Figure 7. Schematic of the typical zones
Strain Rate (1/s) associated with failure of cylindrical tensile
Figure 6. Tensile property strain-rate trends. bars in moderately ductile metals. From [5].
1617
18
An accompanying set of higher magnification fractographs were included to assess
the morphology of the fibrous zones, as shown in Figure 9. In general, all conditions
resulted in a typical microvoid coalescence morphology expected in ductile metal fracture.
There were subtle differences in the dimple size from alloy-to-alloy but these dimple sizes
did not appear to show a notable strain-rate sensitivity. The only condition that differed
significantly in morphology from the others was the slowest strain-rate of the ES-1c alloy
(lower-left of Figure 9), where the dimples were less pronounced and more cleavage-like,
consistent with the lowest ductility (40% reduction-in-area) observed in that alloy at that
strain-rate.

5. Discussion: Constitutive Models for Strain-Rate
Sensitivity
        The most common generalized description of strain-rate sensitivity is of the
following form:
                                            σ = Kε& m
where the material’s flow stress, σ, is a function of the strain-rate ε& , material constant K,
and strain-rate sensitivity factor m. This relationship presumes a linear relationship between
the flow stress and the logarithm of strain-rate. A least squares fit of the yield strength
variation with strain-rate is shown for each of the four alloys in Figure 10. Among the four
alloys, the strain-rate sensitivity factors m are similar, ranging from 0.004-0.007. These
values are quite low compared to most metals which typically fall in the range of 0.02 to 0.2
[4]. It is interesting to note that both the present results, and the prior work of Bleck and
Schael shown in Figure 1 exhibit a generally nonlinear trend: the strain-rate sensitivity is
shallow at slow strain-rates and appears to rise with increasing strain-rate. Such a
relationship is not predicted by the previous equation. This super-exponential strain-rate
sensitivity has also been seen in other studies such as the compression testing of interstitial
free steel [6].

        Perhaps the clearest picture of the super-exponential behavior was found in the work
of Campbell and Ferguson in 1970 [7]. They examined strain-rate sensitivity of mild steel at
a range of temperatures from 195-713K. Based on their observations they suggested that at
strain-rates below ~5000 s-1, there were two regimes of strain-rate sensitivity. At slower-
strain rates or higher temperatures, flow is controlled by long-range obstacles to dislocation
motion (Region I) and is largely strain-rate insensitive. At lower temperatures or higher

                                             19
strain-rates, weaker short range 2000
obstacles become controlling due to
m = 0.0039
the time-dependent diffusion-limited
1800
mechanisms such as climb which are
Yield Strength (MPa)
necessary to overcome these short-
1600
range obstacles (Region II), leading
m = 0.0053
to a stronger strain-rate dependence.
1400
m = 0.0070
There are many constitutive
m = 0.0068
flow models which include strain- 1200
Aermet 100
4340M
rate sensitivity, including the 9420M
ES-1C
Johnson-Cook model, Zerilli- 1000
-5
10 0.0001 0.001 0.01 0.1 1 10 100 1000
Armstrong Model, Mechanical Strain Rate (1/s)
Threshold Stress Model, and the BCJ Figure 10. A traditional exponential
Model. Within the limited range of relationship between the strain-rate and the yield
the present study, a thorough strength produces an approximate description of
observed behavior.
evaluation of these models is not
productive. However, a much more
complete summary of these models is included in a strain-rate sensitivity study on sheet
steels [8].
6. Summary: Implications for Designers
Designers typically select alloys based on their quasi-static properties, and assess
their designs, such as through the use of finite elements, based on these same quasi-static
properties. The present results highlight that the four high-strength steels experience only
modest degrees of strain-rate sensitivity. This observation has also recently been made on
other high-strength high-toughness steels, including AF1410, PH13-8 Supertough, Hytuf,
and conventional HP9-4-20. Specifically, these alloys only exhibit a ~10% increase in yield
strength when strain-rates are increased from quasi-static to 200 s-1, and their work-
hardening rate is essentially unaffected by strain-rate. This is in distinct contrast to recent
results on a very different metallic alloy, eutectic lead-tin solder, where the same range in
strain-rates causes a 100% increase in yield-strength. Based on these observations, the use of
quasi-static property data for assessing these steels seems reasonable. In the case of the
high-strength steels, the small changes in their flow constitutive curve could be incorporated
20into future finite element models for slightly increased fidelity. Certainly the very weak
strain-rate dependence in these high-strength steels would be no cause for reassessing
material selection. Perhaps the most notable consideration in materials selection is the
observation that while Aermet100 and HP9-4-20M exhibited a ~10% loss of tensile
ductility, the developmental ES-1c alloy exhibited a ~25% gain in tensile ductility at the
fastest strain rate of 200 s-1 compared to the slowest rate of 0.0002 s-1, a trend which defies
explanation based on this study alone. Nevertheless, the Aermet 100 and HP9-4-20M alloys
still retain more ductility at 200 s-1 than the other two alloys – so materials selection would
still favor these alloys in spite of their strain-rate dependent loss in ductility. This does
suggest that the materials fracture toughness may itself be diminishing with strain-rate: a
possibility which will be examined in a future study.
7. References
1. W. Bleck and I. Schael, “Determination of crash-relevant material parameters by
dynamic tensile tests”, Steel Research, vol.71, no.5, p.173-8, 2000.
2. B.L. Boyce, C.V. Robino, J. Hickerson, and M. Dillmore, “Survey of Case Materials for
Earth Penetrating Weapons”, Sandia National Laboratories report, SAND2004-1680, 2004.
3. B.L. Boyce and T.B. Crenshaw, “Servohydraulic methods for mechanical testing in the
sub-Hopkinson rate regime up to strain rates of 500 1/s”, Sandia National Laboratories
report, SAND2005-5678, 2005.
4. R.W. Hertzberg, Deformation and Fracture Mecahncis of Engineering Materials, 3rd
Edition, John Wiley & Sons, New York, 1989.
5. Metals Handbook, Vol. 9 Fractography and Atlas of Fractographs, 8th Edition, American
Society for Metals, 1974.
6. M. Militsky, “Effects of pre-strain on the mecahncial properties of low-carbon steels
tested over a wide range of strain rates,” M.S. Thesis, Colorado School of Mines, 2000.
7. J.D. Campbell and W.G. Ferguson, “The temperature and strain-rate dependence of the
shear strength of mild steel”, Phil. Mag., vol. 21, 1970, pp. 63-82.
8. D. Bruce, “Dynamic tensile testing of sheet steels and influence of strain rate on
strengthening mechanisms in sheet steels”, Ph.D. Thesis, Colorado School of Mines, 2003.
21Distribution
10 MS0889 Brad L. Boyce 1824
1 MS1159 Scott C. Jones 1344
1 MS0889 John J. Stephens 1825
5 MS1160 Vincent K. Luk 5431
1 Michael J. Forrestal 2123
1 MS0325 Danny J. Frew 2615
1 MS0889 Jon Custer 1824
1 MS0889 F. Michael Hosking 1813
3 MS0889 Thomas Crenshaw 1824
2 MS9018 Central Technical Files 8944
2 MS0899 Technical Library 4536
1 MS0161 Patent & Licensing Office 11500
1 MS0123 LDRD Donna Chavez 1011
1 Morris Dilmore (AFRL)
5948 Jack Stokes Road
Baker, FL 32531
22You can also read