City of Wanneroo Climate Change Adaptation and Mitigation Strategy 2016-2020
←
→
Page content transcription
If your browser does not render page correctly, please read the page content below
City of Wanneroo

Climate Change Adaptation and
      Mitigation Strategy
         2016-2020

              1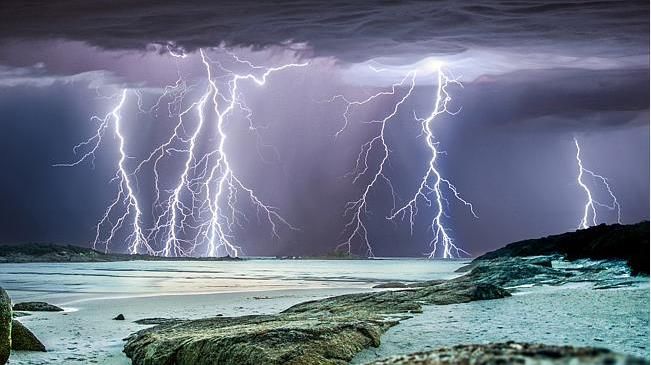
Table of Contents
EXECUTIVE SUMMARY ............................................................................................................................ 3
1.     Background ..................................................................................................................................... 4
     1.1.      Purpose ................................................................................................................................... 6
     1.2.      Climate Change ....................................................................................................................... 7
     1.3.      City of Wanneroo and Climate Change ................................................................................... 8
2.     Risk Identification Process and Workshops .................................................................................. 12
     2.1.      Risk Assessment Approach ................................................................................................... 12
     2.2.      Action Identification Process ................................................................................................ 12
3.     Risk Management and Adaptation Actions ................................................................................... 13
4.     Implementation ............................................................................................................................ 18
References ............................................................................................................................................ 19

                                                                            2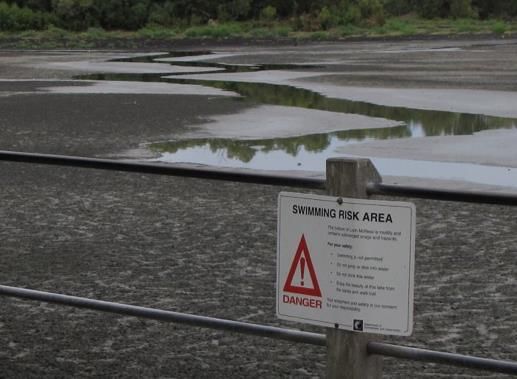
EXECUTIVE SUMMARY
City of Wanneroo Strategic Community Plan 2013/14 to 2022/231 aspires to achieve "a
sustainable natural, built and healthy environment". In response to this community vision, an
action within the City of Wanneroo Corporate Business Plan2 has been the preparation of
this report, the Climate Change Adaptation and Mitigation Strategy (CCAMS).

The purpose of the CCAMS is to identify areas where the City of Wanneroo and the
community it represents are exposed to the effects of climate change and provide risk
management adaptation measures to reduce the risk.

In Western Australia, the CSIRO predicts climate change to result in hotter days and nights;
reduced rainfall in the southern region, but more intense rain periods; more extreme weather
conditions such as long periods of drought and severe storms; more bushfires; and rising
sea levels3. It is expected that the City of Wanneroo will be affected by these impacts.

The CCAMS looks specifically at adaptation; the ways the City of Wanneroo can adapt to,
and be prepared for the unavoidable impacts of climate change as they arise. The CCAMS
outlines the adaptation actions that are required to be implemented across the City and the
required timeframes needed for successful implementation.

The City's Risk Management Framework has been used to identify effective management
measures for the risks associated with climate change. The Risk Management Framework
will assist in the implementation of the CCAMS adaptation actions and will allow for efficient
allocation of resources addressing issues of utmost importance.

                                              3
1. Background
The City of Wanneroo recognises and acknowledges the risk that climate change presents
to its local residents and the wider global community. To date, the City has made significant
progress in terms of reducing its impact on climate change through a number of key
initiatives.

The City’s Local Environment Plan 2009-144 promoted a focus on reducing greenhouse gas
emissions. This vision was realised with the inception of the Sustainability Investment Fund
Reserve (SIF) in 2010. The fund has been particularly successful in reducing energy and
greenhouse gas emissions. The role of the SIF is to fund initiatives aimed at reducing the
City’s environmental footprint and reducing the City’s energy bills. Utility cost savings
accrued by SIF projects are redirected back into the fund for future use.

The City has funded large scale solar panel systems at high energy usage sites that had
been identified as having ideal conditions for solar panel investment. These include the Civic
Centre, Aquamotion, Kingsway Sporting Complex and Clarkson Library. This has ensured
the City is less reliant on coal fired electricity and has provided a public demonstration of
Council’s commitment to the environment - achieving environmental outcomes in a
financially viable way.

In more recent times, the City has diversified its investment in the future by installing a
voltage optimisation system at Aquamotion. This electrical energy saving device is further
cutting the City’s energy usage by ensuring less energy is wasted within the facility. The new
equipment is expected to have a short financial pay-back period of less than two years.

The City of Wanneroo made a very public commitment to sustainability in 2011, jointly
sponsoring the design and build of the award winning EcoVision display homes. The two
homes showcased best practice affordable and sustainable design options including water
conservation, greywater recycling, photovoltaics, healthy home principles and universal
design. The homes were open to the public for 12 months and took out numerous awards
including the National Greensmart Award for the Sustainable Townhouse/ Villa category.

Looking towards the future, the planned Civic Centre extension project has a high level of
sustainable inclusions. These include passive solar design orientation, solar panels, energy
efficient lighting and sunshades (reducing the need for air conditioning). All of these features
will ensure less reliance on coal fired electricity. The running costs will be lower and the
comfort of occupants will be maximised for the life of the building.

In addition, the table below outlines some current measures by the City to address impacts
of climate change:

                                               4
Risk Current Actions Related Impact
Increasing Implementation of Local Emergency Increased potential
temperature Management and Recovery Plans; for bushfires
Annual bushfire awareness community
day;
Annual review of current emergency
management risks within the City;
Quarterly local Emergency Management
Committee meetings with all relevant
agencies; and
Fire Protection Officers employed by the
City.
Increasing Annual tree planting programs Increase in surface
temperature implemented at various sites around the temperature
City including wetlands, bushlands,
foreshore and parks/reserves;
Preparation of Streetscapes local planning
policy; and
Review of Tree Preservation Policy.
Reducing rainfall Implementation of Hydrozoning program Reduced water
involving the staged replacement of availability for park
irrigation systems in parks and reserves, areas
to ensure water is used more effectively
throughout parks; and
Preparation and implementation of North
West Corridor Water Supply Strategy (with
Department of Water).
Extreme weather Photographic monitoring following extreme More intense
events storm events at Quinns Beach, Two Rocks storms
and Yanchep Lagoon to monitor coastal
erosion; and
Regular sand nourishment along areas of
the City’s coastline subject to coastal
erosion.
Sea Level rise Photographic monitoring and survey of Storm surges and
beach levels twice yearly at Quinns flooding
Beach, Two Rocks and Yanchep Lagoon
to monitor long term coastal erosion;
Preparation of Coastal Assets Policy.
In addition to the above the City intends to prepare an Energy Reduction Plan (see Action
1.9) that will seek to reduce the City’s energy use and encourage the City’s community to
reduce their greenhouse gas emissions.
Through consultation with its residents, the City had identified the need to have a stronger
vision around responding to climate change. This conversation, which is an ongoing one, led
to the creation of this strategy.
5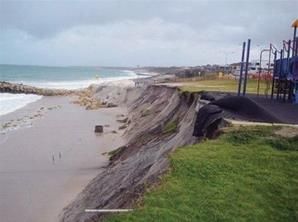
1.1.      Purpose

As a local government, the City of Wanneroo, on behalf of the local community, shares a
responsibility for the management of risks to public assets (including the natural
environment). This involves service delivery and creating an institutional and regulatory
environment that promotes and supports private adaptation to climate change.

Professor Palutikof, Director of the National Climate Change Adaptation Research Facility states:
    “the scientific evidence points strongly that there will be unavoidable climate change even
    though our mitigation efforts can reduce some impacts. As Australia’s climate changes in
  increasingly significant ways over the coming decades we need to be sure that we are ready
                                              (2013)20.”

Scientists have been encouraging risk management and adaptation strategies, along with
promoting the reduction in greenhouse gas emissions, so that we are prepared for climate
change5. As local governments are at the forefront in dealing with the impacts of climate
change, innovative planning is essential.

Figure 2 below highlights the relationship between the City's Strategic Community Plan
2013/14 – 2022/23 and the Corporate Business Plan 2015/16-2018/19 that have identified
the need for this Climate Change Adaptation and Mitigation Strategy.

                                                                 Strategic Community Plan
                                                                     2013/14-2022/23
                                                                        (Strategies)

              Strategic Community Plan                           SCP Environmental Pillar
                  Schedules for 2016
                                                                     Strategy 1.15
                                                               Minimise impacts of climate
                                                                         change

                                                                  Corporate Business Plan
                                                                     2015/16-2018/19
                                                                         (Actions)

                                                                      Action 1.1 (f)
                                                                Prepare a Climate Change
                                                                Adaptation and Mitigation
                                                                        Strategy

Figure 1 - City of Wanneroo Climate Change Adaptation and Mitigation Strategy strategic alignment.

Adaptation to climate change means taking action to adjust to the changes in the climate
that are already underway such as temperature increases, reduced rainfall and extreme
weather events and to plan and prepare for the risk of bigger changes in the future, and
resulting impacts such as sea level rise.
                                          6
The Intergovernmental Panel on Climate Change (IPCC) defines climate
adaptation as: "an adjustment in natural or human systems in response to
actual or expected climatic stimuli or their effects, which moderates harm or
exploits beneficial opportunities (2011).6 "
6
The City of Wanneroo’s main priority is to adapt to the impacts of climate change that are
predicted to be of a large scale and are inevitable, with or without the City reducing its
contribution to greenhouse emissions.
The CSIRO defines mitigation as actions that aim to reduce the amount of climate change,
typically by limiting the future increases in concentrations of greenhouse gases in the
atmosphere7. Accordingly, the City of Wanneroo has a social responsibility to take further
steps to reduce its contribution of greenhouse gases that are causing these changes in the
climate.
By implementing adaptation actions to reduce climate change impacts, the City will also
indirectly reduce its overall contribution to greenhouse gas emissions, resulting in mitigation.
For instance, an adaptive action to cope with a hotter climate, such as planting trees around
a Council building, may also reduce the need for air-conditioning use to ensure comfort to
the building's occupants. Consequently, the reduced energy consumption leads to a
reduction in greenhouse gases. This scenario is outlined in Figure 3 below.
City of Wanneroo
prepared for climate
change impacts
Climate Change Risk
Management Adaptation Actions
Adaptation Plan
Indirectly leads to
Mitigation outcomes
Figure 2 CCAMS outcomes.
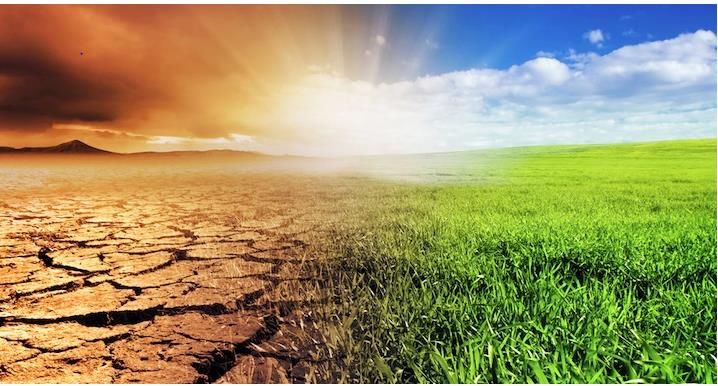
1.2. Climate Change
Over the last 100 years, the globe has warmed by approximately 0.75°C. Major contributors
to this warming are human activities, including the burning of fossil fuels that have released
large quantities of greenhouse gases in the atmosphere8. These gases become trapped
within the lower atmosphere increasing the temperature of the global climate. Glaciers are
melting, sea levels are rising, rainfall patterns are changing and extreme weather events,
while becoming less frequent, are becoming more intense9.
Over the past 50 years in Australia there has been an increase in heatwaves, less rain, less
frosts, increase in droughts, and a slight rise in sea level. Many of the Australian population
have seen these changes in their daily lives, through effects such as higher fresh food prices
and water restrictions10.
The following diagram outlines the expected climate change impacts in Western Australia.
7Impacts of Climate
Bushfires will
80% increase in Change in WA
drought months become more
by 2070 frequent and
severe
Since 1960, the
natural disaster Sea level rise of 1.1m by
events have tripled 2100 is predicted and could
and are predicted to potentially impact up to
increase 30,000 residential buildings
Days above 35°C are
Extreme high
predicted to increase
temperatures will
from 28 days to up to
contribute to more human
67 days per year by Wheat production is deaths related to
2070 predicted to decline by respiratory and
13.4% by 2050 with a cardiovascular disease
similar decline in meat
availability
Figure 3 Impacts of Climate Change in WA (Sourced from World Health Organisation8 and Department of Environment12).
1.3. City of Wanneroo and Climate Change
The City of Wanneroo will experience numerous impacts resulting from the changing
climate. This section details the changes in temperature, rainfall, extreme weather and sea
level and outlines how these changes may impact the City of Wanneroo.
Temperature
Wanneroo’s average temperature has increased since 1910 in line with the Perth average
and is predicted to continue rising. Perth's temperature has increased by 1.0 to 1.5°C during
1910 to 20138. The average temperature is predicted to increase between 0.5 to 2.1°C by
2030. If greenhouse gas emissions continue to grow at rates consistent with past trends,
warming is projected to be in the range of 1.0 to 6.0°C by 207011. There will also be weaker
westerly winds and a reduction in their associated cooling effect. These trends are expected
to continue until 20509.
8The following impacts and consequences are predicted to affect the City of Wanneroo both
in the immediate and long term future as a result from the predicted increase in temperature:
Impacts Consequences
Increased risk
Increase in home evacuations to recovery centres;
of bushfires.12
Access blockage on major arterial roads and train lines;
Death of people unable to evacuate;
Disruption to the biodiversity cycle resulting in biodiversity loss;
Increase in weed invasion;
Impact upon water quality;
Damage to council facilities and property;
Damage to street lighting; and
Loss of power.
Impacts upon
Rise in food poisoning cases;
human health12.
Increase in mosquito borne diseases; and
A rise in heat stress and mental health issues particularly on
vulnerable groups such as elderly and children, which will result in
increased pressure on medical facilities12.
An increase in
Potential air conditioner malfunction due to overuse;
surface
temperature12. Financial stress (cost of transport and cooling); and
Impacts on transport systems (buckling of rail lines and road wear and
tear).
Damage to
Increase in food costs and an overall reduction in productivity that will
agricultural
see changes in the agricultural industry; and
crops12.
Subsequent impacts on land use, economy and employment12.
Table 1 Increased temperature impacts and consequences.
Rainfall
Autumn and winter seasonal rainfall throughout the Perth Metropolitan area, including the
City of Wanneroo, has declined by 20 per cent over the past 60 years. This drying trend has
intensified over the last 10 years13. The City of Wanneroo could experience a further 20 per
cent reduction (from present) in rainfall by 2050 and a further 30 per cent reduction by the
end-of-century13.
Decreasing rainfall is contributing to the reduction of ground water levels held in the
Gnangara water mound. This is reflected in related wetlands, including Lake Joondalup and
Loch McNess (Yanchep National Park), with lowering water levels, exposed acid sulphate
soils, water quality deterioration and negative ecological impacts.14 The following table
presents the impacts and consequences that are predicted to affect the City of Wanneroo:
Impacts Consequences
Reduced water
Reduced turf quality of playing fields and park closures affecting
availability for
community health and lifestyle.
park areas12
Increasing cost to
As water supply reduces the price is likely to increase.
deliver services12
Table 2 Reduction of rainfall impacts and consequences.
9Extreme Weather
Drought-months (months without rainfall) are predicted to increase by 40 per cent by 2030
and 80 per cent by 207015. This will consequently increase the number of fire-weather risk
days.
During the period of 1958 to 2011, hot spells have become more frequent (increasing from
an average 6 events to 8 events per year) however the average duration of each hot spell
has declined (from 2 days to 1.5 days)16.
A decrease in deep troughs has caused an increase in large scale weather systems17. In
addition, CSIRO has predicted an increase in the intensity of storm events causing more
flash flooding and an increase in wind speed, damaging infrastructure and
telecommunications13. Impacts and consequences are:
Impacts Consequences
More intense
Damage to vegetation causing hazards for people and animals (for
storms.
example falling tree branches); and
Road closure. 17
Increase in storm
Beach erosion; and
surge.
Damage to coastal facilities, property and structures. 18
Unexpected
High costs due to damaged infrastructure and buildings; and
extreme weather.
Increased risks to human safety. 19
Table 3 Extreme weather impacts and consequences.
Sea Level
The latest IPCC report modelling suggests a 0.5 to 1.0 metre sea level rise by 2100
compared to 1990 levels.
The City of Wanneroo’s coastline extends 32 kilometres from Tamala Park to Two Rocks
and is characterised by marinas, coastal limestone cliffs, coastal heathland vegetation and
relic sand dune formations (the Quindalup dune system) occurring as beach ridges.
The City of Wanneroo will be impacted by sea levels rising in the following ways:
Impacts Consequences
Storm surges
Erosion and inundation of dune systems;
and flooding.18
Damage and loss of coastal structures including recreational
facilities, marinas and harbours (including the damage and loss of
boats and ships);
Damage to residential and commercial buildings, facilities and parks
resulting in devaluation of private properties and litigation;
Effects on unconfined aquifers and contamination of bores;
Impacts on infrastructure including leakage to septic tanks and
sewer systems, causing instability of swimming pools, tanks and
other subsurface structures that are not anchored; and
Impact on roads and City owned infrastructure.
Table 4 Sea Level Rise Impacts and consequences.
10Conclusion
In summary, the City of Wanneroo has a challenge ahead to ensure its assets and the
community are prepared for the potential impacts of climate change. Effective adaptation
planning is needed to reduce the expected impacts, consequences and risks associated with
climate change.
Figure 5. Climate Change: Crops Wanneroo (Wes Cooper), Loch McNess Dried up (Steve Copsy) and Mental Health (WA
Government).
112. Risk Identification Process and Workshops
A series of internal workshops and meetings were held at the City of Wanneroo to undertake
a risk assessment of the impact climate change poses to the City and to prepare adaptation
actions to enable the City to respond to these consequences and reduce the overall risk of
climate change.
2.1. Risk Assessment Approach
The first workshop required attendees to examine the level of climate change risk for the City
in the areas of temperature, rainfall, extreme weather events and sea level rise. Table 5
illustrates the outcomes of the risk identification workshop. The risk rating refers to the
current risk to the City and would cover a period of 5 years and would need to be
reassessed after this time. Appendix 1 provides information regarding the City's Risk
Management methodology used in this process.
FACTORS CONSEQUENCE LIKELIHOOD RISK RATING
Temperature Minor Almost certain High
Rainfall Minor Likely High
Extreme Weather
Moderate Unlikely Moderate
Events
Sea Level Rise Minor Moderate Moderate
Table 5 City of Wanneroo Risk Assessment Levels.
2.2. Action Identification Process
At the second and final workshop, participants were asked to identify actions that could be
taken to alleviate the major climate change risks to the City of Wanneroo. Policies that may
be updated to address these risks were also identified, along with further correspondence
sought to confirm which service unit was responsible for each action and the timeframe
required. Section 3 summarises the outcomes of both workshops.
123. Risk Management and Adaptation Actions
1. TEMPERATURE RISK RATING:
High
Temperature increase of 2.1°C by 2030
Increased potential for bushfires, impacts on public health, increased stress on
biodiversity, increased surface temperature, damage to agriculture, impacts to
transportation systems and financial costs12.
ACTIONS RESPONSIBILITY RELATED TIME-
IMPACT FRAME
(SERVICE UNIT)
1.1 Prepare and implement a street tree planting
program that identifies priority areas for implementation Parks and
and targets the planting of a minimum number of Conservation
additional trees. Management Impacts upon
3-5 years
human health
1.1.1 Review and update the City’s Tree Preservation City Growth
Policy to address the protection of trees on private land.
1.2 Prepare shade policy that includes tree planting and Community
shade sails for community facilities and parks. Development
(policy) Impacts upon
3-5 years
Infrastructure human health
1.2.1 Implement prioritised program of works.
Capital Works
(Part 2)
1.3 Investigate preparation of a local planning policy
Increase in
and/or guidelines for developers to improve energy
City Growth surface 3-5 years
efficiency performance of the City of Wanneroo’s built
temperature
form.
1.4 Implement a Mosquito Monitoring Program and
public education campaign to reduce the potential Health and Impacts upon
1-2 years
increase of mosquitos and educate the public regarding Compliance human health
mosquitos in the home.
1.5 Create decision support tool to guide investment Infrastructure Increase in
decisions in sustainable technology in alignment to the Capital Works, surface 3-5 years
City's long term financial plan. Strategic Finance temperature
13ACTIONS RESPONSIBILITY RELATED TIME-
IMPACT FRAME
(SERVICE UNIT)
(modelling tool)
1.6 Investigate the use of alternative pathway and road
materials:
Increase in
Strategic Asset
That are durable within high temperatures; Management
surface 3-5 years
Are of a lighter colour to reduce the urban heat temperature
island effect; and
That allow for infiltration i.e. permeable paving.
1.7 Conduct an independent energy audit of the top 20
energy use sites within the City of Wanneroo in order to
identify areas for energy efficiency improvements Increase in
Strategic Asset
(including air-conditioning systems.) surface 3-5 years
Management
temperature
1.7.1 The identified improvements to be gradually
implemented through a prioritised program of works.
1.8 Work with research institutions and local agricultural Advocacy and Increase in
sector to support local business in considering the Economic surface 3-5 years
impact of climate change on food production. Development temperature
1.9 Prepare and implement an Energy Reduction Plan Increase in
to reduce the City’s energy use and encourage our City Growth surface 1-2 years
community to reduce their greenhouse gas emissions. temperature
142. RAINFALL RISK RATING:
High
20% reduction in rainfall by 2050
Reduced water availability for watering park areas affecting the community and
lifestyle, reduced water availability for natural wetlands affecting the natural
environment and an increase in costs to deliver services12.
ACTIONS RESPONSIBILITY RELATED TIME-
IMPACT FRAME
(SERVICE UNIT)
2.1 Investigate best practice technology for irrigation
delivery. Parks and Reduced water
Conservation availability for 3 - 5 years
2.1.1 Review irrigation practices based on this Management park areas
investigation.
2.2. In streetscapes review, assess the standards and
Reduced water
specifications on the amount of permeable surfaces Strategic Asset
availability for 3-5 years
within the city to maximise rainwater capture including Management
park areas
surfaces around street trees and vegetation.
2.3 Complete a comprehensive assessment of water
Strategic Asset Increasing cost
usage within City buildings and surrounds and identify
Management to deliver 3-5 years
key areas for savings.
services
2.4 Review and update the City’s Water Conservation Parks and Increasing cost
Plan including specific reference to best practice Conservation to deliver 3-5 years
irrigation. Management services
Parks and Reduced water
2.5 Investigate opportunities for water reuse and
Conservation availability for 3-5 years
recycling including stormwater.
Management park areas
2.6 Advocate to the Department of Water to properly Reduced water
consider wetland protection in its preparation of the City Growth availability for 3-5 years
Gnangara Groundwater Allocation Policy. park areas
2.7 Advocate to the State Government to prepare final Reduced water
Gnangara Sustainability Strategy to compliment the City Growth availability for 3-5 years
strategic assessment for the Perth Peel region. park areas
153. EXTREME WEATHER EVENTS RISK RATING:
Moderate
Increased wind speed, flooding and hail.
This will cause damage to infrastructure, telecommunications and
the natural and built environment17.
ACTIONS RESPONSIBILITY RELATED TIME-
IMPACT FRAME
(SERVICE UNIT)
3.1 As the need for specific maintenance arises, apply
for State Government funding through the Department Assets More intense
3-5 years
of Transport Coastal Adaptation and Protection Grant Maintenance storms
Program. In addition to:
Implement a coastal monitoring and storm Assets Increase in
3-5 years
response program for the City’s coastline and Maintenance storm surge
associated assets.
Maintenance of beaches (beach nourishment) and Assets Increase in
coastal structures (such as repositioning of rock,
Maintenance storm surge 3-5 years
importing of additional rock, repairs to beach
access points) to be undertaken as required.
3.2 Review the City’s insurance policies to ensure they Strategic and More intense
1 year
adequately treat climate change risks. Business Planning storms
3.3 Review our stormwater design standards adequacy
for proposed new stormwater systems. Strategic Asset More intense
3-5 years
3.3.1 Conduct a risk assessment on current (older) Management storms
stormwater systems.
Please note: Fire is also an identified risk of extreme weather events, however is covered on page 5
‘Table of current actions.’
164. SEA LEVEL RISE RISK RATING:
Moderate
1 metre sea level rise predicted by 2100 compared to 1990 levels.
This will potentially cause inundation of infrastructure in low lying areas, loss of
recreational facilities, litigation, increase in community concern, contamination of
aquifer, damage to coastal structures and beach erosion18.
ACTIONS RESPONSIBILITY RELATED TIME-
IMPACT FRAME
(SERVICE UNIT)
4.1 Engage consultants to complete a Coastal Hazard
Risk Management and Adaptation Plan (CHRMAP) that
will identify areas at risk of sea level rise over the
following two parts: Storm surges
City Growth
and flooding 1 Year
Part 1- Coastal Vulnerability Assessment and
Hazard Mapping; and
Part 2- Hazard Risk Assessment and Adaptation
Planning.
4.2 Investigate incorporating salt resistant materials and
technologies in upgrades of existing and proposed
Infrastructure Storm surges
development of Council owned buildings located in
Capital Works and flooding 3-5 Years
coastal areas subject to direct sea breeze and coastal
erosion.
173. Implementation
In order for the City of Wanneroo to adapt to the predicted impacts of climate change, a
cross-directorate approach is required. City of Wanneroo service units are required to
implement the actions identified in the Risk Management and Adaptation Actions tables by
the required timeframe. In addition to this, close co-operation with relevant state and federal
government departments is essential for achieving desired outcomes.
The City of Wanneroo has a comprehensive risk management process. The actions
identified in section 3, as part of the risk management process, will form part of the City’s
Risk Registers. The Risk Registers categorise the risks and identify which actions are to be
carried out by the responsible service unit and by when. The adaptation actions will form part
of each service unit's plans as part of the integrated planning process.
18References
1
City of Wanneroo, (2013). City of Wanneroo Strategic Community Plan 2013/14 to 2023/24
2
City of Wanneroo, (2015), Corporate Business Plan 2015/16-2018/19
3
CSIRO. (2014). State of the Climate 2014. Retrieved from
http://www.csiro.au/Outcomes/Climate/Understanding/State-of-the-Climate-2014.aspx in
September 2015
4
City of Wanneroo (2009). Local Environment Plan 2009-14
5
CSIRO. (2011). Learning to adapt to future climates. Retrieved from
http://www.csiro.au/Outcomes/Climate/Adapting/Learning-To-Adapt.aspx in September
2015
6
IPCC (n.d) Retrieved from http://www.ipcc.ch/ipccreports/tar/vol4/index.php?idp=204
in September 2015
7
CSIRO, (2011) Climate Change: science and solutions for Australia. Retrieved from
http://www.csiro.au/Outcomes/Climate/Climate-Change-Book.aspx in September
2015
8
World Health Organization (WHO). (2014). Climate Change and Health Fact Sheet.
Retrieved from http://www.who.int/mediacentre/factsheets/fs266/en/ in September
2015
9
CSIRO. (2014). State of the Climate 2014. Retrieved from
http://www.csiro.au/Outcomes/Climate/Understanding/State-of-the-Climate-
2014.aspx in September 2015
10
Quiggin, J. (2010). Drought, Climate Change and food prices. University of Queensland:
School of Economics and School of Political Science and International Studies.
Retrieved from
https://www.acfonline.org.au/sites/default/files/resources/Climate_change_and_food_
prices_in_Australia.pdf in September 2015
11
Indian Ocean Climate Initiative- Western Australia (IOCI). (2011). Projected changes in
our climate. Retrieved from http://www.ioci.org.au/our-climate.html?start=1 in
September 2015
12
Department of the Environment (DoE). (n.d.). Western Australia Climate Change.
Retrieved from http://www.climatechange.gov.au/climate-change/climate-
science/climate-change-impacts/western-australia in September 2015
13
CSIRO. (2012). Western Australia's Weather and climate: a synthesis of Indian Ocean
climate Initiative stage 3 research. Retrieved from
http://www.dec.wa.gov.au/publications/2/doc_download/7992-western-australia-s-
weather-and-climate-a-synthesis-of-indian-ocean-climate-initiative-stage-3-
research.html in September 2015
1914
Hill, A., & Scott, B. (n.d.) Rainfall Patterns over the Gnangara Mound. School of
Environmental Science, Division of Science and Engineering, Murdoch University,
Perth.
15
Department of Environment (DoE). (n.d.). Western Australia: Climate change impacts in
WA. Retrieved from http://www.climatechange.gov.au in September 2015
16
CSIRO. (2012). Western Australia's Weather and climate: a synthesis of Indian Ocean
climate Initiative stage 3 research. Retrieved from
http://www.dec.wa.gov.au/publications/2/doc_download/7992-western-australia-s-
weather-and-climate-a-synthesis-of-indian-ocean-climate-initiative-stage-3-research.html in
September 2015
17
CSIRO. (2007). Climate Change in Australia: Technical Report. Retrieved from
http://www.csiro.au/Organisation-Structure/Divisions/Marine--Atmospheric-
Research/Climate-Change-Technical-Report-2007.aspx in September 2015
18
Intergovernmental Panel on Climate Change (IPCC). (2007). IPCC Fourth Assessment
Report: Climate Change. Retrieved from
http://www.ipcc.ch/publications_and_data/ar4/syr/en/contents.html in September
2015
19
CSIRO. (2007). Climate Change in Australia: Technical Report. Retrieved from
http://www.csiro.au/Organisation-Structure/Divisions/Marine--Atmospheric-
Research/Climate-Change-Technical-Report-2007.aspx in September 2015
20
NCCARF. (2013).NCCARF Media release retrieved from
https://www.nccarf.edu.au/sites/default/files/attached_files_news/Are-we-ready-NCCARF-
PGB-launch.pdf in September 2015
201. Appendix 1
CITY OF WANNEROO RISK MANAGEMENT METHODOLOGY
RISK RATING TABLE
Catastrophic High Extreme Extreme Extreme Extreme
CONSEQUENCE
Major High High Extreme Extreme Extreme
Moderate Moderate Moderate High High Extreme
Minor Low Low Moderate High High
Low Low Low Low Moderate High
Almost
Rare Unlikely Moderate Likely
Certain
LIKELIHOOD
RISK ACCEPTANCE / REPORTING CRITERIA
Risk Rating Criteria for Acceptance Responsibility Monitoring Reporting
Risk acceptable with Management
Operational Annual risk Annually to
Low Systems Effectiveness rating above
Leader (OL) review by OL Manager
Unsatisfactory
Risk acceptable with Satisfactory Quarterly to EMT.
Quarterly risk
Management Systems Effectiveness Six monthly to
Moderate rating OR Newly Introduced or Some
Manager review by
Audit Committee /
Manager
Weaknesses and treatment plan Council
Risk acceptable with Satisfactory Quarterly risk Quarterly to Audit
High Management Systems Effectiveness Director / CEO review by Committee /
rating and treatment plan Director / CEO Council
Risk acceptable with Satisfactory Quarterly to Audit
Extreme Management Systems Effectiveness CEO / Council Monthly by CEO Committee/
rating and treatment plan Council
NOTE 1: The above table relates to Operational and Compliance risks as all Governance and Strategic risks will
be reported to Council quarterly.
21You can also read


