We 4Climate - Centre for Environment Education
←
→
Page content transcription
If your browser does not render page correctly, please read the page content below

We
   4
Climate

    Government of India
  Ministry of Environment,
 Forest and Climate Change
We
                          4
                       Climate
The lecture series promote a dialogue for knowledge
exchange and experience sharing about climate change
challenges. The participants will comprise stakeholders
including policymakers, researchers, practitioners and the
general public, as well as students across four Indian states
  l   Tamil Nadu
  l   Telangana
  l   Punjab
  l   Himachal Pradesh
The lecture series is conducted by Centre for Environment
Education (CEE) as part of the Indo- German bilateral project
“Climate Change Adaptation in Rural Areas of India (CCA
RAI)” of Deutsche Gesellschaft für Internationale
Zusammenarbeit (GIZ) GmbH.
This booklet is aimed at sharing information and creating
awareness about climate change, its impacts, India's response
to combat climate change and state-specific impacts.

The book is developed specially for the state of Punjab with support from
DST's Punjab State Climate Change Knowledge Centre, PSCST."

                                 Government of India
                               Ministry of Environment,
                              Forest and Climate Change
1    What is
     Climate Change?

Weather and Climate
Climate change is the biggest challenge Planet Earth faces
this century.
The word climate is often interchanged with weather.
Though they are related they are different in some important
ways.
Weather is the day to day state of the atmosphere for a
specific place, i.e. temperature, precipitation, humidity, air
pressure and wind. Climate is the long-term weather pattern
of a specific place. Climate means the average of the weather
conditions of a place - for least over 30 years.
For example, the statement, "30°C! It's hot today in Shimla."
describes the weather condition for that day in the city. On
the other hand, the annual mean temperature of Chandigarh
for the past 30 years is 24°C describes the city's climate.
Another example from IPCC-2014 report, on long term
changes, states that net annual temperatures in India in
2030s, with respect to 1970s, will increase by 1.7 to 2.2°C. –
might refer to climate change.
A strong anomaly of average long-term weather conditions
is what we call climate change.

 Climate change refers to a statistically significant variation in either
 the mean state of the climate or in its variability, persisting for an
 extended period (typically decades or longer).
                                        Intergovernmental Panel on Climate Change

 A change of climate which is attributed directly or indirectly to
 human activity that alters the composition of the global atmosphere
 and which is in addition to natural climate variability observed over
 comparable time periods is called as climate change.
                            United Nations Framework Convention on Climate Change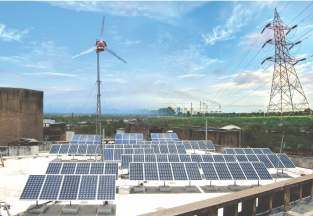
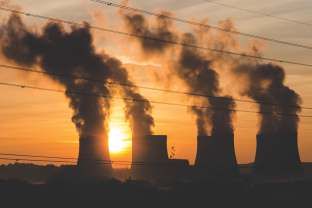
What causes Climate Change?
Climatic changes can take place either due to natural
phenomena or human activities. The world authority on
climate science, the IPCC (Intergovernmental Panel on
Climate Change), is convinced that the currently observed
changes are attributable to human activities, mainly the
burning of fossil fuels.
Before the industrial revolution started in the 1750s the
global average surface temperature was 14°C, which has
increased by 0.85°C and continues to rise due to increased
release of greenhouse gases in the atmosphere.
Why is the Globe warming up?
Some of the gases in the Earth's atmosphere can trap heat
and maintain the Earth's temperature, acting as a thermal
blanket. These gases, namely, Carbon Dioxide (CO2), Methane
(CH4) and Nitrous Oxide (N2O) are called Greenhouse Gases
(GHGs) and their effect is called Greenhouse Effect.
However, the concentration of the naturally present
greenhouse gases in the atmosphere is increasing and new
gases are being added, which leads to more heat being
retained in the atmosphere. The result is the warming of our
atmosphere. This is known as enhanced greenhouse gas
effect, which is causing the global average temperature to rise.

                   Greenhouse Effect
                           Greenhouse gases trap infrared radiation
                           and re-emit it in all directions

                                                            Gr
                                                              ee
                                                               nh
                                                                 ou
                                                                    se
                                                                     ga
                                                                        se
                                                                           s

        Incoming
        solar radiation

   Some radiation from
   the Earth’s surface
                            About half of the solar radiation
   and atmosphere is
   reflected back into      is absorbed by the Earth's surface,
   the space                warming the Earth and then is re-
                            emitted as infrared radiation
Why is the Concentration Of GHGs Increasing?
The earth's climate had been changing due to natural causes
since ages. However, the current change is human-made.
Since the industrial revolution, the concentration of
greenhouse gases (mainly CO2, CH4 and N2O) in the
atmosphere has increased due to various human activities
such as burning of fossil fuel for energy generation,
industrial processes and transportation; deforestation and
agriculture practices etc. Moreover, new gases like HFCs,
PFCs and SF6, used in refrigeration and air conditioning, have
been added. With urbanisation, population growth and
fancier lifestyles greenhouse gas emissions have reached
unprecedented levels.

  Emissions in 2010
 49 Gt CO2-eq
  1 Gigaton (Gt) = 100 crore tonnes

                                           Direct GHG               Indirect CO2
                                            emissions                emissions
                                      Agriculture,    Electricity       Energy
                                       Forest and      and heat
                                                      production
                                                                        1.4%
                                        Land use
                                         24%            25%                      Industry
                     Building
                      6.4%                                                        11%
                                                                                    Transport
             Transport                                                                0.3%
                14%
                                                                                   Building
                                                                                    12%
                            Industry                 Other energy
                              21%                       9.6%        Agriculture,Forest and
                                                                           Land use
                                                                           0.87%

Source- Synthesis Report, IPCC Fifth Assessment Report (AR5)
Where do the global greenhouse gas
emissions come from?
Transportation
14%
Agriculture and Forestry
24%
Industry
21%
Energy
35%
Buildings
6.4%
WasteThe Temperature Limits
Scientific evidences and political goal suggest that in order
to avoid irreversible damage, the planetary warming should
be restricted to below 2°C and efforts should be undertaken
to limit it to 1.5°C compared to pre-industrial levels.
Paris Agreement, 2015
CO2: The main culprit
Carbon dioxide acts as a thermostat regulating the temperature of
Earth. Since industrial revolution, the concentration of CO2 in the
atmosphere has increased from 278 to 400 PPM. It accounted for
78% of the total GHG emissions from 1970 to 2010.
The other greenhouse gases, if emitted in the equal quantity as CO2
are more potent and have higher warming potential. However, the
amount of CO2 emitted is much higher and it remains in the
atmosphere for thousands of years.
CO2 and Temperature Rise: Correlation
400 2
CO2 Part Per Million (PPM)
380 1.5
360 1 Temperature OC
340 0.5
320 0
300 -0.5
280 -1
260 -1.5
2000
2020
1800
1900
1700
1750
YEAR Graph is re-drawn using
IPCC and NOAA data
Source: IPCC Fifth Assessment Report (AR5), Working Group I and NOAA2 Impacts of
Climate Change
The impacts of climate change are already visible.
The average surface temperature increase is causing the
polar ice cap to melt with subsequent increase in the sea level
rise. However, these are the primary and direct impacts and
their onset is slow.
The immediate direct impacts are the increase in extreme
weather conditions and irregularity in precipitation which has
indirect impacts on health, agriculture and water resources.
At other levels are the indirect impacts such as migration,
economic losses and increase in conflicts.
In other words impacts of climate change are cascading in
nature – change as a trigger in one of the systems will alter and
impact all the associated ecosystems and earth's elements as
well as socio-economic systems.Cascading Impacts of Climate Change
Average
Temperature
Rise
Direct Risk:
Ice cap melting,
rising sea level, irregularity
in precipitation and extreme
weather events.
Indirect Risk: Health Hazard, loss of
habitat and species, water resources,
coastal ecosystem and
ocean acidification, and changes and shift in
agriculture and forest system.
More Indirect Risk: Economic losses, food security,
conflict and wars and mass migration.Observed and Possible Im
Change for India
High Health Risk due to increase
diseases and epidemics.
l Increase in number of heat
between 30 and 40 every ye
l Change in spatial and temp
frequency of vector borne d
l Loss of life due to increased
flood, drought, cyclone and
Ecological degradation
l Loss of ecosystem and biod
l Increased frequency of foreCoastal inundation, sea water ingress and loss of life due to
sea level rise
l 40 million Indians
will be at risk
from rising sea
levels by 2050.
l 14,000 sq.km of
land at risk due to
1 m rise in sea
level.
l Mumbai and
Kolkata may go
under water due
to sea level rise.
Losses due to extreme weather events
l Loss of life and
infrastructure due
to intense and
frequent extreme
weather events.
l Irregularity in
energy
production and
industrial processDecreased agriculture productivity due to variability in
precipitation and temperature rise.
l Wheat, rice, maize and sorghum production may decline.
l Apple cultivation shifts to higher altitude in the
Himalayas.
l Possible 1.5 per cent loss in GDP.
l Shrinkage in annual agricultural income by 20 to 25 per
cent in unirrigated farmland and 15 to 18 per cent in
irrigated areas.
Source- Executive summary, India, Second National Communication to the United
Nation Framework Convention on Climate Change
Climate, Climate Change, and Agriculture, India Economic Survey, 2017-18
Down To Earth. (2017). Climate change impact on agriculture leads to 1.5 per cent loss
in India's GDP. [Online]. Avaliable at http://www.downtoearth.org.in/news/climate-
change-causes-about-1-5-per-cent-loss-in-india-s-gdp-57883
India water portal. [Online]. Avaliable at http://www.indiawaterportal.org/sites/
indiawaterportal.org/files/b3climate.pdf
The Hindu. Business linex. (2018). 14,000 sq.km. land at risk with rising sea level:
Report. [Online]. Avaliable at https://www.thehindubusinessline.com/news/14000-sqkm-
land-at-risk-with-rising-sea-level-report/article23105650.ece3 Solutions to
Climate Change
What is Mitigation? What is Adaptation?
Mitigation: Reducing climate change.
Actions that reduce the GHGs emissions or enhance the
natural sinks of greenhouse gases in order to limit
temperature rise.
Adaptation: Coping with the impacts of climate change.
Adjustments in ecological, social and economic systems to
the observed and expected impacts of climate change.India's Response to Climate Change India has devised several national and state level policies and actions to combat climate change. India's Nationally Determined Contribution (NDC) sets a target to lower the GDP emissions intensity by 33 per cent to 35 per cent by 2030 compared to 2005 levels. It sets out climate action within the perspective of propagation of a healthy and sustainable lifestyle. In 2008, Government of India introduced its first comprehensive climate policy called National Action Plan on Climate Change (NAPCC). The action plan has defined strategies and programmes to address climate mitigation and adaptation through eight national missions, namely, Jawaharlal Nehru National Solar Mission, National Mission for Enhanced Energy Efficiency, National Mission on Sustainable Habitat, National Water Mission, National Mission for Sustaining the Himalayan Ecosystem, National Mission for a “Green India“, National Mission for Sustainable Agriculture, and National Mission on Strategic Knowledge for Climate Change. Following the implementation of NAPCCs, the Government of India tasked all the state governments in 2009 to prepare their respective State Action Plans on Climate Change (SAPCCs). The state level plan includes regional mapping of vulnerability, observed and projected impacts, and action plan and strategies for mitigation and adaptation. SAPCCs enrich the national climate change policies by feeding local and regional experiences, needs and solutions.
Power of the sun: India has an ambitious target of achieving
100 GW of solar power until 2022 under the National Solar
Mission. To meet the target, 60 GW is targeted through large
and medium scale grid-connected solar power plants while 40
GW is through rooftops. Until now, India has achieved around
22 GW of cumulative solar capacity. Addtionally, India has
shown global commitment by launching International Solar
Alliance (ISA) to assist and help achieve the common goals of
increasing the use of solar energy in a safe, convenient,
affordable, equitable and sustainable manner. The ISA is a
mutual cooperation among solar rich countries lying fully or
partially between the tropics of Cancer and Capricorn. As of
now, 65 countries have signed the ISA Framework
Agreement.
4          State Status: Impacts and
           Responses to Climate Change
           by Punjab

Possible impacts of climate change on Punjab
Climate projections show that by 2021-50, the annual
precipitation and mean maximum temperature would
increase by about 13.3 - 21.5 percent and 1.0-1.8oC respectively
leading to extreme precipitation, heat-related events as well
as flood-like situations. The negative impacts of these climate
change events would be manifested in the form of increased
vector-borne outbreaks, plant diseases, habitat alterations,
and reduction in agricultural yield and forest-based
livelihoods, among others.

Source- Punjab State Action Plan on Climate Change, Department of Science,
Technology and Environment, Government of Punjab, 2014.
Punjab State Action Plan on Climate Change (PbSAPCC) Punjab State Action Plan on Climate Change (PbSAPCC) is developed in line with the objectives of the eight missions as part of the National Action Plan on Climate Change (NAPCC) and encompasses strategies to address the innumerable developmental and climatic challenges faced by the state with respect to water and agriculture, forests, ecosystem and biodiversity, urban habitats, and energy. The plan largely focuses on ameliorating vulnerabilities due to climate change across sectors through inter-sectoral approach, inter-departmental coordination as well as collaboration with technical expertise at the state, national and international level. Punjab State Council for Science and Technology is the designated nodal agency to assess, identify and implement climate-related programmes within the state.
Missions and related targets/strategies
The plan encapsulates state level missions with broad targets (as
enumerated below) and underlying strategies to achieve these
targets.

  Water       Increase in water use efficiency, prevention of water wastage,
  Mission     reduction in water pollution and equitable distribution of water.

  Sustainable agricultural practices, use of new technologies      Sustainable
  and usage of agricultural residue for energy generation.         Agriculture
                                                                     Mission

  Green
  Punjab       Increase forest cover to 15% by 2022 and improve the quality of
  Mission      degraded forests and ecosystem services.

                                                                    Sustaining
   Conserve flora, fauna, wetlands as well as biodiversity,         Himalayan
   especially to sustain Shivalik Ecosystem.                        Ecosystem

Sustainable   Design adaptation policies for urban areas, strategies for
  Habitat     reducing heat island effect, management of solid waste and
  Mission     public transportation

                                                                      Solar
     Increase solar energy mix by 2000MW by 2022
                                                                     Mission

 Enhanced
  Energy      Increase energy efficiency by 3-5% in large energy consumers,
 Efficiency   and 15-20% in small and medium enterprises.
  Mission

    Deeper understanding of climate change processes,              Knowledge
    its implications and related vulnerabilities                    Mission
Case Studies 1. Climate-Smart Village The Climate-Smart Village is a community-based approach to limit the effects of climate change especially on agriculture and water for irrigation by engaging stakeholders and promoting localised best practices along with new-age technology. The idea is to mainstream climate-smart agriculture practices into the village development plans. An assortment of climate-smart agriculture practices such as weather forecasting, index-based insurance schemes, efficient irrigation management, resilient cultivars, and other low greenhouse gas emitting options are used. These also include direct seeded rice, raised-bed farming, maize-based system, precision land levelling, alternate wetting and drying technology, crop residue management, information and communication channels for raising awareness, and gender empowerment, among others. Source- Climate and Development Knowledge Network. (2018). India promoting Climate Smart Agriculture. [online] Available at: https://cdkn.org/2015/10/feature-climate- smart-villages-in-punjab-india-promoting-climate-smart-agriculture/?loclang=en_gb
2. Crop residue management
Burning of crop residue in Punjab is a huge menace not only
for the state but also for several downwind regions in
Northern India. Punjab, along with three other Indian states
initiated a project to sustainably utilise paddy straw as an
alternative fuel in brick kilns, thereby reducing air pollution
from open burning of paddy straw and reducing dependence
on fossil fuel in the local brick industry.
In addition to benefitting environmental and human health,
the farmers also secure an alternative source of income by
selling the briquetted crop residue. The project aims to
mitigate climate change impacts and enhance adaptive
capacity in the project areas through awareness-raising
among farmers and promoting alternate uses of crop residue;
to develop sustainable and implementable entrepreneurial
models in rural areas by engaging different stakeholders,
upscaling successful and innovative initiatives for crop
residue management; to improve the income generation
potential of farmers; and to suggest policy interventions. The
project is sanctioned under the National Adaptation Fund for
Climate Change (NAFCC).

Source- NABARD (2018). Climate Resilience Building among Farmers through Crop
Residue Management. [online] Available at: http://www.moef.gov.in/sites/default/files
/Regional%20Project%20DPR_on_Crop_Residue_Mangement_-_15_January_2018.pdf.
3. Climate Resilient Livestock Production System
Punjab ranks among the top five milk-producing states of
India, with animal husbandry being the second most
important economic sector, after agriculture. Climate change
and the projected rise in temperatures are expected to
reduce livestock production. To address these challenges, the
Punjab State Council for Science and Technology,
Government of Punjab, is implementing a project to ensure
sustainable levels of livestock production through scientific
interventions, assisted reproductive technologies, water-use
efficiency in fodder cultivation, climate resilient housing for
cattle, disease forecasting for preventing breakout of bovine
diseases. The project also encourages livestock farmers to
harness co-benefits by housing stray cattle. Another measure
being developed under the project is weather-linked
insurance for compensating these farmers when there is a
decrease in milk yield. The project also focuses on effective
gender participation with 30 percent of the project
beneficiaries being women.

Source- Punjab State Council for Science & Technology (2015). Towards Climate
Resilient Livestock Production System in Punjab. [online] Available at:
http://www.moef.gov.in/sites/default/files/Punjab.pdf.
4. Farm pond revival
Over the past years, Punjab has consistently recorded below
normal rainfall that has taken a toll on the groundwater levels
due to over-extraction. However, a few farmers in Patiala
have rediscovered the potential of farm ponds, which can
solve the water crisis in the state to a certain extent and also
aid in reducing the intensity of floods. During monsoon, the
ponds are filled with water that can be used for irrigating the
fields during dry spells. This reduces the dependence on
groundwater and consumption of GHG emitting diesel fuel in
pumps, which require less power to lift pond water. The
initiative started with an individual farmer, without any push
from a governmental or non-governmental organisation, and
has managed to spread to around 15 farmers from nearby
villages. With erratic rainfalls becoming a jarring reality for
Indian farmers, farm ponds become a necessary fall back.

Source- Manu Moudgil. (2018). Ponds--once a lifeline of India's agriculture--are being
revived by some Punjab farmers. [online] Available at: http://www.indiawaterportal.org/
articles/ponds-once-lifeline-indias-agriculture-are-being-revived-some-punjab-farmers.
5. Solar Powered Micro Irrigation Project
People in Jugial, a village in the Talwara and Hajipur Blocks of
Hoshiarpur district are mainly dependent on agriculture. Since
the village is at an elevation from the irrigation canal,
agriculture in the region is mainly rain-fed. However, in the
past decade, rainfall has reduced drastically affecting crop
productivity and livelihoods.
The Department of Soil and Water Conservation, Punjab
implemented an Integrated Solar-powered Community Lift
Micro-Irrigation Project on the Kandi Canal in the two blocks
to support sustainable agriculture in the region. Major
initiatives under the project include field level installation with
high-tech micro irrigation systems complete with automation.
The project is first of its kind in Punjab with large-scale water-
use efficiency (70 percent saving) from the canal and other
inputs through an underground pipeline and micro irrigation.
The project has benefited 664 hectares area owned by 800
farmers of 14 villages with assured irrigation and productive
cultivation. The intended socio-economic development of the
beneficiaries through optimum yields is also expected to
increase by 40-80 percent.

Source- GIZ-India.
6. Model Solar City Chandigarh
The Ministry of New and Renewable Energy, Government of
India selected the city of Chandigarh to be developed as a
Model Solar City. As per the Master Plan for the Model Solar
City, the short term target for 3 years (until 2014) for Rooftop
Solar photovoltaic system was 2.5 MW and the long-term
target is 10 MW for 10 years (until 2022).
The Model Solar City of Chandigarh was launched in July 2013
with the inauguration of two Roof top Grid Interactive SPV
Plants at Paryawaran Bhawan in sector 19-B (50 kWp) and at
Model Jail, Burrail (100 kWp). By the end of 2016, around 5.2
MWp Roof top SPV Plant had been commissioned on more
than 99 government buildings in Chandigarh, ranking the city
third in the country in Rooftop Solar Plant installation.
Another plant with the capacity of 1000 kWp has been
commission at Punjab Engineering College.

  The projected GHG emission reduction by
  this initiative is 4,04,969 tonnes CO2/annum
  by 2022 .

Source- ENVIS Centre of Chandigarh's State of Environment. (2016). Chandigarh A
Model Solar City. [online] Available at:
http://chenvis.nic.in/index3.aspx?sslid=1341&subsublinkid=357&langid=1&mid=1.
Photo credits:
Tierra (NASA) – 05. Banco de Imágenes Geológicas.2010. CC-BY-2.0.
Wikimedia Commons.
Fossil Fuel Gives Way To Solar Power. 2013. Gerry Machen. CC BY-ND 2.0.
Flickr Creative Commons.
Chennai weather. 2013. Sriram Jagannathan. CC-BY-2.0. Wikimedia
Commons.
Kids swimming in duck pond India Gate. 2009. Brian Gratwicke. CC BY 2.0.
Flickr Creative Commons.
Forest fire in Chir Pine forests near Chitai, Almora District, Uttarakhand.
2016. Ramwik. CC BY-SA 3.0. Wikimedia Commons.
Broken end of footbridge over the Mandakini river at rudraprayag
sangam. 2013. Mukerjee. CC BY-SA 3.0. Wikimedia Commons.
Own work. 2016. MrGauravBhosle. CC-BY-SA-4.0. Wikimedia Commons.
Udumalpet windmill farm landscape farms rural Tamil Nadu India. 2011.
Thangaraj Kumaravel. CC BY 2.0. Flickr. Wikimedia Commons.
A frame-filling portrait of a male polar bear (Ursus maritimus) jumping in
the pack ice. Svalbard, Norway. 2011. Bering Land Bridge National
Preserve. CC BY 2.0. Flickr. Wikimedia Commons.
A farmer in Sangrur district, Punjab tends to his vegetable garden. 2012.
Nirmal Sigtia (IWMI). CC BY-NC-SA 2.0. Climate Change, Agriculture and
Food Security (CCAFS) Flickr page.
Threshing, near Sangrur, SE Punjab, India. 2011. Neil Palmer.CC-BY-SA-2.0.
Wikimedia commons
Agro Waste Briquettes. Indiamart website.
Climate Smart Villages- Karnal. 2014. Prashanth Vishwanathan. CC BY-NC-
SA 2.0. Climate Change, Agriculture and Food Security (CCAFS) Flickr.
Farm Pond. 2008. Serge Birtel. Permission sought.
Solar powered micro irrigation. GIZ-India. Permission sought.
An aerial view of the solar panels set on the roof top of Punjab
Engineering College in Chandigarh. 2016. Chandigarh Metro.
You can also read