D4.2 REPORT ON 5G RADIO DEPLOYABILITY IN THE FACTORY - The 5G-SMART project has received funding from the European Union's Horizon 2020 research ...
←
→
Page content transcription
If your browser does not render page correctly, please read the page content below
D4.2
REPORT ON 5G RADIO DEPLOYABILITY IN THE FACTORY

The 5G-SMART project has received funding from the European
Union’s Horizon 2020 research and innovation programme under
grant agreement no 857008.
D4.2 REPORT ON 5G RADIO DEPLOYABILITY IN THE
FACTORY
Grant agreement number:         857008
Project title:                  5G for Smart Manufacturing
Project acronym:                5G-SMART
Project website:                www.5gsmart.eu
Programme:                      H2020-ICT-2018-3

Deliverable type:               Report (R)
Deliverable reference number:   D14
Contributing work packages:     WP4
Dissemination level:            Public (PU)
Due date:                       31st August 2020
Actual submission date:         17th of January 2021 (M20)

Responsible organization:       ULUND
Editor(s):                      Sara Gunnarsson (ULUND)
                                Harsh Tataria (ULUND)
                                Fredrik Tufvesson (ULUND)

Version number:                 1.0
Status:                         Final

Short abstract:                 This deliverable presents results from the work carried out
                                regarding the channel measurements and electromagnetic
                                compatibility (EMC) tests that have been conducted in the Bosch
                                semiconductor factory in Reutlingen. This includes details of the
                                designed test setups, measurement scenarios and evaluation of
                                both the channel measurements and EMC tests.

Keywords:                       5G, ASIC, channel characterisation, massive multiple-input
                                multiple-output (MIMO), measurements, mmWave,
                                semiconductor test, sensor

Contributor(s):                 Sara Gunnarsson (ULUND)
                                Steffen Malkowsky (ULUND)
                                Harsh Tataria (ULUND)
                                Fredrik Tufvesson (ULUND)
                                Joachim Schwarz (BOSCH)
                                Uwe Glass (BOSCH)
                                Horst Raidt (BOSCH)
                                Ahmad Rostami (BOSCH)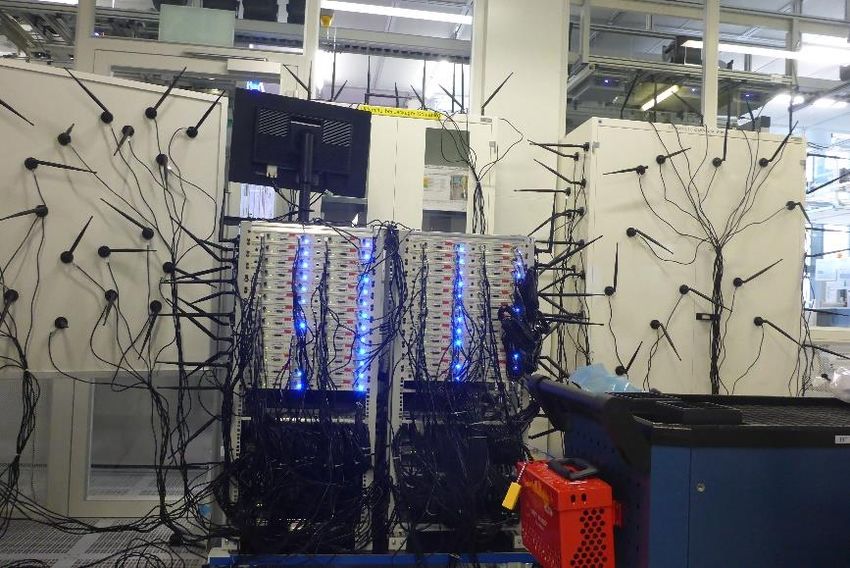
Document: D4.2
Version: 1.0                 Dissemination level: PU
Date: 2021-01-17             Status: Final

      Disclaimer
      This work has been performed in the framework of the H2020 project 5G-SMART co-funded by the
      EU. This information reflects the consortium’s view, but the consortium is not liable for any use that
      may be made of any of the information contained therein.

      This deliverable has been submitted to the EU commission, but it has not been reviewed and it has
      not been accepted by the EU commission yet.

      857008 5G-SMART                                                                                     1
Document: D4.2
Version: 1.0                 Dissemination level: PU
Date: 2021-01-17             Status: Final

      Executive summary
      As a part of the evaluation and deployment of 5G in real operating manufacturing factories, this
      deliverable presents two important aspects to consider, namely evaluation of coverage and
      electromagnetic compatibility (EMC). For this evaluation, two channel measurement setups,
      operating in two different bands have been considered together with setups to be able to conduct
      EMC tests. Measurements and tests have been performed at the Bosch semiconductor factory in
      Reutlingen, an environment where both coverage and EMC are important but challenging to achieve
      due to the complicated environment and high requirements.

      The scenarios considered for the channel measurements are presented as well as the different types
      of devices that have been under evaluation in terms of EMC. Results are presented where, for the
      channel measurements, the possibilities and challenges with deploying a radio system in a factory are
      shown. The EMC evaluation, correspondingly, showcase the potentials and risks in terms of achieving
      EMC in this specific type of production.

      To summarize this initial assessment, the results from the mid band channel measurements are
      promising for providing coverage across a factory floor while higher frequencies are more challenging.
      Regarding the EMC evaluation, depending on the requirements from the production, compatability
      might not always be guaranteed. Further investigations are required for both aspects and in the end
      of this deliverable, ways forward will be presented.

      857008 5G-SMART                                                                                     2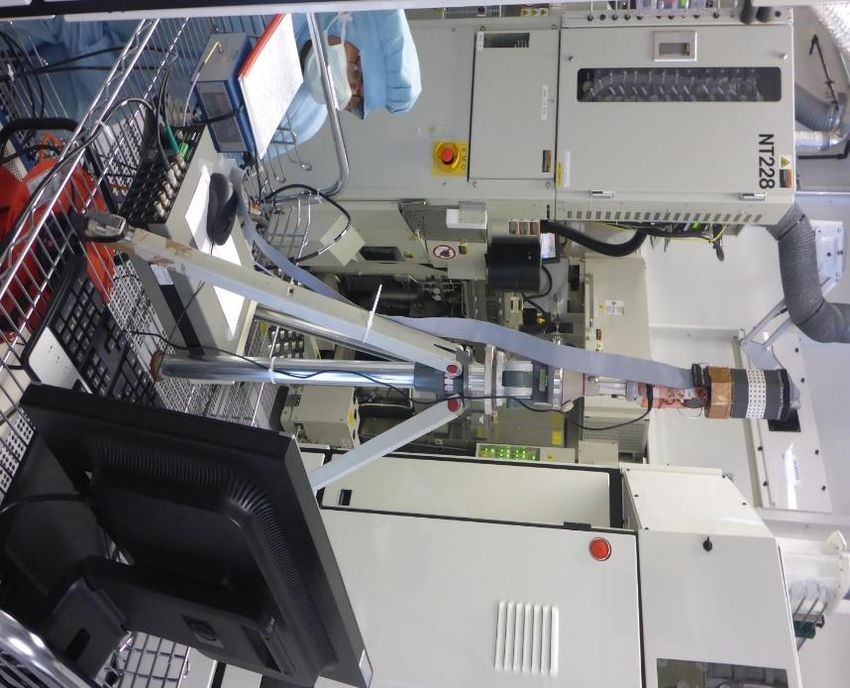
Document: D4.2
Version: 1.0                             Dissemination level: PU
Date: 2021-01-17                         Status: Final

      Table of content
      Executive summary ................................................................................................................................. 2
      Table of content ...................................................................................................................................... 3
      1      Introduction .................................................................................................................................... 5
          1.1       Objective of the document ..................................................................................................... 6
          1.2       Relation to other documents .................................................................................................. 6
          1.3       Structure of the document ..................................................................................................... 6
      2      Channel measurement systems ...................................................................................................... 8
          2.1       Mid band massive MIMO channel sounding system .............................................................. 8
          2.2       Millimeter-wave channel sounding system .......................................................................... 10
      3      Channel measurement scenarios.................................................................................................. 12
          3.1       Scenario A: open corridor ..................................................................................................... 12
             3.1.1          Mid band measurements .............................................................................................. 13
             3.1.2          Millimeter-wave measurements................................................................................... 14
          3.2       Scenario B: semi-open environment with robot interaction ................................................ 14
             3.2.1          Mid band measurements .............................................................................................. 15
             3.2.2          Millimeter-wave measurements................................................................................... 16
          3.3       Scenario C: heavy blockage ................................................................................................... 17
             3.3.1          Mid band measurements .............................................................................................. 18
             3.3.2          Millimeter-wave measurements................................................................................... 19
      4      Channel characteristics ................................................................................................................. 20
          4.1       Mid band characteristics ....................................................................................................... 20
             4.1.1          Scenario A: open corridor ............................................................................................. 20
             4.1.2          Scenario B: semi-open environment with robot interaction ........................................ 22
             4.1.3          Scenario C: heavy blockage ........................................................................................... 28
          4.2       Millimeter-wave characteristics............................................................................................ 47
             4.2.1          Scenario A: open corridor ............................................................................................. 47
             4.2.2          Scenario B: semi-open environment with robot interaction ........................................ 50
             4.2.3          Scenario C: heavy blockage ........................................................................................... 60
          4.3       Summary of channel characteristics ..................................................................................... 65
      5      Electromagnetic compatibility tests ............................................................................................. 66
      6      Device selection ............................................................................................................................ 68

      857008 5G-SMART                                                                                                                                         3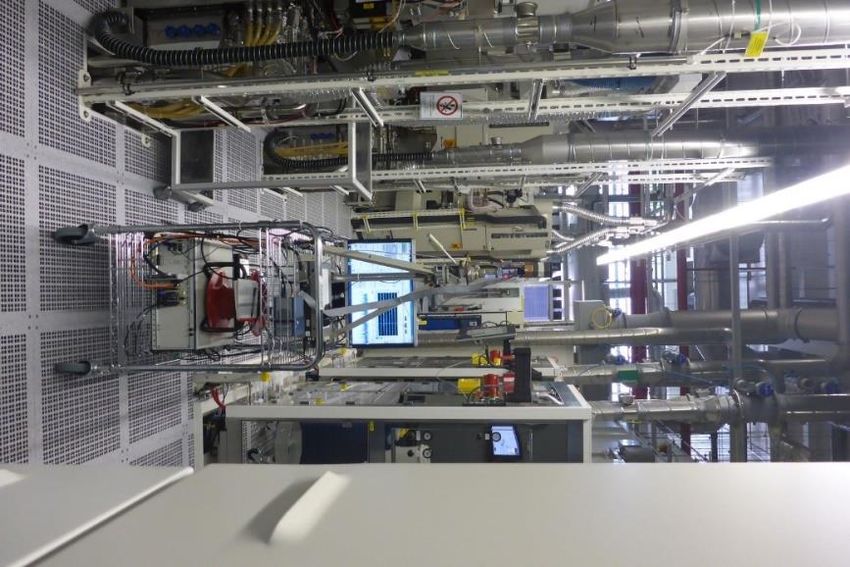
Document: D4.2
Version: 1.0                             Dissemination level: PU
Date: 2021-01-17                         Status: Final

      7      EMC test setup .............................................................................................................................. 69
          7.1        Test sequence and procedure............................................................................................... 71
          7.2        Safety for series production .................................................................................................. 72
          7.3        Analysis tool .......................................................................................................................... 72
      8      EMC evaluation ............................................................................................................................. 73
      9      Conclusions and ways forward ..................................................................................................... 76
      10 References .................................................................................................................................... 78
      Appendix ............................................................................................................................................... 79
          List of abbreviations .......................................................................................................................... 79

      857008 5G-SMART                                                                                                                                          4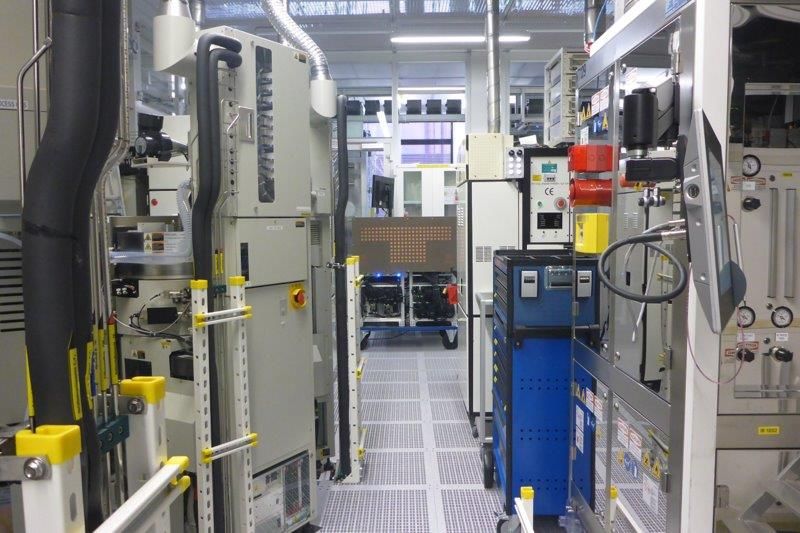
Document: D4.2
Version: 1.0 Dissemination level: PU
Date: 2021-01-17 Status: Final
1 Introduction
When deploying 5G systems in factory environments to be used for smart manufacturing, two
essential aspects that need investigation are whether reliable coverage, to ensure that use case
requirements are fulfilled across the factory floor, can be provided and if the electromagnetic
compatibility (EMC) levels of 5G technology are satisfactory. To investigate this, 5G-SMART has as
one of its objectives that the deployability of 5G system in a Bosch semiconductor factory
environment should be evaluated in terms of these previously mentioned aspects. To evaluate the
coverage in the production environment, channel measurements have been performed, taking into
account various aspects that are obstacles to the radio propagation. Furthermore, a semiconductor
production environment is sensitive to radiation and hence has high requirements on EMC levels
and therefore a test setup has been designed and devices have been tested.
Since a factory floor is a challenging environment in terms of radio propagation, attention needs to
be given to how to provide a reliable coverage throughout the factory. Factory floors are usually
environments characterised as rich scattering with various tools and machines, which contribute to
shadowing effects and are in different ways interacting with the radio signals. Moreover, the
environment is typically quite dynamic as production is ongoing with people and robots moving
around performing their tasks. To investigate the effects of these aspects, channel measurement
campaigns have been designed to investigate power distributions at various positions across the
factory floor, blocking profiles, behaviour and characteristics of multipath components (MPCs) and
polarisation parameters. The measurements are considering two 5G frequency bands, both a mid
band frequency centred around 3.71 GHz and also a higher frequency centred around 27 GHz.
Another factor to consider is that the production could potentially be sensitive to environmental
conditions, such as radio signals. As a result, it is crucial to make sure that 5G signals do not have any
negative impact on the production processes before any 5G system is deployed and operated in the
production area. To address this issue, the impact of 5G signals on a semiconductor production is
analysed and evaluated. The focus is on the semiconductor testing process, which is an important
process of the whole semiconductor production. In particular, the electromagnetic fields created
due to the 5G signals are investigated to see whether these could have any negative impacts on the
testing of the produced semiconductor components, i.e. EMC.
With the information that can be extracted from the two different types of investigations, valuable
insights are provided regarding the feasibility of deploying 5G systems for smart manufacturing in real
operating factories. Input is given regarding how to design the system from a radio propagation point
of view as well as in terms of electromagnetic compliance. The results can also be used for further
analysis and to design relevant models to be used for 5G deployment in factory environments.
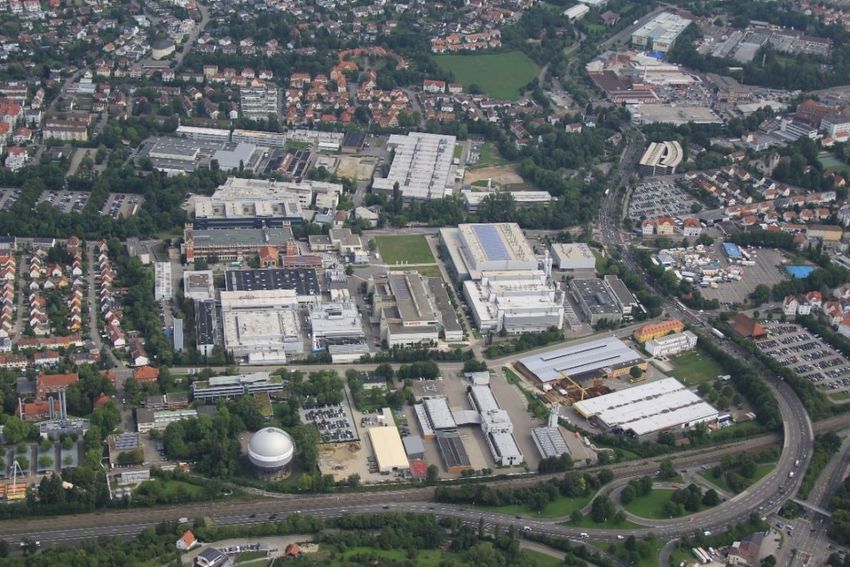
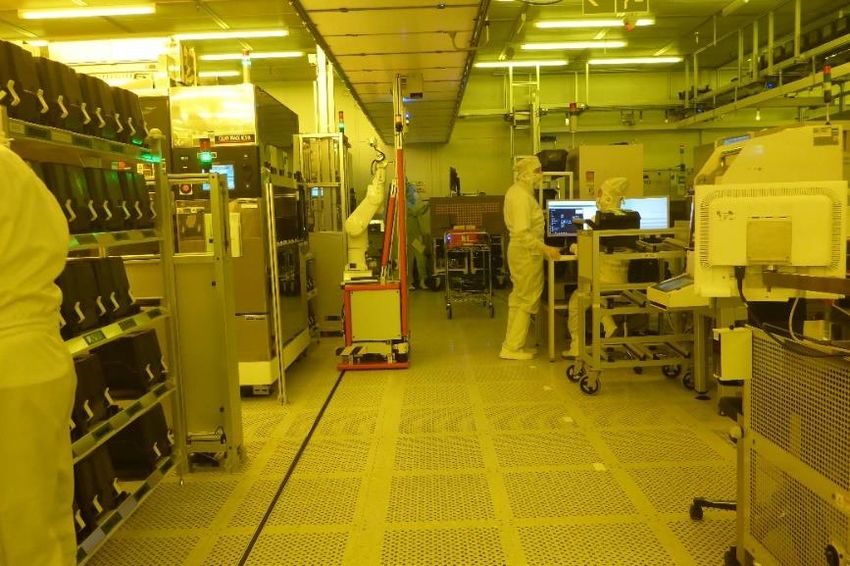
The channel measurements and EMC tests have both been conducted in the Bosch semiconductor
factory in Reutlingen as seen in Figure 1; the channel measurements were performed in the wafer
fab, whereas the EMC tests were performed at the wafer test area and the final test area of the
devices.
857008 5G-SMART 5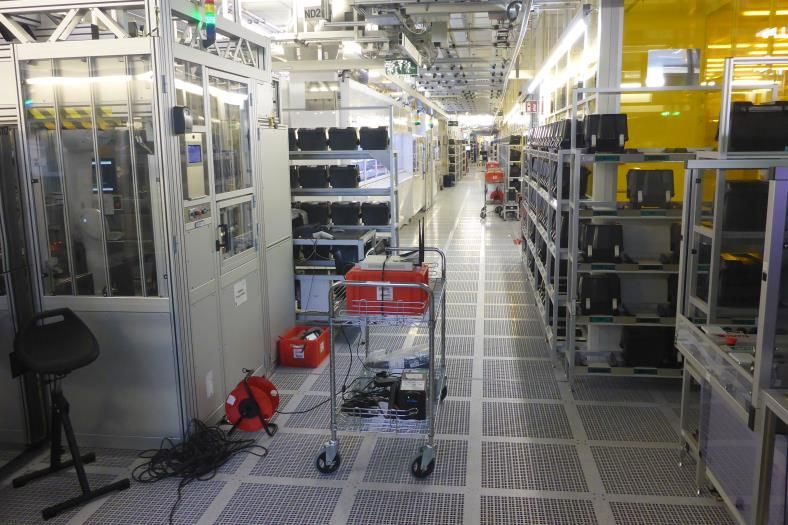
Document: D4.2
Version: 1.0                  Dissemination level: PU
Date: 2021-01-17              Status: Final

                      Figure 1. Overview of Bosch semiconductor factory in Reutlingen, Germany

      1.1      Objective of the document
      One of the overall objectives for 5G-SMART is to evaluate the possibility of deploying 5G in a
      semiconductor factory. One aspect is to evaluate this in terms of channel measurements and EMC
      tests. The objective of this document is to describe the measurements and tests made and to present
      the first results from these experiments.
      1.2      Relation to other documents
      This deliverable is related to the work presented in D1.1 [5GS20-D110] and D4.1 [5GS20-D410]. While
      the first one relates to the use cases to be trialed in the Bosch semiconductor factory, the latter
      describes the constraints and deployment requirements for the design and installation of the 5G
      system. In D4.1 [5GS20-D410] more details regarding the trial site are described and this document
      aims at adding to this document by presenting further insights related to 5G radio deployment in the
      factory.
      1.3      Structure of the document
      This deliverable is structured in two parts, the channel measurements and the EMC tests. First an
      overview of the equipment used for the channel measurements are given, followed by descriptions of
      the chosen measurement scenarios. Then the channel characterisation results are presented. For the
      EMC part, an introduction to the EMC tests is given and the motivation for the selection of devices
      used for the tests is presented. The test setup, both in terms of hardware and the test procedures
      applied, is described. Then the evaluation of the EMC test results is provided. Finally, conclusions and

      857008 5G-SMART                                                                                       6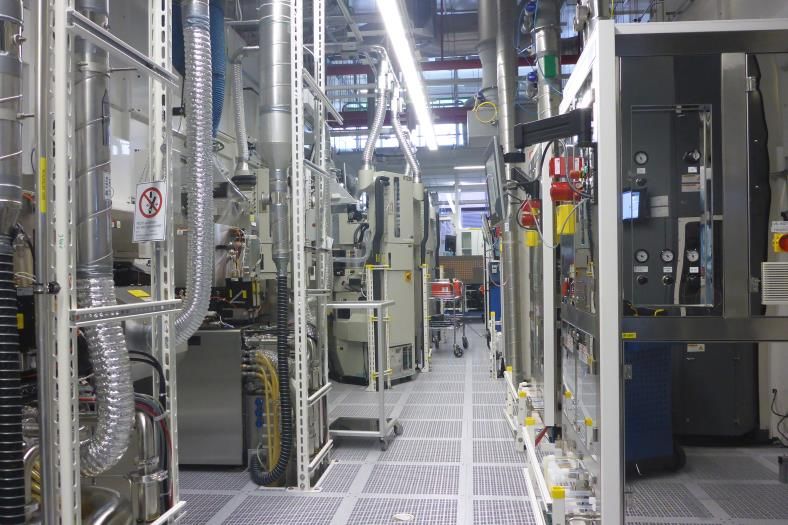
Document: D4.2
Version: 1.0                 Dissemination level: PU
Date: 2021-01-17             Status: Final

      steps for how to proceed are outlined, both regarding the channel measurement results as well as the
      EMC test results.

      857008 5G-SMART                                                                                   7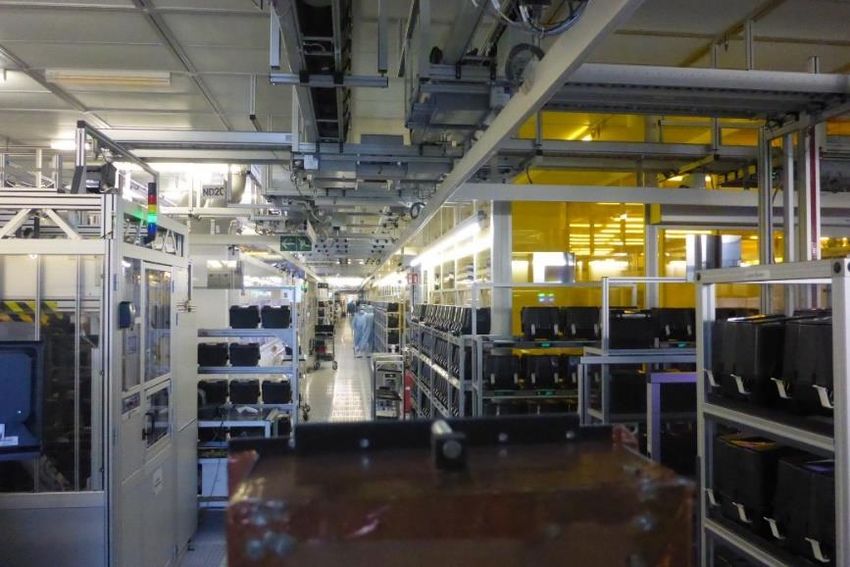
Document: D4.2
Version: 1.0                  Dissemination level: PU
Date: 2021-01-17              Status: Final

      2        Channel measurement systems
      For the channel measurements, two systems were considered. One real-time massive multiple-input
      multiple-output (MIMO) testbed for the mid band measurements and one channel sounder with a
      switched array for the millimeter-wave (mmWave) measurements. Both of them will be further
      described below.

      2.1      Mid band massive MIMO channel sounding system
      The mid band channel sounding system is a software-defined radio (SDR) massive MIMO system
      with 100 radio-frequency (RF) chains. The so-called Lund university massive MIMO (LuMaMi)
      testbed, which is acting as a base station (BS) is shown in Figure 2. The testbed implementation is
      based on Long-Term Evolution (LTE) and is using orthogonal frequency-division multiplexing (OFDM).
      Each user equipment (UE) sends pilots on orthogonal subcarriers, i.e. each UE uses every 12-th
      subcarrier with the first UE starting at subcarrier 0, the second at subcarrier 1, etc. A summary of the
      testbed parameters can be found in Table 1 and further details about the testbed and sounding
      system can be found in [MVL+2017].

      The planar T-shaped antenna array with 160 dual polarised λ/2 patch elements was developed in-
      house. A 3.2 mm Diclad 880 was chosen for the printed circuit board substrate. The 160 dual-
      polarised antennas yield in total 320 possible antenna ports that can be used to explore different
      antenna array configurations. The default configuration is that the top four rows are connected to
      the 100 RF chains with alternating polarisation; the upper left antenna is vertically polarised, the
      next one it horizontally polarized and so on, creating an array where both polarisations are utilized,
      equally spaced and with similar aperture. All antenna elements are center shorted, which improves
      isolation and bandwidth. The manufactured array yielded an average 10 dB-bandwidth of 183 MHz
      centered at 3.7 GHz with isolation between antenna ports varying between 18 dB and 28 dB
      depending on location in the array. During the measurement campaign a distributed setup was also
      considered with 100 dipole antennas, each having a 5-meter cable. The setup, when mounted in the
      factory, can be seen in Figure 3. For this setup, the antennas were mounted at random places with
      random polarisations with the aim to exploit signals coming from all possible directions.

      Each UE represents a phone or other wireless device with single antenna capabilities. One SDR
      serves as two independent UEs such that overall, six SDRs are required when deploying all 12 UEs.
      Each UE is equipped with an omni-directional dipole antenna and both vertical and horizontal
      polarisations of the antenna can be achieved by physically rotating the antenna in the setup.

      857008 5G-SMART                                                                                       8
Document: D4.2
Version: 1.0 Dissemination level: PU
Date: 2021-01-17 Status: Final
Figure 2: The Lund university massive MIMO (LuMaMi) testbed.
Figure 3: The distributed array mounted in the factory.
Table 1: Summary of the testbed parameters.
Parameter Value
Sounder type Real-time testbed
Center frequency 3.7 GHz
OFDM symbol duration 66.67 µs
857008 5G-SMART 9Document: D4.2
Version: 1.0 Dissemination level: PU
Date: 2021-01-17 Status: Final
Snapshot rate 10 ms
Bandwidth 20 MHz
BS output power 16 dBm per antenna
BS array size 100 antennas
Antenna gain for patch antennas 8 dBi (simulated)
Polarisation Dual - vertical and horizontal
BS-UE synchronization Over the air
Number of UEs Up to 12 simultaneously
UE transmit power 18.5 dBm
UE array size 1 antenna
UE antenna Omni-directional dipole
2.2 Millimeter-wave channel sounding system
The general principle of the mmWave channel sounding system is as follows: a known waveform is
generated in the baseband and up-converted to the carrier frequency of interest, followed by power
amplification and transmission. On the receiving end, the waveform is down-converted, sampled
and stored for post-processing. The channel impulse response is extracted from the received signal
envelope relative to what was transmitted. In order to extract the directional characteristics of the
channel, multiple repetitions of the sounding waveform are transmitted into, and hence received
from, different directions, illuminating different transmit and/or receive antennas.
The baseband sounding waveform implemented at the transmitter's host interface is a multi-tone
Zadoff-Chu (ZC) sequence. ZC sequences have ideal correlation properties in both time and
frequency domains and are thus well suited for channel sounding. In contrast to other sounding
waveforms, they are also easily scalable across both time and frequency domains. Naturally, wider
signal bandwidths facilitate higher frequency selectivity, while the total duration of the sounding
waveform is designed keeping in mind the furthest resolvable MPC.
The sounder, as seen in Figure 4, is designed with a 128 element uniform planar array at the
transmitter, here acting as the BS, and a 256 element cylindrical array at the receiver, here being the
UE, supporting dual polarisation. Both arrays are equipped with integrated RF switches to switch
through each antenna combination from the transmitter to the receiver. According to the switched
array principle, both link ends are equipped with a single RF up/down-conversion chain. Further
details of the sounder setup can be found in [Ben19].
857008 5G-SMART 10Document: D4.2
Version: 1.0 Dissemination level: PU
Date: 2021-01-17 Status: Final
Figure 4: The mmWave equipment.
Each patch antenna is designed as a coupled parasitic resonator where the feed element is
connected through stacked vias to the switch outputs at the antenna backplane. The elements are
designed in a three-layered structure. The lowest layer is the ground plane, the second layer
elevated to 100 m is a dual feed coupling element and the top layer at 300 m, is the radiator. The
coupling element in combination with the radiator generates two closely spaced resonances that are
tuned to achieve a bandwidth that covers the desired frequencies. Each antenna element is
individually characterized in an anechoic chamber such that a high resolution parameter estimation
algorithm can be used for estimation of the channel parameters. Further details of the antenna
design can be found in [YZB+20]. Table 2 presents a summary of the parameters used for the
mmWave channel measurements.
Table 2. Summary of the sounder parameters.
Parameter Value
Sounder type Switched array
Center frequency 27-28 GHz
Bandwidth 1 GHz
Transmit equipvalent isotropically radiated power 32 dBm
BS array size 128 antennas
UE array size 256 antennas
Polarisation Dual - vertical and horizontal
UE antenna gain 27 dB (after post processing)
Direction switching rate 10 µs
Snapshot rate 327.68 ms
BS-UE synchronization Rubidium clocks
857008 5G-SMART 11Document: D4.2
Version: 1.0 Dissemination level: PU
Date: 2021-01-17 Status: Final
3 Channel measurement scenarios
For the channel measurements, three different main scenarios were considered. In this section,
these scenarios are further described and the details of the measurement campaign will be
presented. In short, the three scenarios are open corridor, semi-open environment with robot
interaction and heavy blockage; the choice of the respective scenario is also elaborated on in this
section. The specific experiments performed for the two frequency bands are also outlined. Due to
practical constraints, the experiments for the two bands are not always exactly the same.
3.1 Scenario A: open corridor
Scenario A includes a long corridor where there are walls and equipment constituting corridors on
one side and a wall with glass windows leading to the next room with equipment on the other side.
The environment is quite dynamic due to human interaction as people are walking along the corridor
and crossing when moving between rooms or transporting equipment and products.
This scenario, as roughly shown in Figure 5, was chosen since it is considered a suitable reference
scenario for industrial environments. The corridor is around 2 meters wide and goes through the
whole factory. The part of the corridor shown in the figure is approximately 30 meters long. High
metallic equipment as well as propagation effects caused by other materials characterize the
environment; this can be seen in Figure 6. It is also a suitable scenario for performing reference
measurements with a direct link (LOS link) as well as investigating the time evolution of the channel
when increasing the distance between the BS and UE. It is also possible to investigate shadowing and
blockage profiles when moving the user around a corner. Naturally, the human interaction is also
expected to contribute to large-scale fading effects.
Figure 5: Rough map over scenario A: open corridor.
857008 5G-SMART 12Document: D4.2
Version: 1.0 Dissemination level: PU
Date: 2021-01-17 Status: Final
Figure 6: Scenario A: open corridor with two mid band UEs placed out.
3.1.1 Mid band measurements
For the mid band measurements, results from two experiments will be presented. The first
experiment is depicted in Figure 7. In this experiment the BS is standing in front of a wall to the right
in the map; the UE is starting just in front of the BS. The channel is then collected for 60 seconds as
the UE moves away from the BS, along the corridor. The experiment is mostly a Line-of-Sight (LOS)
scenario, however due to people moving around in the corridor, some temporary blockage could
occur. From this data, the time evolution of different parameters when increasing the distance, such
as path loss, in a typical industrial environment can be investigated.
The next experiment analysed is shown in Figure 8. Here, the UE is first moving away from the BS
with a LOS link as in the previous measurement. Then the UE is moving around a corner, continuing
along another corridor with equipment on both sides. This allows for analysis of the blockage profile
when going from LOS to non-Line-of-Sight (NLOS) and time evolution in a NLOS scenario, to be
compared to the LOS case.
Figure 7: Map over the experiment where the UE is moving in a straight line away from the BS.
857008 5G-SMART 13Document: D4.2
Version: 1.0 Dissemination level: PU
Date: 2021-01-17 Status: Final
Figure 8: Map over the experiment where the UE is movingin a straight line away from the BS and then in a
straight line to the left into a NLOS scenario, passing one static UE.
3.1.2 Millimeter-wave measurements
For the mmWave measurements, as similar to the mid band measurements, the channel was
collected as the UE was moving away from the BS as seen in Figure 9. With this data the path loss
when traversing the corridor can be analysed as well as angular characteristics and evolvement of
the different multipath components. The measurement was taken for 18 seconds over a distance
where the signal-to-noise ratio was roughly estimated to still be sufficient.
Figure 9: Map over the experiment where the UE is moving in a straight line away from the BS.
3.2 Scenario B: semi-open environment with robot interaction
Scenario B includes a semi-open environment in the middle of the area but where high equipment
creates corridor-like environments on both sides. This environment is a highly dynamic one as it
involves robot interactions of different kinds as well as people walking around and crossing when
moving in the room and transporting equipment and products.
This scenario, as roughly shown in Figure 10, was chosen as it is a highly dynamic environment and
hence a relevant scenario when analysing challenges in industrial environments from a propagation
point of view. The size of the area shown is about 24 x 18 meters. The environment also includes
high metallic equipment as well as other materials that could cause different propagation effects; an
example of this can be seen in Figure 11Figure 6. It is a diverse environment, enabling several
interesting investigations including, but not limited to: LOS and NLOS measurements, shadowing and
blockage profiles from different types of robots as well as humans and transitions from LOS to NLOS.
857008 5G-SMART 14Document: D4.2
Version: 1.0 Dissemination level: PU
Date: 2021-01-17 Status: Final
Figure 10: Rough map over scenario B: semi-open environment with robot interaction
Figure 11: View of the semi-open part of the environment.
3.2.1 Mid band measurements
In the first experiment of this scenario, the interaction with robots and the resulting blockage
profiles were in focus. As seen in Figure 12, the BS is standing towards a wall and the UE is static in
the middle of the area. The marked area around the UE is where the robot interactions mostly took
place as the robots passed by when performing different tasks in the environment.
In Figure 13 the second experiment is depicted, with the BS in the same place as for the first
experiment and the UE moving, first away from the BS with a LOS link and then moving around a
corner into NLOS. With this data, the blockage profile when going from LOS to NLOS in a different
environment can be investigated. As the factory was fully operating at all times, there is no
guarantee that the results also are not influenced by robots and humans moving around.
857008 5G-SMART 15Document: D4.2
Version: 1.0 Dissemination level: PU
Date: 2021-01-17 Status: Final
Figure 12: Map over the experiment with a static UE and robot moving in the marked area.
Figure 13: Map over the experiment with two static UEs and one UE moving from LOS to NLOS.
3.2.2 Millimeter-wave measurements
The first experiment performed with the mmWave equipment in this environment was a reference
measurement seen in Figure 14, performed in a series of static points, where the UE is placed at
discrete points along the straight line with a LOS link to the BS.
In Figure 15, the measurement where the UE moves from LOS to NLOS is shown. First the UE is
placed in the semi-open environment and is then moved into a quite narrow corridor created by
high metallic equipment. For example, analysis based on multipath components such as their delay-
and angular characteristics in LOS and NLOS can be investigated here.
Similar to the mid band measurements, robot interactions were also captured to be able to analyse
how this influences the channel on higher frequencies. This analys was based on different UE
positions along the route in Figure 14.
857008 5G-SMART 16Document: D4.2
Version: 1.0 Dissemination level: PU
Date: 2021-01-17 Status: Final
Figure 14: Map over the experiment where the UE is moving in a straight line away from the BS.
Figure 15: Map over the experiment where the UE is going from LOS to NLOS.
3.3 Scenario C: heavy blockage
Scenario C is a scenario, which visually can be characterised by very heavy blockage. The
environment is a room containing the backsides of the machinery and hence, there are no robots or
humans present unless the machines are in need of maintenance or similar. However, this scenario
would be a typical environment for placing sensors to monitor the status of machines and hence,
connectivity is still required.
857008 5G-SMART 17Document: D4.2
Version: 1.0 Dissemination level: PU
Date: 2021-01-17 Status: Final
The map in Figure 16 displays the outline of the chosen scenario. The length of the room is
appoximately 18 meters and the width is about 4 meters. The blocks are tall metallic machinery and
being an environment, which is not used for production, the corridors are very narrow and therefore
the room includes many blocked areas and is a very tricky environment for obtaining good coverage
everywhere. Figure 17 shows the view towards the mid band BS and gives an idea of the complexity
of the environment. Rich scattering due to all the metallic equipment is expected in the environment
and there are many possibilities of investigating blockage profiles and coverage in extremely tricky
areas.
Figure 16: Rough map over scenario C: heavy blockage
Figure 17: View over the narrow corridor with the mid band measurement equipment in the background.
3.3.1 Mid band measurements
To characterise the blockage profile in this environment, continuous measurements were made with
the UE moving along the corridor, going into each of the places in between the machinery as in
Figure 18. The BS was placed next to the wall in one end of the corridor, with the antennas pointing
towards the machinery and the narrow corridor. The route was completed in two runs of 60 seconds
each, one starting from the BS side of the corridor and one starting from the other end.
The second type of measurements performed in this scenario is displayed in Figure 19 where the UE
starts in the middle of the narrow corridor with a direct link to the BS and then moves into either the
left or the right side of the corridor and there is scanning the whole area by moving the UE antennas
around. This means that the channel was captured both close to the floor as well as high up; the UE
857008 5G-SMART 18Document: D4.2
Version: 1.0 Dissemination level: PU
Date: 2021-01-17 Status: Final
antennas were moved close to the machinery on both sides and even went into tricky places within
the blocks in the map, where possible.
Figure 18: Map over the experiment where the UE is moving along the corridor and while going in and out of
shadowed zones.
Figure 19: Map over the two experiments where the UE is going from LOS and then into either right or left and
scanning the whole area.
3.3.2 Millimeter-wave measurements
Static reference measurements were taken by moving the UE a fixed distance along the narrow
corridor as in Figure 20. As for the mid band measurements, the BS was placed at the end of one
side of the corridor. Being a rich scattering environment, it is relevant to investigate the behaviour of
MPCs to find out exactly how rich scattering it is and what the angular spread is.
Investigating the LOS to NLOS transition, the transmitter was moved from one NLOS position on one
side of the corridor, passing through the middle where there is LOS and then into a NLOS region
again, see Figure 21. This results in two transitions and hence, two blockage profiles caused by heavy
machinery.
Figure 20: Map over the experiments where the UE is moving in a straight line away from the BS.
Figure 21: Map where the UE is moving from NLOS to LOS and then to NLOS again.
857008 5G-SMART 19Document: D4.2
Version: 1.0 Dissemination level: PU
Date: 2021-01-17 Status: Final
4 Channel characteristics
In this section the results from the channel measurements are presented, starting with the mid band
measurements and continuing with the mmWave measurements. Pictures from the actual
measurements are included, followed by the corresponding results, analysis and implications for an
implementation in a real operating factory.
4.1 Mid band characteristics
For the mid band measurements, channel characteristics such as the received power over distance,
blockage profiles, fading characteristics and polarisation aspects are investigated. Results will be
presented both when using the planar array but also when using the distributed setup as described
in section 2.1.
4.1.1 Scenario A: open corridor
The first scenario presented is scenario A, which includes an open corridor and is shown in Figure 6.
The first experiment is seen in Figure 7 and includes one UE moving along the corridor, away from
the BS. The BS is located in one end of the corridor and next to the wall, see Figure 22. The vicinity of
the BS is fairly open, in comparison to most locations in the factory, but there are metallic racks with
boxes nearby and people could pass by when performing their tasks. The view towards the UE is
seen in Figure 23, which also gives an idea about the reflective environment that includes a lot of
metall but also other types of materials.
Figure 22: View towards the BS.
857008 5G-SMART 20Document: D4.2
Version: 1.0 Dissemination level: PU
Date: 2021-01-17 Status: Final
Figure 23: View towards the UE.
The received channel gain, averaged over frequency, at the BS side as the UE moves away is
depicted in Figure 24. Over the distance that the channel measurements were collected, the
received channel gain decreased from about 17 dB to almost -15 dB. One of the UE antennas is
physically oriented to have a vertical polarisation while the other is oriented to have a horizontal
polarisation. The channel gain as received by the two different polarisations are similar, although
one is occasionally stronger than the other depending on where the UE is and what MPCs that are
contributing at the moment.
Figure 24: Received channel gain over time when using a vertical and a horizontal UE antenna, respectively.
The second experiment for this scenario is shown in Figure 8 and includes a transition from LOS to
NLOS. The BS is placed at the same place as before and the view of the UE in LOS also remains the
same. The view when going around the corner can be seen in Figure 25.
857008 5G-SMART 21Document: D4.2
Version: 1.0 Dissemination level: PU
Date: 2021-01-17 Status: Final
Figure 25: View towards the UE after turning around the corner, with the BS being to the left.
The received channel gain over time is shown in Figure 26 for both UE polarisations. As expected,
the path loss for the first 5-7 seconds are similar to the one in the previous experiment, as it is the
same path. Then when moving around the corner the received channel gain drops with about 5 dB,
the horizontal before the vertical one. This is most likely an effect caused by self-blockage from the
rest of the UE and influence by the antenna pattern as the LOS link is lost earlier on and then the
horizontal polarisation has to rely on reflections. After that the received channel gain continues to
decrease as the UE move further away, however not as fast as in LOS. Interesting to note is that, for
some reason, the channel gain slope for the vertical polarisation is decreasing faster than for the
horizontal one in NLOS.
LOS NLOS
Figure 26: Received channel gain over time when using a vertical and a horizontal UE antenna, respectively,
first in LOS and then in NLOS.
4.1.2 Scenario B: semi-open environment with robot interaction
The second scenario presented is scenario B, which is a very dynamic semi-open environment,
including a lot of robot interactions as well as interactions from humans. Starting with the
857008 5G-SMART 22Document: D4.2
Version: 1.0 Dissemination level: PU
Date: 2021-01-17 Status: Final
experiment shown in Figure 12 where there is a static UE and robots are moving around the UE, on
different routes, and creating shadowing effects. Two different measurements with robot
interactions will be presented here.
As seen in the map in Figure 12, the BS is positioned against the wall; the view towards the BS can be
seen in Figure 27. To the left in the figure, a robot, which moves back and forth in the environment,
can be seen and in the ceiling, there are tracks where material is transported. Note that the UE
positioned in front of the BS in the figure was not present for these measurements.
Figure 27: View towards the BS.
The measurements, aiming at capturing the dynamics caused by robot interaction, were 30 seconds
long. The view toward the UE after 8, 17 and 22 second are seen in Figure 28, Figure 29 and Figure
30, respectively. In Figure 28, there is a robot approaching the UE from the other side of the room.
Figure 29 shows the situation after around 17 seconds, including two robots where one is about to
cross right in front of the UE and hence blocking the LOS link. After around 22 seconds the robots are
still circulating around the UE and this situation is depicted in Figure 30.
Figure 28: View towards the UE after around 8 seconds.
857008 5G-SMART 23Document: D4.2
Version: 1.0 Dissemination level: PU
Date: 2021-01-17 Status: Final
Figure 29: View towards the UE after around 17 seconds.
Figure 30: View towards the UE after around 22 seconds.
The resulting received channel gain over time from these robot interactions can be seen in Figure 31,
for both UE polarisations. In the beginning, the channel variations, as averaged over frequency, are
minor. When the first robot is approaching the variations increase, most likely due to that the
scattering in the near vicinity of the UE is changing, where the metallic robots are acting as
reflectors. When one robot passes in between the BS and the UE, the received channel gain drops
with 4-6 dB depending on the polarisation of the UE antenna. In the last part of the measurement,
when multiple robots were circulating around the UE, the channel gain varies even more than before
as the highly reflective close-by scattering points are changing fast. With these changes, the channel
gain can go up and down with 3-5 dB within a short time interval.
This measurement captured a quite complicated scenario with both heavy blocking and highly
reflective scatterers in the near vicinity of the UE. However, even with the heavy blocking, only a
drop of 4-6 dB is experienced after applying maximum ratio combining on the signals received and
adding up all the antennas in the massive MIMO array. The margin that needs to be accounted for
due to close-by moving scatterers is in this measurement 3-5 dB and overall the results are quite
promising for massive MIMO to be able to handle complex situations in a highly dynamic industrial
scenario.
857008 5G-SMART 24Document: D4.2
Version: 1.0 Dissemination level: PU
Date: 2021-01-17 Status: Final
Robot
blocking
Robots in Robots in
vicinity vicinity
Figure 31: Received channel gain over time when using a vertical and a horizontal UE antenna, respectively.
The next measurement, which also is from an experiment including robot interactions, but also
interactions from humans, lasted for 30 seconds as well. After around 5 seconds, a robot passed by
between the BS and UE and hence blocked the LOS. In the second half of the measurement, around
18 seconds, a human crossed in front of the UE, continuing on the path from the UE towards the BS
and therefore continuing to influence the channel.
Figure 32: View towards the UE after around 5 seconds.
857008 5G-SMART 25Document: D4.2
Version: 1.0 Dissemination level: PU
Date: 2021-01-17 Status: Final
Figure 33: View towards the UE after around 18 seconds.
The received channel gain at the BS side for this measurement is seen in Figure 34 for both UE
polarisations. Interesting to note is that the average channel gain is higher for the horizontal
polarisation than the vertical one, which potentially could be due to reflections from the ground or
ceiling. The drop caused by blockage of a robot is 3-5 dB depending on the initial level of channel
gain for the two UE polarisations. The corresponding drop when the human initially blocked the LOS
is approximately 2 dB and is followed by some variations up and down as the human moves along
the path from the UE towards the BS. However, the changes are quite smooth in comparison to
having a highly reflective scatterer circulating around nearby, as seen in Figure 31.
Robot
blocking
Human
moving
around
Robot in
vicinity
Figure 34: Received channel gain over time when using a vertical and a horizontal UE antenna, respectively
The last experiment in this scenario is seen in Figure 13 and includes a transition from LOS to NLOS
when moving around a corner and continuing further down that path. The view after just turning
around the corner can be seen in Figure 35 and later on when entering a different part of the room,
the view is as in Figure 36. The path is quite diverse in terms of different width of corridors, which
also is changing due to equipment and materials along the way. Variations are also caused by
humans working.
857008 5G-SMART 26Document: D4.2
Version: 1.0 Dissemination level: PU
Date: 2021-01-17 Status: Final
Figure 35: View towards the UE after turning around the corner.
Figure 36: View towards the UE after turning around the corner, further down the path.
The total path loss from start to end of the measurement is around 14 dB for the two UE
polarisations. The blockage profile due to the transition from LOS to NLOS is quite smooth in
comparison to blockage due to robot interactions, as previously seen in Figure 31 and Figure 34. Also
as previously observed, the channel gain in NLOS decrease slower than in LOS when moving away
from the BS.
857008 5G-SMART 27Document: D4.2
Version: 1.0 Dissemination level: PU
Date: 2021-01-17 Status: Final
LOS NLOS
Figure 37: Received channel gain over time when using a vertical and a horizontal UE antenna, respectively.
4.1.3 Scenario C: heavy blockage
The last scenario is scenario C that is a highly reflective environment with lots of high metallic
equipment and narrow corridors. In general the environment is not a dynamic one, since there is no
production in the area and for these measurements only the person moving the UE could have
influenced the channel. In Figure 38, the view toward the BS when having the centralised array
deployed. The width of the central corridor in this scenario is about the same width as the array. The
case when the distributed array is deployed is seen in Figure 39. Two white boards were used to
enable the deployment of a fully, within cable limitations, distributed setup with random
orientations of the antennas.
Figure 38: View towards the BS, deployed with the centralised array.
857008 5G-SMART 28Document: D4.2
Version: 1.0 Dissemination level: PU
Date: 2021-01-17 Status: Final
Figure 39: View towards the BS, deployed with the distributed array.
The first experiment for this scenario is seen in Figure 18 and for this experiment the UE was moving
along the corridor while going in and out of the shadowed areas to both the left and right. The
resulting channel will therefore include both path loss and blockage profiles. The view towards the
UE when it is in the narrow corridor is seen in Figure 40.
Figure 40: View towards the UE.
When having the centralised array deployed, the received channel gain looks like in Figure 41 for the
two UE polarisations and the five shadowed areas closest to the BS. What is in the figure are five
857008 5G-SMART 29Document: D4.2
Version: 1.0 Dissemination level: PU
Date: 2021-01-17 Status: Final
very clear peaks and dips when alternating between LOS and NLOS. Depending on how far away
from the BS the UE is, the drop is at its extreme approximately 10 dB and then later on 5-8 dB for
these distances. What can also be observed is that even though the two UE polarisations behave
similarly, there are still some differences where the peaks are shifted in relation to the other
polarisation. In general, the vertical polarisation is stronger for a longer time. Causes for these
differences could be due to self-blockage of the horizontal polarisation when moving the UE and
influence by the antenna pattern.
In Figure 42, the results of the corresponding measurements when deploying the distributed setup is
shown for both UE polarisations. Note that overall, the received channel gain is lower, which is due
to using BS antennas with lower gain and an extra five meter cable to connect them. Here, the
largest dip is about 8 dB and the others 3-5 dB depending on the distance. In general, the variations
of channel gain over time is smaller with the distributed setup in comparison to the centralised
setup.
857008 5G-SMART 30Document: D4.2
Version: 1.0 Dissemination level: PU
Date: 2021-01-17 Status: Final
Figure 41: Received channel gain over time when using a vertical and a horizontal UE antenna, respectively.
Figure 42: Received channel gain over time when using a vertical and a horizontal UE antenna, respectively.
The second experiment, as shown in Figure 19, starts with the UE centered in the narrow corridor
with LOS conditions. Then the UE was moved into a shadowed area, either to the slightly wider area
on the right or the more narrow area on the left, as seen from the BS. In Figure 43, the view when
scanning the shadowed area to the right is seen. The experiment was done for both the centralised
and the distributed setup.
857008 5G-SMART 31Document: D4.2
Version: 1.0 Dissemination level: PU
Date: 2021-01-17 Status: Final
Figure 43: View towards the UE when scanning the shadowed area on the right side of the corridor.
Starting with the centralised array and investigating the channel gain, normalised such that the
average antenna has a power of 1, over time and frequency, the results look as in Figure 44 for the
vertical UE antenna. The lower part of the figure shows the channel gain when using the vertical
antenna in the upper left corner of the array as an example. For this antenna the channel gain is
varying more than 20 dB over both time and frequency. The upper part of the figure shows the
channel gain when applying maximum ratio combining to the signals and adding up the the
contributions from the 100 antennas. For this case, a slightly higher channel gain can be seen in the
beginning, as the UE antenna is in LOS, and after that it goes down and reaches a quite flat level,
which is stable over both time and frequency. This effect is called channel hardening and is a result
of combining the many antennas in a massive MIMO system. With the channel hardening effect, the
reliability of a system can be increased and the fading margins reduced due to the more stable
channel gain. Adding up all the antennas also result in a higher total channel gain – the array gain –
that can be exploited by either extending the coverage or lowering the UE transmit power with a
factor corresponding to the number of antennas.
Exploring the same data but from another angle, the empirical CDF of the channel gain is shown in
Figure 45 for 1 and 100 antennas respectively. Naturally, the steeper the curve is, the more channel
hardening. For the 100 antenna case, which is normalised by the number of antennas for
comparison, the curve is quite steep and the tail of the curve is small. On the other hand, for the 1
antenna case the curve is not as steep and the tail is quite significant, making the channel gain more
unpredictable and the system needs to cover a wider range and have a much higher sensitivity in
order to reduce the probability of outage.
The third point of view in which this data will be displayed is when zooming in to the question
regarding what fading margin would be required to have in a system operating in this type of
environment. In Figure 46 the data from Figure 44 is seen again for the 100 antenna case, as
averaged over frequency. Here it can be more evidently seen that the blockage occurring from the
LOS to NLOS transition is approximately 6 dB. Then the variation around this new mean is not much
more than only 2 dB from top to bottom and the channel remains quite stable throughout the whole
scanned area.
857008 5G-SMART 32Document: D4.2
Version: 1.0 Dissemination level: PU
Date: 2021-01-17 Status: Final
Figure 44: Channel gain over time and frequency for the vertically polarised UE antenna when scanning the
shadowed area on the right side of the corridor using 1 (lower) and 100 (upper) antennas of the centralised
array, respectively.
Figure 45: Empirical CDF for 1 and 100 antennas of the centralised array, respectively, when scanning the
shadowed area on the right side of the corridor with a vertical UE antenna.
857008 5G-SMART 33Document: D4.2
Version: 1.0 Dissemination level: PU
Date: 2021-01-17 Status: Final
Figure 46: Channel gain over time, averaged over frequency, for 100 antennas in the centralised array when
scanning the shadowed area on the right side of the corridor with a vertical UE antenna.
In Figure 47, Figure 48 and Figure 49, the corresponding results are shown but for the horizontally
polarised UE antenna. Observations to be made are that in Figure 47, there are slightly more
variations in the time domain. However, it is still quite flat. The horizontal antenna also seems to
have been in LOS a bit longer than the vertical one, which is reflected in the curve in Figure 48 where
the result for the 100 antenna case results in a peculiar bend at the end. Lastly, in Figure 49, the
slightly larger variations originating from the time domain can be seen and a fading margin of 3 dB.
Figure 47: Channel gain over time and frequency for the horizontally polarised UE antenna when scanning the
shadowed area on the right side of the corridor using 1 (lower) and 100 (upper) antennas of the centralised
array, respectively.
857008 5G-SMART 34Document: D4.2
Version: 1.0 Dissemination level: PU
Date: 2021-01-17 Status: Final
Figure 48: Empirical CDF for 1 and 100 antennas of the centralised array, respectively, when scanning the
shadowed area on the right side of the corridor with a horizontal UE antenna.
Figure 49: Channel gain over time, averaged over frequency, for 100 antennas in the centralised array when
scanning the shadowed area on the right side of the corridor with a horizontal UE antenna
The corresponding experiment was also done for the distributed setup and the corresponding
results are to be seen in Figure 50, Figure 51 and Figure 52 for the vertical UE antenna. The results
are similar as for the centralised array but some things are worth noting. First of all, with the
centralised array there is a clear LOS to each BS antenna as the link is in the direction of the main
gain of each antenna in the beginning of the measurement. For the distributed setup this is not the
case as many of the antennas are in NLOS and do not have the main gain of their antenna pattern
pointing towards the UE. Hence, the dip in the beginning of the measurement when moving from
the corridor into behind the equipment is less prominent and hence another dip is seen in Figure 50,
857008 5G-SMART 35Document: D4.2
Version: 1.0 Dissemination level: PU
Date: 2021-01-17 Status: Final
which actually is due to the UE antenna moving into an especially tricky corner behind the
equipment. Also due to the less prominent LOS, and hence almost removed blockage profile, the
channel gain fits within a range of only 4 dB for the whole measurement, as seen in Figure 52.
Figure 50: Channel gain over time and frequency for the vertically polarised UE antenna when scanning the
shadowed area on the right side of the corridor using 1 (lower) and 100 (upper) antennas of the distributed
array, respectively.
857008 5G-SMART 36Document: D4.2
Version: 1.0 Dissemination level: PU
Date: 2021-01-17 Status: Final
Figure 51: Empirical CDF for 1 and 100 antennas of the distributed array, respectively, when scanning the
shadowed area on the right side of the corridor with a vertical UE antenna.
Figure 52: Channel gain over time, averaged over frequency, for 100 antennas in the distributed array when
scanning the shadowed area on the right side of the corridor with a vertical UE antenna.
For the distributed setup, the corresponding results for the horizontally polarised UE antenna is seen
in Figure 53, Figure 54 and Figure 55. The results are very similar to the case for the vertical UE
antenna, although there seems to be more antennas having a close to horizontal polarisation with a
LOS link to the UE when placed in the middle of the corridor.
857008 5G-SMART 37Document: D4.2
Version: 1.0 Dissemination level: PU
Date: 2021-01-17 Status: Final
Figure 53: Channel gain over time and frequency for the horizontally polarised UE antenna when scanning the
shadowed area on the right side of the corridor using 1 (lower) and 100 (upper) antennas of the distributed
array, respectively.
Figure 54: Empirical CDF for 1 and 100 antennas of the distributed array, respectively, when scanning the
shadowed area on the right side of the corridor with a horizontal UE antenna.
857008 5G-SMART 38Document: D4.2
Version: 1.0 Dissemination level: PU
Date: 2021-01-17 Status: Final
Figure 55: Channel gain over time, averaged over frequency, for 100 antennas in the distributed array when
scanning the shadowed area on the right side of the corridor with a horizontal UE antenna
The same scanning experiment was done when also starting in the middle of the corridor but instead
moving into the shadowed area to the left and scanning the whole space. In comparison to the
previously analysed area, this one is more narrow and the equipment more compact. The
experiment was done with both the centralised and the distributed setup.
Figure 56: View towards the UE when scanning the shadowed area on the left side of the corridor.
The figures for the centralised array and vertically polarised UE antenna is depicted in Figure 57,
Figure 58 and Figure 59 and for the horizontally polarised UE antenna in Figure 60, Figure 61 and
Figure 62. For both cases the results are very similar as when scanning the shadowed area to the
right even though this area at first sight seems to be more complicated for the signal to reach at first
sight.
857008 5G-SMART 39Document: D4.2
Version: 1.0 Dissemination level: PU
Date: 2021-01-17 Status: Final
Figure 57: Channel gain over time and frequency for the vertically polarised UE antenna when scanning the
shadowed area on the left side of the corridor using 1 (lower) and 100 (upper) antennas of the centralised
array, respectively.
857008 5G-SMART 40Document: D4.2
Version: 1.0 Dissemination level: PU
Date: 2021-01-17 Status: Final
Figure 58: Empirical CDF for 1 and 100 antennas of the centralised array, respectively, when scanning the
shadowed area on the left side of the corridor with a vertical UE antenna.
Figure 59: Channel gain over time, averaged over frequency, for 100 antennas in the centralised array when
scanning the shadowed area on the left side of the corridor with a vertical UE antenna
857008 5G-SMART 41Document: D4.2
Version: 1.0 Dissemination level: PU
Date: 2021-01-17 Status: Final
Figure 60: Channel gain over time and frequency for the horizontally polarised UE antenna when scanning the
shadowed area on the left side of the corridor using 1 (lower) and 100 (upper) antennas of the centralised
array, respectively.
857008 5G-SMART 42Document: D4.2
Version: 1.0 Dissemination level: PU
Date: 2021-01-17 Status: Final
Figure 61: Empirical CDF for 1 and 100 antennas of the centralised array, respectively, when scanning the
shadowed area on the left side of the corridor with a horizontal UE antenna.
Figure 62: Channel gain over time, averaged over frequency, for 100 antennas in the centralised array when
scanning the shadowed area on the left side of the corridor with a horizontal UE antenna
The corresponding results for the distributed setup is seen in Figure 63, Figure 64 and Figure 65 for
the vertical UE antenna and in Figure 66, Figure 67 and Figure 68 for the horizontal UE antenna. Also
for the distributed setup, the results are similar to those obtained when scanning the shadowed area
to the right in the corridor.
857008 5G-SMART 43You can also read