After years of good market performance... What now? - Stephan Desplancke Director, BlackRock 17 November 2018
←
→
Page content transcription
If your browser does not render page correctly, please read the page content below
After years of good market performance...
What now?

Stephan Desplancke
Director, BlackRock

17 November 2018

                                            MKTG1118E-660057-2046515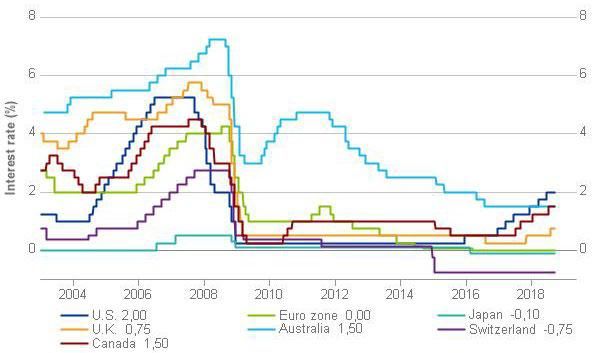
Contents

  01       Introduction

  02       Main topics of Q2 2018

  03       Diversification and resilience

  04       Conclusion

                                            MKTG1118E-660057-2046515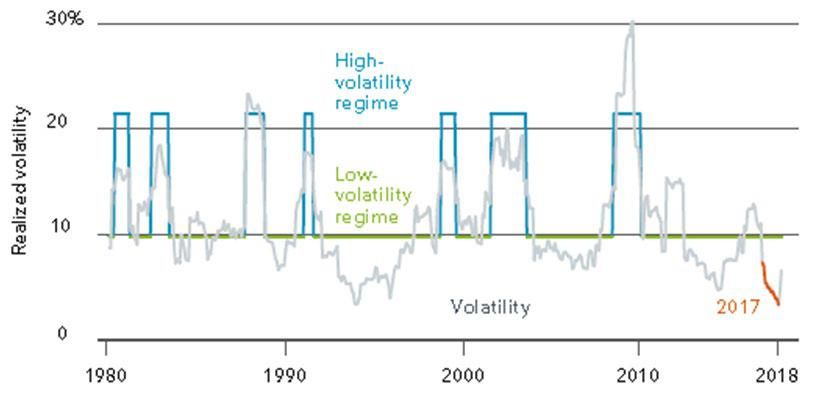
1. Introduction
2008 – 2017 ...

             Central bank balance sheets in US dollars                                        Central Bank interest rates

                                                 European Central Bank          U.S. 2,00               Euro zone 0,00      Japan -0,10
                                                 People’s Bank of China         U.K. 0,75               Australia 1,50      Switserland -0,75
                                                 Bank of Japan                  Canada 1,50
                                                 U.S. Federal Reserve

  Source: Thomson Reuters Datastream, BlackRock Investment Institute.     Source: Thomson Reuters Datastream, graph by BlackRock Investment Institute.
  As of 26 September 2018.                                                As of 26 September 2018.

                                                                                                                                        MKTG1118E-660057-2046515
                                                                                                                                                                   1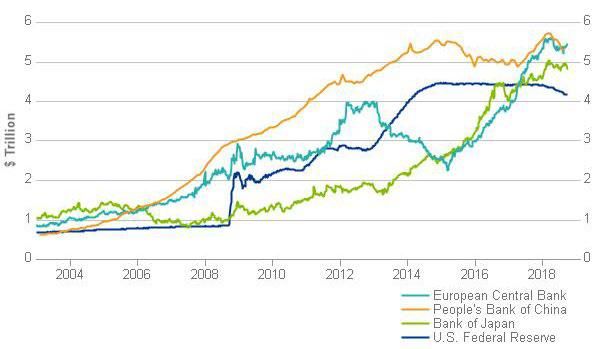
1. Introduction
Will the period of low volatility continue?

                                                        Realized monthly U.S. Equity volatility, 1980 - 2018

                  Realized volatility

                                                                                        Volatility

 Sources: BlackRock Investment Institute and Robert Shiller, February 2018.
 Notes: The grey line (volatility) shows the annualized standard deviation of monthly charges in the S&P 500 index over a rolling 12-month period. We calculate
 two historic states or regimes for volatility: a high-volatility regime and a low-volatility regime. The green/blue lines plot the average level of volatility during each
 regime based on data from 1871 to 2017. The estimate of historic regime is based on a expectation maximization algorithm using a Marlow-switching regression
 model.

                                                                                                                                                         MKTG1118E-660057-2046515
                                                                                                                                                                                    2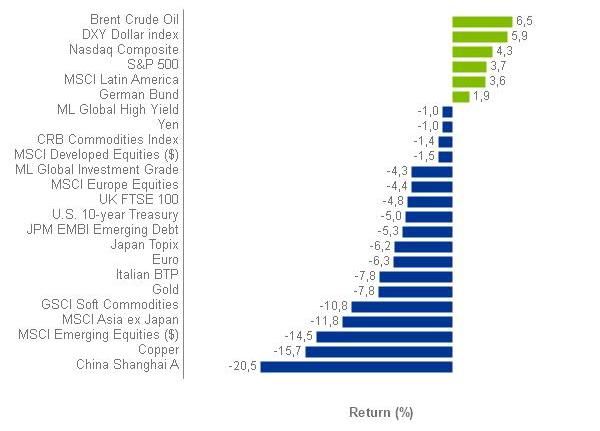
1. Introduction
Welke beleggingscategoriëen presteren het best dit jaar?

                                                        Asset performance – year to date

                                                                              Return (%)

Source: Thomson Reuters Datastream, chart by BlackRock Investment Institute
Note: The bars show the total return in local currency terms, except for currencies, gold and copper, which are spot returns. Government bonds are 10-year
benchmark issues. Euro and Yen are shown as strength vs. U.S. Dollar.

                                                                                                                                        MKTG1118E-660057-2046515
                                                                                                                                                                   3
2. Main topics of Q2 2018
Overview

    WIDER RANGE OF               TIGHTER FINANCIAL             GREATER PORTFOLIO
   GROWTH OUTCOMES                  CONDITIONS                    RESILIENCE

                                                               We remain "risk-on", but
    Economic uncertainty        Rising interest rates & a          the importance of
   increases, both positive   stronger USD contribute to      diversification is increasing
        and negative          stricter financial conditions

                                                                                          MKTG1118E-660057-2046515
                                                                                                                     4
2. Main topics of Q2 2018
Still room for further growth, but uncertainty increases
BlackRock Growth GPS vs G7 consensus, 2015–2018 Distribution of two-year forward U.S. GDP forecasts, 2018 vs. 2017
2,5
REAL GDP GROWTH (%)
RELATIVE FREQUENCY
2
1,5
0 1 2 3 4
2015 2016 2017 2018 U.S. GDP Growth (%)
BlackRock G7 Growth GPS G7 Consensus Sept 2018 (2020 forecast) Sept 2017 (2019 forecast)
There is no guarantee that any forecasts made will come to pass.
Sources: BlackRock Investment Institute with data from Consensus Economics,
October 2018. Notes: The GPS (green line) shows where the 12-month There is no guarantee that any forecasts made will come to pass.
consensus GDP forecast may stand in three months’ time. Consensus forecasts
are measured by Consensus Economics. G7 country components are weighted Source: BlackRock Investment Institute, with data from Consensus
by country GDP. The blue line shows the current 12-month economic consensus Economics, October 2018.
forecast for G7 economies. The GPS builds on existing nowcasting models that Notes: The lines show the distribution of two-year forward U.S. GDP
exploit the information from dozens of macroeconomic indicators to forecast GDP forecasts as of September 2018 and 2017. The vertical axis shows the
growth – including realized activity, employment, sentiment and survey data. relative frequency of each forecast.
MKTG1118E-660057-2046515
52. Main topics of Q2 2018
We expect trade conflicts to worsen before they get better
BlackRock Geopolitical Risk Indicator (BGRI): U.S. / China tensions, 2006-2018
4
3
Obama pivots
towards Asia
2
Trump tariff
BGRI SCORE
announcement
1
0
Obama – Xi summit
U.S. election
-1
-2
2006 2008 2010 2012 2014 2016 2018
Source: BlackRock Investment Institute, with data from Thomson Reuters. Data as of October 2018. Notes: We identify specific words related to each geopolitical risk
and use text analysis to calculate the frequency of their appearance in the Thomson Reuters Broker Report and Dow Jones Global Newswire databases as well as on
Twitter. We then adjust for whether the language reflects positive or negative sentiment, and assign a score. A zero score represents the average BGRI level over its
history from 2003 up to that point in time. A score of one means the BGRI level is one standard deviation above the average. We weigh recent readings more heavily
in calculating the average. The BGRI’s risk scenario is for illustrative purposes only and does not reflect all possible outcomes as geopolitical risks are ever-evolving.
MKTG1118E-660057-2046515
62. Main topics of Q2 2018
Return of inflation
BlackRock U.S. Inflation GPS vs. realised, 2014-2018
2,5
2,25
PERCENT
2
1,75
1,5
2014 2015 2016 2017 2018
U.S. GPS U.S. core inflation
Forward looking estimates may not come to pass.
Source: BlackRock Investment Institute with data from Thomson Reuters, October 2018. Notes: The chart shows U.S. core inflation (CPI) and BlackRock estimates of
where core inflation may stand in six months’ time.
MKTG1118E-660057-2046515
72. Main topics of Q2 2018
Higher interest rates & inflation lead to stricter financial conditions
Short duration U.S. Treasury and credit yields, 2010-2018
3
2
YIELD (%)
1
0
2010 2012 2014 2016 2018
U.S. 2-year government bond U.S. 1-3 year IG credit
Past performance is not a reliable indicator of future results. Indexes are unmanaged. It is not possible to invest directly in an index.
Sources: BlackRock Investment Institute, with data from Thomson Reuters and Bloomberg Barclays, July 2018. Notes: The lines show the yield on the Datastream 2-
year Benchmark Government Bond index and Bloomberg Barclays U.S. Credit 1-3 Years index.
MKTG1118E-660057-2046515
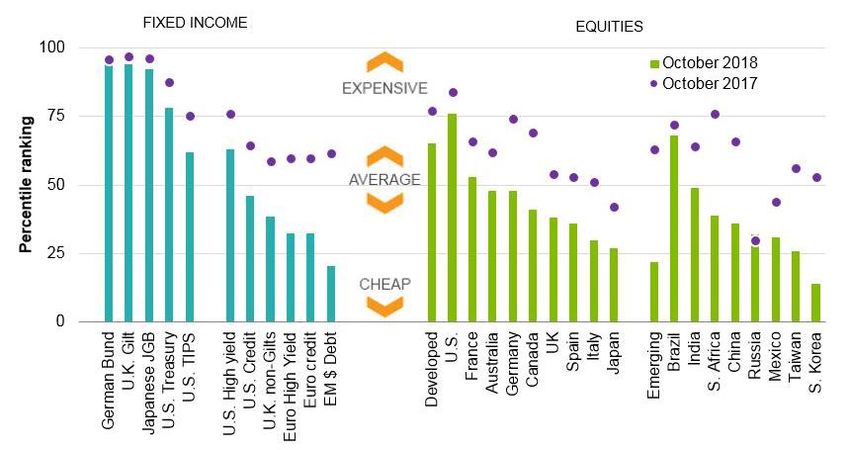
83. Diversification and resilience in the portfolio are essential
Valuation of assets vs. historic norm
Current valuation (bars) vs. one year ago (dots)
Sources: BlackRock Investment Institute, with data from Thomson Reuters, 31 October 2018.
Notes: the percentage bars show valuations of assets as of 31 October 2018, versus their historical ranges. For example, U.S. equities are currently on the 76th
percentile. This means U.S. equities trade at a valuation equal to or greater that 76% of their history. The dots show where valuations were a year ago. Government
bond are 10-year benchmark issues. Credit series are based on Barclays indexes and the spread over government bonds. Treasury inflation Protected Securities
(TIPS) are represented by nominal 10-year US treasuries minus inflation expectations. Equity valuations are base on MSCI indexes and are an average of
percentile ranks versus available history of earnings yield, cyclically adjusted earnings yield, trend real earnings, dividend yield, price to book, price to cash flow and
forward 12-month earnings yield. Historical ranges vary from 1969 (developed equities) to 2004 (EMS debt).
MKTG1118E-660057-2046515
93. Diversification and resilience in the portfolio are essential
This information is not intended as a recommendation to invest in any particular asset class or strategy or as a promise – or even an estimate - of future
performance. Source: BlackRock Investment Institute, August 2018. Data as of 30 June 2018 Notes: We derive our return expectations from our CMAs. Five-year
and long-term equilibrium annualised return expectations are in geometric terms. Return assumptions are total nominal returns. Return expectations for all asset
classes are shown in hedged terms, with the exception of EM equity, local-currency EM debt, hedge funds and private markets. We use long-term volatility
assumptions. We break down each asset class into factor exposures and analyse those factors' historical volatilities and correlations over the past 17 years. We
combine the historical volatilities with the current factor makeup of each asset class to arrive at our forward-looking assumptions. This approach takes into account
how asset classes evolve over time. Example: Some fixed income indices are of shorter or longer duration than they were in the past. Our forward-looking
assumptions reflect these changes, whereas a volatility calculation based only on historical monthly index returns would fail to capture the shifts. We have created
BlackRock proxies to represent asset classes where historical data is either lacking or of poor quality. Expected return estimates are subject to uncertainty and error.
Expected returns for each asset class can be conditional on economic scenarios; in the event a particular scenario comes to pass, actual returns could be significantly
higher or lower than forecasted.
MKTG1118E-660057-2046515
10Conclusion
1. Be careful with large concentrations in your portfolio…
► We prefer to invest in the United States
► We are positive, but selective about Emerging Markets with a preference for Asia
2. … but diversify
We have a preference for:
► Quality companies with strong balance sheets
► Short-term government and corporate bonds to reduce equity risk
► Bonds in Emerging Markets in USD
3. Less positive on Europe & United Kingdom
► Due to a weaker growth
Source: BlackRock Investment Institute. As of October 2018. Subject to change. This material represents an assessment of the market environment at a specific
time and is subject to change. This is not intended to be a forecast of future events or a guarantee of future results.
MKTG1118E-660057-2046515
11Alternative investments behave differently from traditional equities and bonds
Broad
diversification
Stable
returns
Liquid alternative
investments Better
result in … risk/return
profile
Reduce
downside risk
Managed
volatility
Source: BlackRock, June 2018. Diversification and asset allocation may not fully protect you from market risk.
MKTG1118E-660057-2046515
12Important information
BlackRock Capital Market Assumptions
This information is not intended as a recommendation to invest in any particular asset class or strategy or as a promise of future performance. Note that these asset class assumptions are passive,
and do not consider the impact of active management. All estimates in this document are in U.S. dollar terms unless noted otherwise. Given the complex risk-reward trade-offs involved, we advise
clients to rely on judgment as well as quantitative optimization approaches in setting strategic allocations to all the asset classes and strategies.
References to future returns are not promises or even estimates of actual returns a client portfolio may achieve. Assumptions, opinions and estimates are provided for illustrative purposes only.
They should not be relied upon as recommendations to buy or sell securities. Forecasts of financial market trends that are based on current market conditions constitute our judgment and are
subject to change without notice. We believe the information provided here is reliable, but do not warrant its accuracy or completeness. This material has been prepared for information purposes
only and is not intended to provide, and should not be relied on for, accounting, legal, or tax advice.
The outputs of the assumptions are provided for illustration purposes only and are subject to significant limitations. “Expected” return estimates are subject to uncertainty and error. Expected returns
for each asset class can be conditional on economic scenarios; in the event a particular scenario comes to pass, actual returns could be significantly higher or lower than forecasted. Because of the
inherent limitations of all models, potential investors should not rely exclusively on the model when making an investment decision. The model cannot account for the impact that economic, market,
and other factors may have on the implementation and ongoing management of an actual investment portfolio. Unlike actual portfolio outcomes, the model outcomes do not reflect actual trading,
liquidity constraints, fees, expenses, taxes and other factors that could impact future returns.
BlackRock 5-year asset return and long-term volatility assumptions
Five-year and long-term equilibrium annualized return assumptions are in geometric terms. Return assumptions are total nominal returns. Return assumptions for all asset classes are shown in
unhedged terms, with the exception of global ex-US treasuries. We use long-term volatility assumptions. We break down each asset class into factor exposures and analyse those factors' historical
volatilities and correlations over the past 15 years. We combine the historical volatilities with the current factor makeup of each asset class to arrive at our forward-looking assumptions. This
approach takes into account how asset classes evolve over time. Example: Some fixed income indices are of shorter or longer duration than they were in the past. Our forward-looking assumptions
reflect these changes, whereas a volatility calculation based only on historical monthly index returns would fail to capture the shifts. We have created BlackRock proxies to represent asset classes
where historical data is either lacking or of poor quality. Expected return estimates are subject to uncertainty and error. Expected returns for each asset class can be conditional on economic
scenarios; in the event a particular scenario comes to pass, actual returns could be significantly higher or lower than forecasted. The geometric return, sometimes called the time-weighted rate of
return, takes into account the effects of compounding over the investment period. The arithmetic return can be thought of as a simple average calculated by taking the individual annual returns
divided by the number of years in the investment period.
Index returns are for illustrative purposes only and do not represent any actual fund performance. Index performance returns do not reflect any management fees, transaction costs or expenses.
Indexes are unmanaged and one cannot invest directly in an index. Past performance does not guarantee future results.
MKTG1118E-660057-2046515
13Important information
This material is for distribution to Professional Clients (as defined by the Financial Conduct Authority or MiFID Rules) and Qualified Investors only and should not be relied upon by any other
persons.
Issued by BlackRock Investment Management (UK) Limited, authorised and regulated by the Financial Conduct Authority. Registered office: 12 Throgmorton Avenue, London, EC2N 2DL. Tel:
020 7743 3000. Registered in England No. 2020394. For your protection telephone calls are usually recorded. BlackRock is a trading name of BlackRock Investment Management (UK) Limited.
For qualified investors in Switzerland: this document shall be exclusively made available to, and directed at, qualified investors as defined in the Swiss Collective Investment Schemes Act of 23
June 2006, as amended. In Canada, this material is intended for permitted clients only, is for educational purposes only, does not constitute investment advice and should not be construed as a
solicitation or offering of units of any fund or other security in any jurisdiction. In Latin America and Iberia, for institutional investors and financial intermediaries only (not for public distribution). This
material is for educational purposes only and does not constitute investment advice or an offer or solicitation to sell or a solicitation of an offer to buy any shares of any fund or security and it is your
responsibility to inform yourself of, and to observe, all applicable laws and regulations of your relevant jurisdiction. If any funds are mentioned or inferred in this material, such funds may not been
registered with the securities regulators of Argentina, Brazil, Chile, Colombia, Mexico, Panama, Peru, Portugal, Spain Uruguay or any other securities regulator in any Latin American or Iberian
country and thus, may not be publicly offered in any such countries. The provision of investment management and investment advisory services is a regulated activity in Mexico thus is subject to
strict rules. For more information on the Investment Advisory Services offered by BlackRock Mexico please refer to the Investment Services Guide available at www.blackrock.com/mx. The
securities regulators of any country within Latin America or Iberia have not confirmed the accuracy of any information contained herein. No information discussed herein can be provided to the
general public in Latin America or Iberia. The contents of this material are strictly confidential and must not be passed to any third party.
Past performance is not a guide to current or future performance. Capital at risk. The value of investments and the income from them can fall as well as rise and is not guaranteed. You may not get
back the amount originally invested. Changes in the rates of exchange between currencies may cause the value of investments to diminish or increase. Fluctuation may be particularly marked in
the case of a higher volatility fund and the value of an investment may fall suddenly and substantially. Levels and basis of taxation may change from time to time. Any research in this document
has been procured and may have been acted on by BlackRock for its own purpose. The results of such research are being made available only incidentally. The views expressed do not
constitute investment or any other advice and are subject to change. They do not necessarily reflect the views of any company in the BlackRock Group or any part thereof and no assurances are
made as to their accuracy. This document is for information purposes only and does not constitute an offer or invitation to anyone to invest in any BlackRock funds and has not been prepared in
connection with any such offer.
This material is prepared by BlackRock and is not intended to be relied upon as a forecast, research or investment advice, and is not a recommendation, offer or solicitation to buy or sell any
securities or to adopt any investment strategy. The opinions expressed are as of October 2018 and may change as subsequent conditions vary. The information and opinions contained in this
material are derived from proprietary and non-proprietary sources deemed by BlackRock to be reliable, are not necessarily all-inclusive and are not guaranteed as to accuracy. As such, no
warranty of accuracy or reliability is given and no responsibility arising in any other way for errors and omissions (including responsibility to any person by reason of negligence) is accepted by
BlackRock, its officers, employees or agents. This material may contain “forward-looking” information that is not purely historical in nature. Such information may include, among other things,
projections and forecasts. There is no guarantee that any forecasts made will come to pass. Reliance upon information in this material is at the sole discretion of the reader. The information
provided here is neither tax nor legal advice. Investors should speak to their tax professional for specific information regarding their tax situation. Investment involves risk including possible loss of
principal. International investing involves risks, including risks related to foreign currency, limited liquidity, less government regulation, and the possibility of substantial volatility due to adverse
political, economic or other developments. These risks are often heightened for investments in emerging/developing markets or smaller capital markets.
©2018 BlackRock, Inc. All Rights Reserved. BLACKROCK is a registered trademark of BlackRock, Inc. or its subsidiaries in the United States and elsewhere. All other trademarks are those of
their respective owners.
MKTG1118E-660057-2046515
14You can also read