The Disconnect between Financial Markets and the Real Economy
←
→
Page content transcription
If your browser does not render page correctly, please read the page content below
August 26, 2020

   Special Notes Series on COVID-19
   The Special Notes Series includes short papers discussing critical economic issues related to COVID-19. Special Notes are
   important to quickly disseminate IMF expertise to member countries. The views expressed in these notes are those of the
   author(s) and do not necessarily represent the views of the IMF, its Executive Board, or IMF management.

The Disconnect between Financial Markets
and the Real Economy
Deniz Igan, Divya Kirti, and Soledad Martinez Peria 1

   The disconnect between the performance of stock markets and the real economy—starker in the United
   States but also present in Europe—has become a topic of much interest and debate. After considering
   several hypotheses for the disconnect, this note concludes that the most compelling is that unprecedented
   monetary policy actions, while needed to stem the impact of COVID-19, have driven asset prices up by
   causing a sharp drop in both risk premiums and risk-free discount rates. This suggests that withdrawal of
   these monetary policy actions could trigger a reversal.

After a sharp drop in late February and March, stock indices in the United States and Europe rebounded. The
rebound has stood in stark contrast with the deterioration in economic indicators, particularly in the United
States (Figure 1). 2 The emergence of this disconnect between markets and the real economy coincided with
announcements of unprecedented monetary policy actions. While these actions could have lifted valuations by
improving the fundamental outlook (disproportionately for listed firms) or lowering discount rates, other
explanations have also been proposed. This note examines several prominent potential hypotheses and weighs
the evidence for each of them.

1 We thank Giovanni Dell’Ariccia and Gita Gopinath for helpful discussions. Dalya Elmalt, Chenxu Fu, Yang Liu, and Mu Yang Shin provided excellent research
assistance. For further information, contact DIgan@imf.org, DKirti@imf.org, or MMartinezPeria@imf.org.
2 In Europe, there has been a recent uptick in economic sentiment potentially driven by the fact that the spread of the virus seems under control in most
countries.

IMF | Research                                                                                                                                              |1
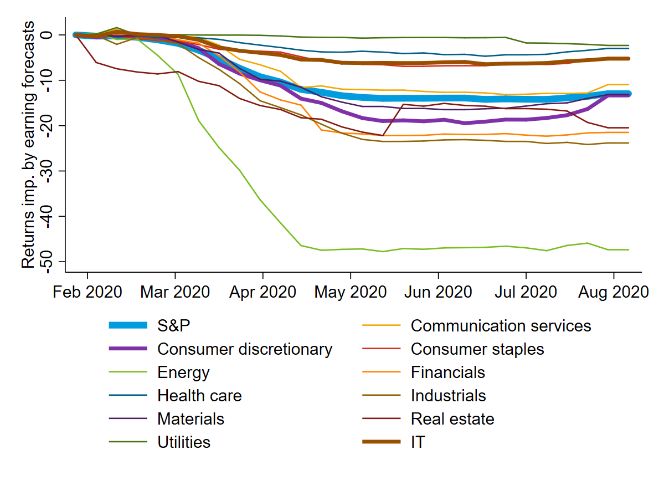
Figure 1. Disconnect between Stock Markets and Real Economic Indicators

       A.    United States                                                         B.    Europe
Sources: Bloomberg Finance L.P.; Conference Board; European Commission; Haver Analytics; Statistical Office of the European Communities; US Federal
Reserve Board; University of Michigan Survey; and IMF staff calculations.
Note: All series are indexed to 100 as of the last observation prior to January 2020. Stock market index levels are shown weekly. Monthly industrial production
and sentiment series are shown in the week of release.

I.          POTENTIAL EXPLANATIONS FOR THE DISCONNECT

HYPOTHESIS 1: The stock market is dominated by a few firms that have driven the rebound

In the United States, the top 5 firms (Apple, Microsoft, Amazon, Google, and Facebook—all tech firms), account
for 22 percent of the market capitalization and the top 10 account for 28 percent. In Europe, the share of market
capitalization of the top 5 and top 10 firms is approximately half as large: the top 5 firms (Nestle, Roche, LVMH,
Novartis, and L’Oréal) account for 11 percent and the share of the top 10 is 18 percent.

Looking at stock market returns separately by firm size, the top five firms in the United States have performed
somewhat better during the rebound since the end of March, while there is little evidence of differentiation by
size in Europe (Figure 2). However, even in the United States, the contribution to cumulative market returns
since March from the top 10 firms above and beyond firms outside the top 10 has been small (Figure 3). Hence,
the evidence provides little support for this hypothesis.

Figure 2. Cumulative Returns since Trough by Market Capitalization

                         A.    United States (S&P 500)                             B.    Europe (STOXX 600)

Sources: Thomson Reuters Datastream; and IMF staff calculations.
Note: This figure uses weekly data on market capitalization for constituents of the S&P 500 in the United States and the STOXX 600 in Europe. Both panels
show cumulative returns since the trough for the overall index in March, splitting out constituents by size measured by market capitalization.

IMF | Research                                                                                                                                                |2
Figure 3. Contribution to Cumulative Returns since Trough by Market Capitalization

        A.    United States (S&P 500)                                                B.    Europe (STOXX 600)

Sources: Thomson Reuters Datastream; and IMF staff calculations.
Note: This figure uses data on weekly market capitalization for constituents of the S&P 500 in the United States and the STOXX 600 in Europe. Both panels
show a breakdown of cumulative returns for the index into three components: (1) cumulative returns for firms outside the top 10 by market capitalization; (2)
excess cumulative returns for the top 5 firms over firms outside the top 10, scaled by their market capitalization weight in the index as of the trough; and (3)
excess cumulative returns for firms 6 through 10 over firms outside the top 10, scaled by their market capitalization weight in the index as of the trough.

HYPOTHESIS 2: The listed firms that constitute stock markets are less affected by the COVID
shock than the broader economy

The pandemic has primarily affected contact-intensive services sectors—transportation, retail sales, restaurants,
and hotels (Figure 4). Small and medium enterprises (SMEs) account for a significant portion of these most
affected sectors (30–55 percent of employment in the United States and 55–80 percent in Europe, Figure 5;
airlines are a prominent exception) and the economy at large (close to 45 percent of employment in the United
States and 65 percent in Europe).

Perhaps listed firms have simply weathered the shock better than smaller firms that matter more for real
economic activity. However, earnings projections for larger firms that are included in the main stock indices have
followed a similar trajectory to real GDP projections, which we can interpret as largely driven by the performance
of SMEs (Figure 6). This suggests that the dynamics of the (expected) real effects of the pandemic have not
been extremely different across firms of different sizes. 3 Hence, we do not see significant merit in this
hypothesis.

3 Chetty, Friedman, Hendren, Stepner, and the Opportunity Insights Team (2020) show (in Figure 14) that the impact of COVID-19 on firms’ sales varies very
little by firm size (outside of restaurants and hotels).

IMF | Research                                                                                                                                                     |3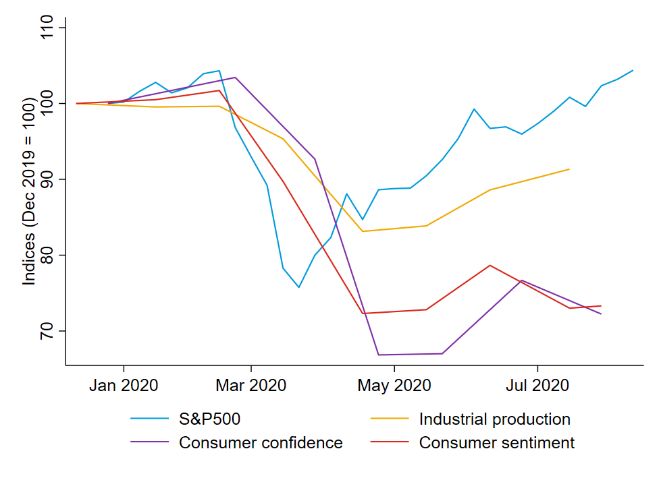
Figure 4. Real-Time Indicators of Sectoral Impact

     A. Consumer Spending (United States)

            B. Job postings (United States)                                              C. Job postings (Europe)

Sources: Affinity Solutions; Economic Tracker; Indeed.com; and IMF staff calculations.
Note: Panel A shows 7-day moving averages of credit/debit card spending relative to January 4–31, 2020, using data made available by Chetty, Friedman,
Hendren, Stepner, and the Opportunity Insights Team (2020). Retail sales (general merchandise and apparel and accessories), restaurants and hotels
(accommodation and food), and transportation (transportation and warehousing) are identified based on merchant type. Panels B and C show year-over-year
percent growth of job postings by sector in the United States and Europe (Austria, Belgium, France, Germany, Ireland, Italy, Netherlands, Spain, Sweden,
Switzerland, and United Kingdom). Daily data are collapsed to a weekly level. Retail sales (sales), restaurants (food), and hotels (hospitality) are identified
based on job categories.

Figure 5. SME Employment Share, by Region and Industry

Sources: Census County Business Patterns; OECD Structural and Demographic Business Statistics; and IMF staff calculations.
Note: This figure shows SME employment shares in selected industries for Europe and the United States as of 2017. Data for Europe are from the OECD
Structural and Demographic Business Statistics. The figure uses employment weights, covering the 19 eurozone countries (Austria, Belgium, Cyprus, Estonia,
Finland, France, Germany, Greece, Ireland, Italy, Latvia, Lithuania, Luxembourg, Malta, Netherlands, Portugal, Slovakia, Slovenia, Spain) and the United
Kingdom. Data for the United States are from the US Census Bureau County Business Patterns. SMEs are defined as firms with fewer than 250 (Europe) or 300
(United States) employees. Retail sale includes wholesale.

IMF | Research                                                                                                                                                    |4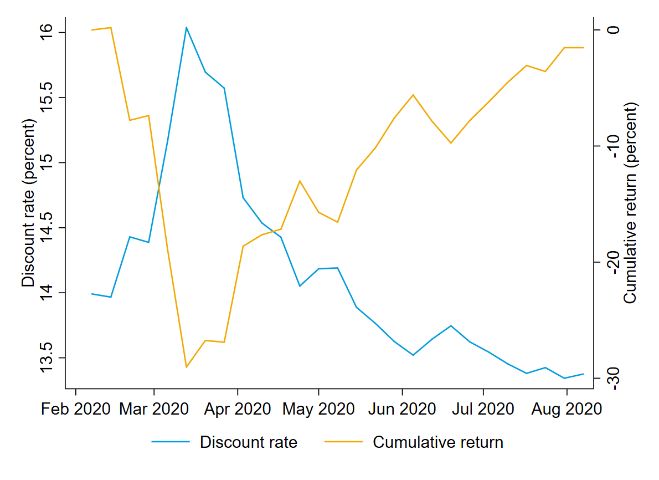
Figure 6. Forecasted GDP and Earnings Growth in 2020

       A.    United States                                                       B.    Europe

Sources: Blue Chip Economic Indicators; Haver Analytics; IBES Global Aggregates; Thomson Reuters Datastream; and IMF staff calculations.
Note: This figure shows forecasted GDP and earnings per share growth in 2020 (percent year-over-year). Earnings forecasts at a weekly frequency at the index
level are from IBES Global Aggregates. GDP growth forecasts at a monthly frequency are from Blue Chip Economic Indicators, updated in the second week of
each month. Consensus (average) forecasts are used.

HYPOTHESIS 3: Public policies ended up helping large companies much more than small
companies

Although policy packages in the United States and Europe were designed to support both SMEs and large firms,
we cannot completely rule out that in practice large firms may end up receiving more funds than SMEs.

In the United States, the funds appropriated to support SMEs (through the Small Business Administration, SBA)
amount to $732 billion—40 percent more than the $510 billion allocated to programs to prevent corporate
bankruptcy and backstop Federal Reserve facilities (some of which help not only corporates but also SMEs).
Looking at the outstanding amounts in Federal Reserve facilities, we observe that the two programs targeted to
SMEs (PPPLF and MSF) account for half of the support and programs that more exclusively benefit
corporations (CPFF and CCF) account for about a quarter of the total (Table 1). However, in practice some of
the support intended for SMEs ended up going to large firms. In particular, loan-level information on the
Paycheck Protection Program (PPP) indicates that entities structured as corporations received about two-thirds
of the funds dispersed so far although they account for about half of employment and payroll (Table 2; counts
based on company filings suggest that about 70 percent of the funds went to publicly traded firms). 4 By contrast,
partnerships and sole proprietorships received less than what would be commensurate with their representation
in the economy.

4 One caveat to note is that the quality of data on disbursement of PPP loans has been questioned.

IMF | Research                                                                                                                                           |5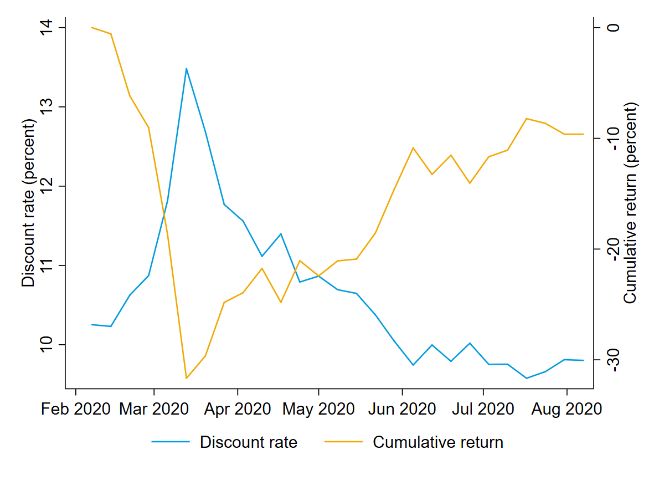
Table 1. Federal Reserve Facilities

                                                                                                        Outstanding                    Share of
                 Name                                 Purpose                                           (US$ billion, as of            total
                                                                                                        July 15)                       (percent)
                 Commercial Paper                     Liquidity backstop to issuers of
 CPFF                                                                                                   10.7                           5.2
                 Funding Facility                     commercial paper
                 Primary Dealer Credit                Collateralized loans to primary
 PDCF                                                                                                   1.7                            0.8
                 Facility                             dealers
                 Money Market Mutual                  Funding for purchase of money
 MMLF                                                                                                   19.6                           9.5
                 Fund Liquidity Facility              market mutual fund assets
                 Corporate Credit                     Credit and liquidity support for
 CCF                                                                                                    43.4                           21.0
                 Facilities                           corporate bonds
                 Term Asset-Backed                    Liquidity guaranteed by AAA-
 TALF                                                                                                   9.4                            4.6
                 Securities Loan Facility             rated ABS
                                                      Provide financial institutions
                 Paycheck Protection
                                                      with liquidity backed by loans
 PPPLF           Program Liquidity                                                                      68.0                           32.9
                                                      to SMEs under the PPP and
                 Facility
                                                      guaranteed by the SBA
                 Main Street Lending
 MSF                                                  Loans to SMEs                                     37.5                           18.2
                 Programs
                 Municipal Liquidity                  Liquidity to states, counties,
 MLF                                                                                                    16.1                           7.8
                 Facility                             and cities

Sources: Federal Reserve Board; Yale COVID-19 Financial Response Tracker; IMF Policy Responses to COVID-19 Tracker; and IMF staff calculations.

 Table 2. Distribution of PPP Loans by Business Type
                          Share in PPP loans:   Share in 2017 based on:
                                                Number of
                          $ Amount Count                         Employment                                                       Payroll
                                                firms
 Corporation              65.8       67.9       15.7             43.9                                                             52.7
 S-Corporation            20.3       20.1       51.4             27.2                                                             22.3
 Partnership              3.3        3.1        11.7             11.9                                                             10.7
 Sole Proprietorship      1.0        1.5        13.9             3.7                                                              2.5
 Nonprofit                8.5        6.4        7.2              12.9                                                             11.4
 Other                    1.2        1.0        0.1              0.4                                                              0.5
Sources: US Census Bureau; US Small Business Administration; and IMF staff calculations.
Note: Information provided by the SBA on the allocation of PPP loans covers only loans larger than $150,000 and gives a loan range rather than the exact loan
amount (150,000 to 350,000, 350,000 to 1 million, 1 to 2 million, 2 to 5 million, 5 to 10 million). To calculate the total dollar amount, we assume that the loan
amount equals the lower end of the range a loan is reported to be in.

In Europe the Pandemic Emergency Purchase Program (PEPP)—a temporary asset purchase program of
private and public sector securities (without a predetermined allocation between government and private
companies) totaling €1,350 billion—is not targeted to SMEs. But, so far, the program has not focused on
supporting large firms either since, as of July 2020, nearly 90 percent of the purchases were of public sector
securities (Table 3). Based on our calculations, 5 close to 2.5 trillion euros were allocated as grants, guarantees,

5 We use information collected from the European Commission, the European Systemic Risk Board, the COVID-19 Financial Response Tracker from the Yale
Program for Financial Stability, IMF Policy Responses to COVID-19 Tracker and EUR (2020), “The COVID-19 Impact on Bank Profitability and Solvency in
Europe,” forthcoming.

IMF | Research                                                                                                                                                 |6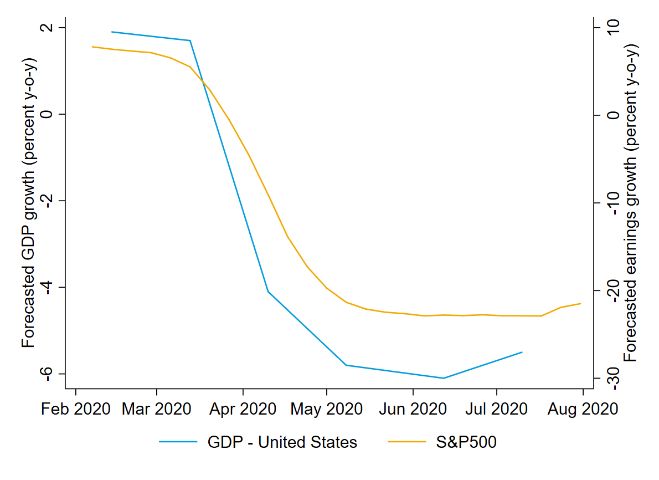
direct lending and capital injections to support firms. 6 Approximately 58 percent of this budget was not
earmarked by firm size, 17 percent was specifically targeted to SMEs, and 25 percent was set aside for large
firms. While a priori the allocation does not seem very skewed in favor of large firms, data on actual
disbursements (which is still spotty) will need to be analyzed to determine whether SMEs end up receiving much
less than large firms.
Table 3. Eurosystem Holdings under the Pandemic Emergency Purchase Program
Holdings (€ millions) Asset-backed Covered Corporate Commercial Public sector Total
securities bonds bonds paper securities
Holdings as at end-
July 2020 0 3,128 17,620 34,845 384,464 440,057
Share of total 0% 0.7% 4.0% 7.9% 87.4% 100%
Source: European Central Bank.
The evidence available so far is not entirely conclusive on whether SMEs were short-changed relative to large
firms in terms of the policies implemented in the United States and Europe. Also noteworthy is the fact that,
even if it were true that policies disproportionately supported large firms, we do not see any reflection of this in
earnings growth projections (Figures 6 and 7). Hence, we do not put a lot of weight on this explanation, given
the data available to date.
HYPOTHESIS 4: unprecedented monetary policy intervention supported asset valuations
In mid-March, both the Federal Reserve and the European Central Bank (ECB) announced significant
extensions to their asset purchase programs. On March 23, the Fed pledged to buy as much government-
backed debt as needed to support markets and expanded its purchases to corporate bonds for the first time in
its history. On March 18, the ECB announced the PEPP, first capped at €750 billion and subsequently extended
by an additional €650 billion at the beginning of June. In principle, unconventional monetary policy actions can
support valuations both by improving the fundamental outlook for firms, and/or by lowering discount rates. Given
the disconnect between stock markets and real indicators, any improvement in the fundamental outlook would
need to apply disproportionately to listed firms.
These programs likely played an important role in limiting financial instability, which would have added to the
direct macroeconomic impact of the pandemic. Nonetheless, they did not prevent the downward trajectory in
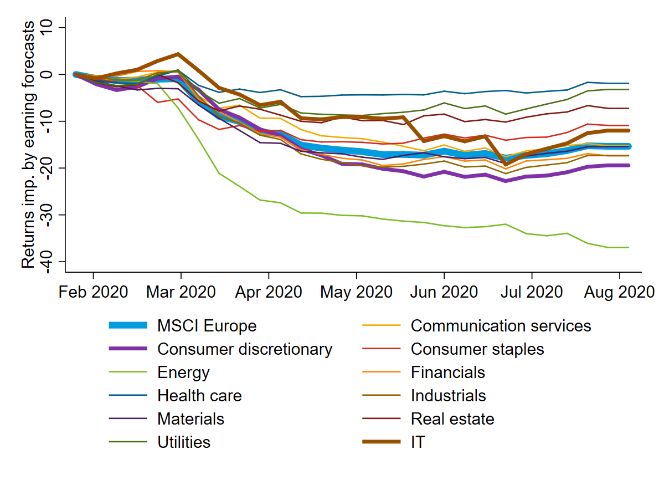
earnings projections for listed firms (Figure 6). The path of returns explained by medium-term earnings
projections (largely shared across sectors, perhaps with the exception of energy, likely reflecting recent
commodity price developments) does not mirror the recovery experienced in actual returns (Figure 7).
6 We consider programs implemented in Austria, Belgium, Denmark, Finland, France, Germany, Ireland, Italy, Netherlands, Norway, Portugal, Spain, Sweden,
Switzerland, and the United Kingdom.
IMF | Research |7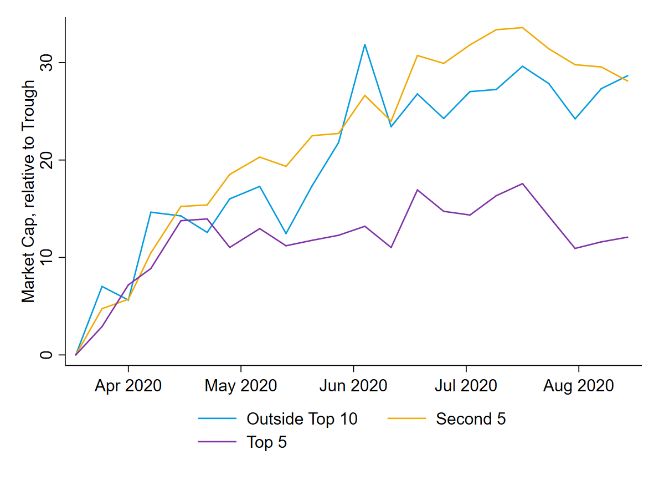
Figure 7. Cumulative Realized Returns and Returns Implied by Medium-Term Earnings Forecasts

       A.    United States (S&P 500)                                                    B.    U.S. Sectors (S&P 500)

       C.    Europe (MSCI – Europe)                                                D.    Europe Sectors (MSCI – Europe)

Sources: IBES Global Aggregates; Thomson Reuters Datastream; and IMF staff calculations.
Note: This figure shows realized cumulative returns and returns implied by medium-term earnings forecasts at each date holding discount rates and long-term
growth expectations fixed at the index and GICS sectoral level. Weekly data for earnings forecasts with the current fiscal year structure are available starting
February 12, 2020. Returns implied by earnings forecasts are calculated using earnings forecasts for the next three fiscal years following Landier and Thesmar
(2020). Assumptions for subsequent long-term growth rates are based on average earnings growth over 2015–19. The discount rate is held fixed to match the
initial price.

IMF | Research                                                                                                                                                |8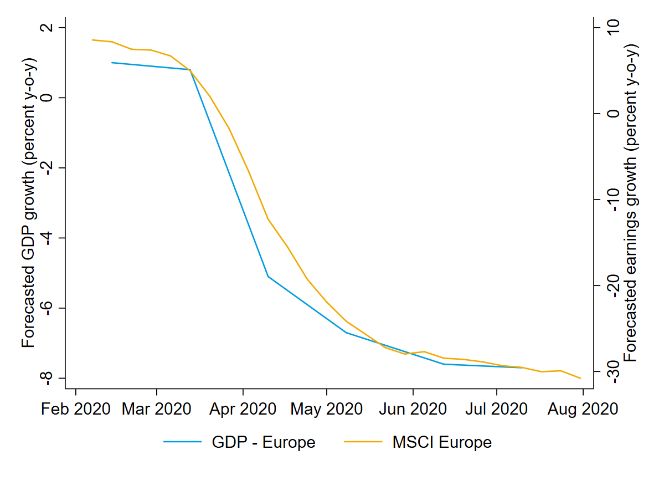
In contrast, these monetary policy announcements did appear to affect discount rates, which experienced a
sharp drop (Figure 8). This sharp drop in discount rates appears to account for much of the upward movement
in stock markets both in the United States and Europe. Figure 8 shows discount rates needed to justify actual
prices relative to medium-term earnings forecasts.

Figure 8. Discount Rates Implied by Prices and Medium-Term Earnings Forecasts

       A.    United States                                                           B.    Europe

Sources: IBES Global Aggregates; Thomson Reuters Datastream; and IMF staff calculations.
Note: This figure shows realized cumulative returns and discount rates needed to match realized cumulative returns given medium-term earnings forecasts at
each date holding long-term growth expectations fixed. Weekly data for earnings forecasts with the current fiscal year structure are available starting February
12, 2020. Discount rates needed to match prices given earnings forecasts for the next three fiscal years are calculated following Landier and Thesmar (2020).
Assumptions for subsequent long-term growth rates are based on average earnings growth from 2015 to 2019.

Comparing discount rates for stock markets to long-term real risk-free interest rates (available for the United
States), risk premiums (the difference between discount rates for risky and safe claims) have been an important
driver of the dynamics of stock market valuations (Figure 9). Unprecedented monetary policy actions appear to
have at least temporarily curtailed risk premiums in addition to lowering risk-free rates. Risk premiums have
been the primary channel through which monetary policy has impacted stock market valuations. 7

Figure 9. Stock Market Discount Rates and Risk-Free Real Rates (United States)

7 We do not assess whether stock markets are now more overvalued than prior to COVID-19. Figure 9 need not imply that stocks are not more overvalued now.
While risk-free rates can account for the net change in stock-market discount rates, it is possible that risk premiums should be higher than current levels.

IMF | Research                                                                                                                                                 |9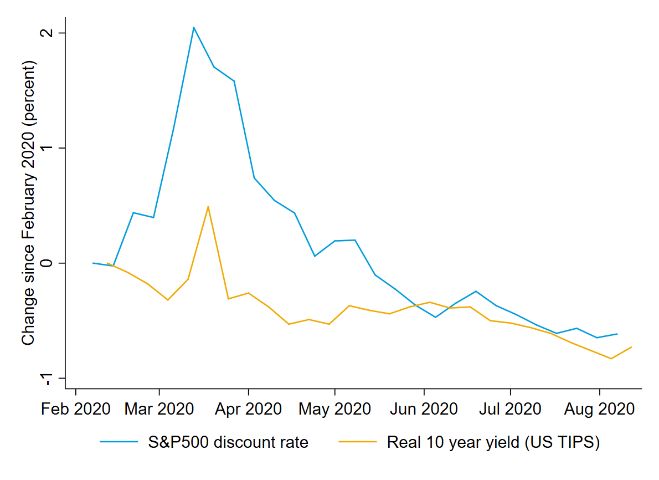
Sources: IBES Global Aggregates; Thomson Reuters Datastream; and IMF staff calculations.
Note: This figure shows changes since February 2020 in discount rates for the S&P 500 implied by medium-term earnings forecasts and the time series of
prices and average yields on all US Treasury Inflation-Protected Securities (TIPS) with maturity greater than 10 years.

II.        KEY TAKEAWAYS

This note carefully considers and weighs pertinent evidence for several potential explanations for the real-
financial disconnect. It concludes that the following explanation is most consistent with the facts: monetary
policy announcements in mid-March led to a significant decline in discount rates (both risk premiums and risk-
free rates) that lifted asset valuations. This may imply that a withdrawal of monetary policy actions could trigger
a reversal in asset valuations: risk-free rates would rise, but more importantly risk premiums may spike again.
Further, perceptions that monetary policy has supported financial markets and investors while being unable to
revive real activity and reduce unemployment could reignite the debate on the implications of monetary policy
actions for inequality and on central bank accountability and independence.

REFERENCES

Chetty, R., J. N., Friedman, N. Hendren, M. Stepner, and the Opportunity Insights Team. 2020. “How Did
          COVID-19 and Stabilization Policies Affect Spending and Employment?” NBER Working Paper No.
          27431, National Bureau of Economic Research, Cambridge, MA.
          https://www.nber.org/papers/w27431.
Landier, A., and D. Thesmar. 2020. “Earnings Expectations in the COVID Crisis.” NBER Working Paper No.
          27160, National Bureau of Economic Research, Cambridge, MA.
          https://www.nber.org/papers/w27160.

IMF | Research                                                                                                                                           | 10
You can also read