STATE ECONOMIC OVERVIEW - AUTHORS - January 2021 - Senior Economist - Australia Gareth Spence - NAB

Page created by Ricardo Ayala
 
CONTINUE READING
STATE ECONOMIC OVERVIEW - AUTHORS - January 2021 - Senior Economist - Australia Gareth Spence - NAB
STATE ECONOMIC OVERVIEW
January 2021

AUTHORS
Senior Economist - Australia   Senior Economist   Senior Economist, Research
Gareth Spence                  Tony Kelly         Kaixin Owyong

Photo Mai Thai
STATE ECONOMIC OVERVIEW - AUTHORS - January 2021 - Senior Economist - Australia Gareth Spence - NAB
STATE ECONOMIC OVERVIEW
Recovery from COVID-19 continues across Australia
The recovery from the pandemic-driven recession is well underway across all       Business conditions have recovered relatively quickly across the states, after
states and territories, although COVID-19 outbreaks continue to disrupt state     reaching a trough in May. The recovery has been strongest in WA and Tasmania
economies as they arise. Assuming a successful vaccination program and            but NSW, QLD and SA are also now firmly back in positive territory. Victoria has
continued fiscal and monetary policy support, and despite all the considerable    improved but remains negative with a delayed improvement following ongoing
uncertainties, we are expecting a strong recovery over 2021.                      lockdowns. In a levels sense, capacity utilisation shows that activity has also
The Q3 2020 national accounts showed a strong rebound in economic activity        seen a notable recovery, though it has a little further to go to reach pre-COVID
across the country, with the exception of Victoria which had significant virus-   levels in NSW, Victoria and QLD and WA. Forward looking indicators suggest
related restrictions in place that quarter. However, since then, higher           ongoing improvements across the states.
frequency data shows that once restrictions were removed, activity lifted         In addition to the fiscal support provided by the federal government and
significantly in Victoria – a similar experience to elsewhere. Similarly high     impact of record low interest rates, state governments have also provided
frequency data show only short-lived impacts from the brief South Australia       significant support. For NSW and Victoria this is largely an infrastructure story
(November) and Queensland (January) shutdowns, while the impact on NSW of         while most have sought to provide tax relief and support to small business –
the milder but longer northern beaches shutdown (and broader Greater              particularly those hard-hit by recent lockdowns.
Sydney measures) is less noticeable, although NSW is lagging on some of these     The recovery is also evident in labour markets. In December, the level of
indicators.                                                                       employment was around or higher than its pre-COVID (Feb.) level in
These data show that the major hit to activity across the states came through     Queensland, WA, SA and the ACT. Victorian employment has also rebounded
household consumption – particularly in spending on services. Services            strongly post lockdown but NSW lost some ground at the end of 2020, while NT
consumption has seen a broad-based rebound across the states, though both         and Tasmania have stalled. More timely payrolls data, indicate that payroll jobs
international and domestic border restrictions as well as ongoing work from       at the start of 2021 were higher than a year ago, with the exception of
home policies are likely to see a slower recovery in travel services.             Tasmania and only just in the case of Victoria. Moreover, unemployment rates
There was less uniformity in the other components of state final demand.          still remain higher than their pre-COVID-19 level in most states and territories.
Dwelling construction saw large hits in Victoria, NT and the ACT. Business        This will likely represent a headwind to wages growth, which in Q3 2020 fell to
investment declined in all states but saw larger falls in Vic, Tas and the ACT    very low levels across the all state and territories.
than the other states over the first three quarters of 2020. Government           International border restrictions remain a constraint, while state borders
consumption saw the strongest gains in the ACT and the largest three states.      continue to be affected by COVID outbreaks. These controls have implications
                                                                                  for state population growth and sectors of the economy such as tourism and
NAB STATE & TERRITORY ECONOMIC FORECASTS                                          education (overseas students). Population growth has slowed notably in
NAB growth forecasts for the states & territories                                 Victoria, the NSW and ACT; in contrast population growth in WA has picked up
                        Gross State Product YoY                                   (temporarily) and the outflow from the NT has stabilised.
                     18-19f     19-20f     20-21f   21-22f                        While international tourism is still basically non-existent, increased domestic
NSW                    2.6       -0.7        0.0      2.7                         tourism will provide some partial offset, particularly for regional Australia.
VIC                    3.1       -0.5        -2.9     6.3                         However, education exports remain weak, and this is particularly important for
QLD                    0.9       -1.1        1.0      3.5                         NSW, Victoria, Tasmania and the ACT.
SA                     1.1       -1.4        0.5      3.5                         The agricultural sector is a more positive story with prices generally still at high
WA                     1.6        1.4        2.0      3.0                         levels and a solid winter crop in Western Australia and a bumper crop in the
TAS                    3.3        0.3        -0.7     4.1                         east coast (particularly NSW) expected.
NT                     -1.3       5.3        4.2      1.5
ACT                    3.8        2.4        0.3      3.0
Australia              2.2       -0.2       -0.1      3.8
STATE ECONOMIC OVERVIEW - AUTHORS - January 2021 - Senior Economist - Australia Gareth Spence - NAB
STATE BY STATE
NSW                                                                                                            latter of which will have a peak impact in early
                                                         This rebound in activity is encouraging and
                                                                                                               2021). In addition to the impact of international
The NSW economy is rebounding from the impacts           suggests the recovery in Victoria should broadly
                                                                                                               border closures, the state border remained closed to
of bushfires and COVID-19 in the first half of 2020.     follow the path of other states, albeit with a lag.
                                                                                                               both NSW and Victoria for a significant part of the
While the state has seen periodic COVID-19               That said, significant stimulus from the Victorian    last year, which has seen sectors reliant on domestic
outbreaks, targeted restrictions and contact tracing     government will be needed to support activity as      tourism seeing ongoing impacts.
has been sufficient to contain the virus – but has       Victoria faces additional headwinds given its
effectively seen a border closure as a result of other                                                         The labour market has seen a very welcome
                                                         extended lockdown and relatively large exposure
states’ actions.                                                                                               rebound, with QLD one of only two states to have
                                                         to inbound migration. On this front, the Victorian
                                                                                                               more than recovered its pre-virus employment
The labour market has performed relatively well,         government has announced stimulus worth
                                                                                                               levels. Households will likely see a recovery in
with NSW recording one of the lowest                     $25.4bn in the next three years to FY23, the
                                                                                                               spending habits in the near term, before spending
unemployment rates at the end of 2020, while             biggest package of any state or territory. This
                                                                                                               growth slows to broadly match income growth.
employment as recovered over 80% of its fall in          should help support a steady recovery such that
April/May 2020. International education exports are      we expect annual GSP to exceed pre-virus levels       With the housing market less reliant on the
the second largest export (after coal) for NSW and       in FY22.                                              international and investment segments, the
while most students remained in the state through                                                              fluctuation in prices has been less pronounced than
the pandemic, enrolments have declined sharply.                                                                in Sydney and Melbourne. In addition, the
Tourism is the third largest export and has collapsed                                                          construction sector which has also seen a less
completely.                                                                                                    pronounced cycle in recent years appears to have
                                                                                                               held up. Further, building approvals have seen an
In addition to the Federal government’s support
                                                                                                               large pick-up on the back of the Federal
measures, NSW has benefited from a range of state
                                                                                                               Governments HomeBuilder program pointing to a
specific programs – with the centrepiece the bring-
                                                                                                               growing pipeline of work in the state.
forward of planned infrastructure spending. There is
also an increasing focus on longer term reforms –
notably plans to phase out stamp duty.                                                                         South Australia
                                                                                                               The SA economy contracted 1.4% in 2019-20, the
Victoria                                                                                                       largest fall of any state or territory. While SA saw
                                                                                                               one of the biggest hits to demand in Q2 2020, this
The successful containment of Victoria’s second
                                                                                                               outcome also partly reflects softer growth in the
wave has seen restrictions lift and kickstarted the
                                                         Queensland                                            lead up to the pandemic. Domestic demand has
economic recovery. Employment has rebounded to
                                                                                                               since rebounded, to be just 1% below pre-virus
be 1.4% below pre-virus levels, up from the 6.4%         Queensland saw one of the smaller hits to
                                                                                                               levels, similar to most other states, except Victoria
trough reached amid Melbourne’s stage 4                  activity in early 2020 but still marked a sizable
                                                                                                               and NSW, which continue to lag behind.
lockdown. Further, Victorian retail sales rose by a      6.1% decline in domestic final demand (activity
sharp 22% in November (albeit supported by Black         excluding trade) as, like the rest of Australia,      We expect the recovery in SA to play out similarly to
Friday sales) marking the largest post-lockdown rise     consumer spending fell at the start of the            Australia as a whole. Going forward, we forecast
of all the states. While there was a correction in       pandemic. Elsewhere, mining exports (coal and         growth of 0.5% in FY21 and 3.5% in FY 22. This
December this still left sales above its pre-virus       LNG) have seen a COVID-related hit, as has            would be an quicker recovery than
levels consistent with a notable recovery but also       international tourism and education exports (the      forecast by SA Treasury.
reflecting the change in spending patterns caused
by the virus.
STATE BY STATE
Beyond that, we expect SA to growth to slow.        level since 2015. The expected turnaround in         to 3.1% and 5.2% nationally. As such we forecast a
We would expect stronger growth than it’s pre-      residential construction, a rise in mining           slower start to the recovery in Tasmania, compared to
virus post GFC average of 1.3%, reflecting          investment (supported by high iron ore prices)       many of the other states, with growth of -0.7% in FY21.
infrastructure projects and shipbuilding, but a     and the rebound in consumer spending as the
slower pace of growth than expected by SA           health outlook remains positive should see
Treasury.                                                                                                NT
                                                    relatively strong economic growth in FY21. NAB
                                                    forecasts growth of 2% in FY21, the second           Amid the impact of the pandemic – where the NT has
                                                    highest of the states of territories and for it to   fared relatively well compared with other jurisdictions
                                                    lift to 3.0% in FY22.                                – the NT economy has continued to transition away
                                                                                                         from the construction phase of the LNG boom to the
                                                                                                         export phase. The decline in business investment
                                                                                                         appears to have largely tailed off and the population
                                                                                                         appears to be stabilising as the labour force
                                                                                                         normalises.
                                                                                                         The NT has benefited from the national economic
                                                                                                         supports but in addition has also seen a boost from
                                                                                                         additional defence spending, with a boost to
                                                                                                         construction sector from the government’s base
                                                                                                         improvement program.
                                                                                                         While volatile at the territory level, the NT has seen a
Western Australia                                                                                        relatively strong rebound in the labour market with
                                                                                                         the unemployment now broadly where it was pre-
The WA economy grew by a solid 1.4% in
                                                                                                         COVID.
2019-20, in contrast to the contraction in other    Tasmania
major states (NSW, Vic and Qld), as WA was
able to control the virus relatively quickly in     In Q3, Tasmanian final demand rebounded to
                                                    be just 2.1% below pre-virus levels. This marks a    ACT
early 2020. Demand in WA has continued to
                                                    solid start to its economic recovery and,            The ACT was the only state/territory where domestic
recover and is now just 1% below pre-virus
                                                    alongside other data, suggests that the              final demand remained above its end 2019 level over
levels, although, consistent with the rest of the
                                                    economic hit from the pandemic may not be as         the first nine months of 2020, driven by public
country, private demand remains weaker at
                                                    severe as the Tasmanian Treasury forecasts.          demand. Similarly, employment is up; while
1.9% below pre-virus levels.
                                                                                                         unemployment is still above where it was at the start
WA has also fared better than the other major       However, Tasmania’s economic recovery faces
                                                                                                         of 2020 this reflects an increase in workforce
states as population growth has remained            headwinds from ongoing and intermittent
                                                                                                         participation.
relatively supported, as it is less exposed to      border closures. The Tasmanian economy is
                                                    relatively reliant on tourism, where prior to the    The ACT should benefit from the broader recovery
overseas migration and the national border
                                                    pandemic tourism made up 5.4% of the state’s         underway, but a winding down in public spending and
closures. As such, government home-building
                                                    economy and 9% of the labour force, compared         slower population growth will be headwinds and
grants, have been able to spur a sharp rise in
                                                                                                         education exports may take time to recover even
building approvals, which are at their highest
                                                                                                         when the border re-opens.
STATE OVERVIEW – Q3 STATE FINAL DEMAND AND EXPORTS
Victoria hit hard by COVID-19 lockdown but otherwise a strong recovery in Q3 state demand led by consumption with
ongoing support from public demand; investment and overseas exports are still under pressure
State final demand – strong recovery in Q3                 Similar pattern for private consumption; Support coming from public demand;
ex Vic.; Qld, ACT above end ‘19 level                      Qld back to pre-COVID level              particularly in the ACT
State final demand, s.a., chain-volume,                    Household consumption, s.a., chain-volume,           Underlying public demand, s.a., chain-volume,
Dec qtr ‘19 = 100                                          Dec qtr ‘19 = 100                                    Dec qtr ‘19 = 100
 105                                                      110                                                   115

                                                          105
 100                                                                                                            110
                                                          100

  95                                                       95                                                   105

                                                           90
  90                                                                                                            100
                                                           85

  85                                                       80                                                    95
        Dec-19      Jun-20      Dec-19     Jun-20               Dec-19    Jun-20      Dec-19     Jun-20                   Dec-19       Jun-20        Dec-19       Jun-20
            NSW          Vic.        Qld            SA              NSW        Vic.        Qld        SA                      NSW          Vic.          Qld          SA

            WA           Tas.        NT             ACT             WA         Tas.        NT         ACT                     WA           Tas.          NT           ACT

 Business investment under pressure; WA                   Dwelling investment showing mixed                      Overseas exports well below pre-COVID-
 falling in line as mining feels pinch                    trends across the states                               19 levels with services (travel) hardest hit
 Underlying business investment, , s.a., chain-           Dwelling GFCF, s.a., chain-volume, Dec qtr ‘19 =       Exports, s.a., chain-volume, % change between
 volume, Dec qtr ‘19 = 100                                100                                                    Q4 2019 and Q3 2020
  110                                                     150
                                                                                                                  20

  105                                                     140
                                                                                                                      0
                                                          130
  100
                                                          120                                                     -20
   95
                                                          110                                                     -40
   90
                                                          100
   85                                                                                                             -60
                                                          90
   80                                                                                                             -80
        Dec-19      Jun-20      Dec-19     Jun-20         80                                                                   Goods      Services     Total
                                                                Dec-19    Jun-20      Dec-19     Jun-20
             NSW         Vic.        Qld        SA
                                                                                                                 -100
             WA          Tas.        NT         ACT
                                                                    NSW        Vic.        Qld            SA
                                                                                                                            NSW Vic.      Qld     SA    WA     Tas.   NT    ACT
                                                                    WA         Tas.        NT             ACT
Sources: ABS, NAB
COVID-19   REMAINS A FOCUS
COVID-19 still well contained in Australia but occasional flare ups – and policy response – continue to disrupt state
economies
 Flare ups in COVID-19 cases continue but         In response to flare ups, governments                                Hospitality bounce back in Vic; NSW lagging
 overall the virus remains under control          continue to be aggressive in taking                                  somewhat & Qld 8-11 Jan lockdown evident
 Number of new cases, per day, up to 20 Jan. 2021 measures to suppress virus: Recent changes                           OpenTable, seater diners, y/y (7 day m.a.), last
                                                           to restrictions                                             observation 12 Jan.
                                                                                                                        300
                                                                                                                                   New South Wales
                                                           Victoria                                                                Queensland
                                                           State ‘re-opened’ in states between Sept and November        200
                                                                                                                                   Victoria
                                                           South Australia
                                                           6 day lockdown announced by on 17 November; ended            100
                                                           early on 21 November
                                                                                                                         0
                                                           NSW
                                                           Further roll back of COVID restrictions – 2 Dec.
                                                                                                                       -100
                                                           Northern beaches – stay at home advisory 17 Dec.,              01-Mar      01-Jun      01-Sep    01-Dec
                                                           lockdown 19 Dec to 10 January
                                                           Limits on numbers at events/venues (hospitability,           Consumer spending in most states/terr.
                                                           gyms, churches) for Greater Sydney; announced                Higher than a year ago; NSW, ACT lagging
                                                           between 20 Dec. & 2 Jan                                      Consumption spending, % yoy*
                                                           Other states placed (differing) restrictions on travel to   25%
                                                           their state by Sydney residents – December
                                                                                                                       15%
                                                           Queensland
                                                           Greater Brisbane lockdown 8 Jan.- 11 Jan. followed by        5%
                                                           venue/gathering capacity restrictions for 10 days
                                                                                                                       -5%
                                                          Lockdown affects on mobility evident for                     -15%
                                                          SA, Qld, less so for NSW – Vic still lagging
                                                          Google mobility report - visits: recreation. & retail        -25%
                                                          (% deviation from baseline, 7day ma)                           11/01/20               11/07/20             09/01/21
                                                           30                                                                  NSW             QLD         VIC          WA
                                                           20
                                                                                               NT                       25%
                                                           10     Qld        WA
                                                            0                                                           15%
                                                          -10
                                                                                                                         5%
                                                          -20             NSW
                                                          -30                                  ACT
                                                                                                                        -5%
                                                          -40                                       SA
                                                                                                                       -15%
                                                          -50                 Vic
                                                                                         Tas
                                                          -60                                                          -25%
                                                          -70                                                            11/01/20              11/07/20              09/01/21
                                                            21-Feb 20-Jun 18-Oct 27-Feb 26-Jun 24-Oct                           ACT            NT          SA          TAS
Sources: ABS, Macrobond, OpenTable, Google, NAB. *See NAB Economics Data Insights for more detail
BUSINESS SECTOR
Business conditions have rebounded strongly (ex Vic) and investment expectations are showing signs of recovery
 Business conditions have rebounded                             In a levels sense, capacity utilisation has also              Rebound in commodity prices a positive
 strongly, and are now above average in                         made a significant recovery. SA and Tas are                   for mining states – particularly WA with
 most states, except for Vic.                                   now above pre-COVID levels.                                   iron ore reaching multi-year highs
 NAB Business Survey, Business conditions , s.a.                NAB Business Survey, Capacity utilisation (%), s.a.           Mineral exploration expenditure ($m), NAB USD
                                                                                                                              non-rural commodity price index
   40
                           NSW              VIC           QLD   95                                                            600                                                        1200
   30                                                           90        Feb-20           Apr-20     Nov-20                          Mineral exploration (RHS)
                           SA               WA            TAS                                                                                                                     Fcst
                                                                                                                                      2019 state shares:
                                                                85                                                            500                                                        1000
   20                                                                                                                                 WA 62%
                                                                                                                                      Qld 13%
   10                                                           80                                                            400     NSW 11%                                            800
                                                                75                                                                    NT 5%
    0
                                                                70                                                            300                                                        600
  -10
                                                                65                                                            200                                                        400
  -20                                                           60
  -30                                                           55                                                            100                                                        200
                                                                                                                                          NAB non-rural commodity price
  -40                                                           50                                                                        index (LHS)
                                                                                                                                0                                                        0
        2019                        2020                               NSW         Vic      Qld     WA         SA     Tas       Dec-00        Dec-06       Dec-12      Dec-18

    Investment expectations started to                           Commercial property sentiment improved                     Commercial property weakness is centred on
    recover in Q3; particularly SA and WA                        in Q3 (ex Vic) but remained weak and                       offices and (outside WA) retail and
    NAB Q3 2020 Qtly business survey, 12 mth                     outlook generally negative outside WA                      (nationally) hotels; industrial doing better
    capex expectation                                            Q3 2020 NAB Commercial Property Survey,                    Q3 2020 NAB Commercial Property Survey,
                                                                 Commercial property index                                  Commercial property index
                                                                20
    60                                                                                                                              NSW
                                                                10
    50                                   Tas.
                                                                 0
    40                                                                                                                         Victoria
                Vic.                                            -10
    30                                                    SA
                                                                -20
    20                                                                                                                              Qld
                Qld                                             -30
                       NSW
    10
                                                                -40
        0                                                                                                                           WA
                                                     WA         -50
    -10
                                                                -60                                                             SA/NT
    -20
                                                                -70
    -30
                                                                -80                                                                    -125     -100    -75   -50    -25      0     25
       Jun-16     Jun-18        Jun-20      Dec-17   Dec-19
                                                                        Q2'20         Q3'20       Next 12m      Next 2y                       Industrial    Retail   Office
Sources: ABS, NAB                                                 Australia     Victoria    NSW     Qld      SA/NT   WA
LABOUR MARKET
Labour market is recovering although unemployment is still higher than pre-COVID-19 in almost all states/territories
Monthly employment – Vic joining in                                  Weekly payrolls more positive - currently in                                    Unemployment rate has eased from its
recovery post lockdown; ACT. Qld, SA                                 a seasonal lull but at above level of a year                                    peak; Tas & Qld still elevated but NT
above pre-COVID (Feb.) levels, WA close                              ago in all states other than Tas.                                               around its pre-COVID level
Hours worked s.a., Feb 2020 =100                                     Weekly payroll jobs, 14 March = 100, n.s.a.                                  Unemployment rate (%), s.a.
                                                                     Data to 2 January 2021                                                      10
  105                                                                                                                                                9
                                                                      105                                                                                     WA
                                                             ACT                                                                                                             Qld                          Tas.
                                                                                                        WA                                NT         8
                                                                                     Qld
                              WA                                      102                                                                            7
                                                                                                                                                                                                              SA
  100                                                                                                                                                6
                       Qld                              SA
                 NSW                                                                                                                                 5 Vic.                                                   NT
                                                         Tas.            99
                                                                                               NSW                                                   4            NSW
                                                                                                                                  SA
                                                                                                                                                                                                   ACT
   95                                                        NT          96                                                                          3
                                                                                                                                  Tas.               2
                              Vic.
                                                                         93                         Vic.                                 ACT         1
   90                                                                                                                                                0
        Jan-20       Jul-20          Jan-20   Jul-20                                                                                                     Jan-20     Jun-20   Nov-20       Apr-20     Sep-20
                                                                         90
                                                                          04/01        09/05   12/09                 11/04    15/08      19/12
 Workforce participation rebound (ex NT)                           As do higher job vacancies, particularly                                      Wage growth slowed to a very low level in
 also points to labour mkt gains                                   outside NSW and Victoria                                                      Q3; only WA & NT not at record low
 Workforce participation rate (%), s.a.                            Qtly ABS job vacancies, Dec 19 =100, nsa,                                     Wage Price Index, hourly, ex bonuses, y/y%

   79                                                              160                                                                           7                                 NSW         Vic
                                                       ACT         140                         WA                                                                                  Qld         SA
                                                                                                                             SA                  6                                 WA          TAS
   74
                                                                   120                                                ACT                                                          NT          ACT
                                                                              Vic.              Qld        NT                                    5
                          WA                                 NT
   69                                                              100
                                                                                                                                                 4
                              Qld                                   80
                                                                                     NSW                   Tas.
   64                                                                                                                                            3
          NSW                                  SA                   60
                           Vic.                                                                                                                  2
                                                                    40
   59
                                                    Tas.                                                                                         1
                                                                    20

   54                                                                0                                                                           0
        Jan-20Apr-20 Jul-20 Oct-20 Jan-20Apr-20 Jul-20 Oct-20         Dec-18         Dec-19    Dec-20       Jun-19      Jun-20                   Sep-05       Sep-08    Sep-11   Sep-14    Sep-17    Sep-20

Sources: ABS, NAB
HOUSEHOLDS – CONSUMPTION & HOUSING MARKET
Consumer spending is bouncing back – but mixed across sectors - and housing markets are showing some life
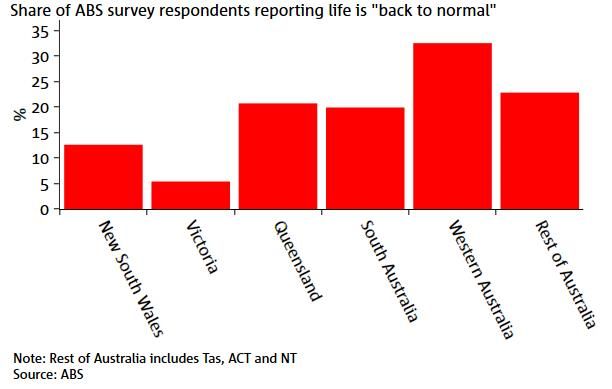
 Most people do not think life has                         Reflected in huge shifts in spending patterns                     Retail sales rebound had lost steam in some
 returned to normal                                        even as total consumption recovers                                states but signs of life in November, while
 ABS survey 13-23 November 2020                            Household consumption – selected components,                      Vic. roared back post-lockdown
                                                           change Q4 ’19 to Q3 ‘20,chain volumes, s.a.                       Retail sales, Jan 2020 = 100
                                                            40                                                              125

                                                            20                                                              120
                                                                                                                                             WA
                                                                                                                            115                                        ACT
                                                               0                                                                                          Qld
                                                           -20                                                              110
                                                                                                                                                        NSW                         SA
                                                           -40                                                              105
                                                                                                                                                                                NT
                                                           -60                                                              100
                                                           -80                                                              95                          Vic.
                                                          -100                                                              90
                                                                                                                                                                             Tas.
                                                                                                                            85
                                                                                                                            80
                                                                                                                                  Jan   Apr       Jul      Oct   Feb    May Aug          Nov
                                                                   NSW   Vic    Qld   SA    WA    Tas   NT    ACT

  Housing markets have held up well despite the increase in unemployment; helped by low interest rates and government
  support - building approvals showing signs of life in most states (particularly in the west), house prices are rising again and
  expected to increase further over the next two years
  CoreLogic Home Value Index (Jan ‘14 = 100)          NAB Hedonic dwelling price forecasts (y/y % change to Dec.)                   Building approvals (Jan 2019 = 100)

160                                                                                                                               200
                                                                          2019         2020         2021f           2022f                                                                WA
                               NSW
                                                       Sydney                  5.3         2.7          4.4          6.0          175
140                                   Tas.
                                               Vic.                            5.3         -1.3         3.6          5.4
                                                       Melbourne                                                                  150
120                                           ACT
                                        SA             Brisbane                0.3         3.6          7.4          7.4                Vic.
                                                                                                                                  125                      Qld                            NT
                                               Qld
                                                       Adelaide            -0.2            5.9          7.4          7.4                            SA
100
                                                                           -6.8            1.9          5.0          5.8          100                                                Tas.
                                                       Perth
                                               WA
 80                                                                            3.9         6.1          7.4          7.4                                       NSW
                                                       Hobart                                                                     75
                                                                                                                                                                                     ACT
                                               NT      Cap City Avg            3.0         2.0          5.0          6.1
 60                                                                                                                               50
   2014         2016           2018          2020                                                                                   Jan-20        Jul-20                 Jun-20

Sources: ABS, CoreLogic, NAB
TRAVEL, POPULATION AND AGRICULTURE
Border restrictions continue to weigh on tourism, education and population growth; agri outlook reasonable
 Air travel collapsed at the start of the                Parts of regional Australia stand to benefit                   Applications for student visas have risen,
 pandemic, but domestic travel is starting               from increased domestic tourism, which                         but are yet to fully recover, while the
 to slowly rise again                                    could offset the loss of international visitors                border remains closed

Population growth (to Q2 2020) has slowed                     Agriculture a positive as states benefit from combination of good rural commodity prices,
notably in Vic, NSW and ACT; in contrast                      a solid crop in the West and bumper crop in the East
population growth in WA has picked up                         NAB rural commodities price index m/m % change               Winter crop production, kt
                                                             200                                                            20
                                                                                                                                             2018-19
                                                                               National               NSW
                                                                                                                                             2019-20 (e)
                                                             180               VIC                    QLD
                                                                               WA                     SA                    15               2020-21 (f)
                                                             160               TAS                                                           10 yr average

                                                             140                                                            10

                                                             120
                                                                                                                             5
                                                             100

                                                               80                                                            0
                                                                 2010     2012      2014      2016     2018      2020             NSW      Vic     Qld       SA       WA

Sources: ABS, MacroBond, Bureau of Infrastructure, Transport & Regional Economics, Department of Foreign Affairs and Trade, NAB, Tourism Research Australia, ABARES
Group Economics
         Alan Oster                                  Australian Economics and                      Behavioural & Industry Economics                    International Economics
         Group Chief Economist                       Commodities                                   Robert De Iure                                      Tony Kelly
         +(61 0) 414 444 652                         Gareth Spence                                 Senior Economist – Behavioural & Industry           Senior Economist
                                                     Senior Economist – Australia                  Economics                                           +61 (0) 477 746 237
         Jacqui Brand                                +(61 4) 36 606 175                            +(61 0) 477 723 769
         Personal Assistant                                                                                                                            Gerard Burg
         +(61 0) 477 716 540                         Kaixin Owyong                                 Brien McDonald                                      Senior Economist – International
                                                     Senior Economist, Research                    Senior Economist – Behavioural & Industry           +(61 0) 477 723 768
         Dean Pearson                                +(61 0) 436 679 908                           Economics
         Head of Behavioural & Industry                                                            +(61 0) 455 052 520
         Economics                                   Phin Ziebell
         +(61 0) 457 517 342                         Economist – Agribusiness                      Steven Wu
                                                     +(61 0) 475 940 662                           Economist – Behavioural & Industry Economics
                                                                                                   +(61 0) 472 808 952

         Global Markets Research
         Ivan Colhoun
         Global Head of Research
         +61 2 9293 7168

Important Notice
This document has been prepared by National Australia Bank Limited ABN 12 004 044 937 AFSL 230686 ("NAB"). Any advice contained in this document has been prepared without taking into account
your objectives, financial situation or needs. Before acting on any advice in this document, NAB recommends that you consider whether the advice is appropriate for your circumstances.
NAB recommends that you obtain and consider the relevant Product Disclosure Statement or other disclosure document, before making any decision about a product including whether to acquire or
to continue to hold it. Please click here to view our disclaimer and terms of use.
You can also read