CIO Strategy Bulletin | July 3, 2021 - Citi Private Bank
←
→
Page content transcription
If your browser does not render page correctly, please read the page content below

Citi Global Wealth Investments

CIO Strategy Bulletin | July 3, 2021
Which Real Estate Booms Will Continue?
David Bailin, Chief Investment Officer and Global Head of Investments
Steven Wieting, Chief Investment Strategist & Chief Economist
Malcolm Spittler, Global Investment Strategy
Joseph Fiorica, Head – Global Equity Strategy
Melvin Lou, Global Investment Strategy
Maya Issa, Global Investment Strategy

Market Action Summary
    •   Prospective US homebuyers report a record level of uncertainty over where they might choose to live. A low level
        of home inventories and escalating prices likely drives some of this. Importantly, we see great public uncertainty
        over the flexibility of work arrangements and future commutes.
    •   “Work from home” flexibility has meant a boom in single-family suburban housing and a 60% jump in US
        homebuilder shares since end 2019. Urban rents in the largest cities have fallen and related asset prices have had
        a meager rebound. This dichotomy could be sustained. However, fundamentals and valuations are at risk if
        employers demand a return to a five-day urban work week.
    •   Telecommuting carries risks such as cyber-security threats and broader social concerns. On the positive side for
        economic potential, it opens opportunities for a larger work force to include those with care-giving needs and the
        disabled. Commuting time and energy (including fuel) is, by definition, a frictional input cost to the economy.
    •   Mobility data show greater activity at physical retail and recreation locations than a return to office work. US
        corporate profits have likely gained more than 50% in 1H 2021 despite the empty cubicles.
    •   There are many uncertainties regarding the durability of COVID-impacted real estate trends. While we have been
        overweight Real Estate since June 2020, we increasingly believe overall assets have appreciated (recovered) too
        much for all sectors to offer strong returns from here.
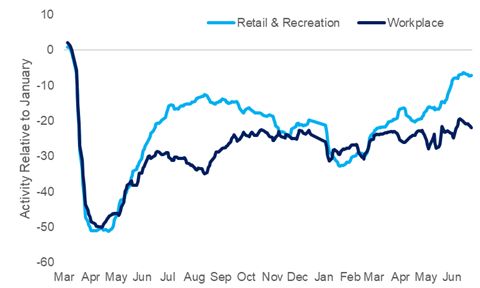
A Zero-Sum Game for Real Estate Assets
Back to work does not necessarily mean back to the office. Diminishing COVID infections have allowed a rapid economic
reopening. As we watch the economy accelerate, we can clearly see that populations in both the US and globally are
returning to recreational activities far faster than they are returning to their offices (Figures 1 and 2). Of course, its early
days and companies are just beginning to implement their “back to office” strategies. Lagged vaccinations of school-aged
children and closed schools remain major impediments. But after 15-18 months of working from home, the idea that
everyone is returning to the office full-time and that business travel will lastingly return to the level it did before is unlikely.
Workers are indeed making a conscious choice to work from home.

Figure 1: US Workplace Visits Well Below Pre- Pandemic                            Figure 2: Global Workplace Visits Well Below Pre- Pandemic
While Other Mobility Measures Have Recovered: Google                              While Other Mobility Measures Have Recovered: Google

Source: Haver Analytics as of June 30, 2021.

The economic benefits of working from home are clear. Data suggest that workers are reinvesting their commuting time
into increasing their output. S&P 500 EPS are expected to rise 54% in the first half 2021. A record high share of firms
reported higher-than-expected profits in the first quarter despite their empty urban office space.

Power to the Workers
As it turns out, people like working from home. Although very few people want to be “remote full-time”, the percentage that
wish to have more flexibility has increased materially (Figure 3). Of even greater significance is the impact that this has
had on employee attitudes relative to that flexibility. If employees are forced to return to the office, a full 30% have indicated
a strong willingness to consider alternative employment (Figure 4). Thus, the more skilled the work force, the more likely
it is that companies will need to become more attuned to worker preferences. This means that flex-work, where employees
will be in the office less frequently, is likely to become more prevalent over time.

Figure 3: Most employees would prefer a more flexible                             Figure 4: Going back to a fully on-site model might have
working model after the pandemic is over                                          significant talent implications

Source: Reimagine Work: Employee Survey (Dec 2020-Jan 2021), n=5,034 full-time employees who work in corporate or government settings.
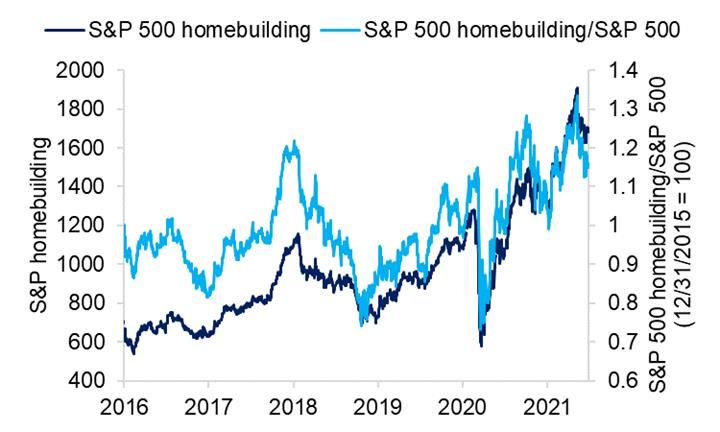
The Skyscraper is Not The Limit
US public homebuilders, who largely focus on constructing single-family dwellings on individually-owned plots of land, have
seen their shares return 60% from the pre-COVID period. Shares are up a stunning 187% from their March 2020 low. This
is roughly double the S&P 500 return since end 2019 (see figure 5).
We believe there has been too much appreciation in overall US real estate equities since early last year for every real
estate equity class to be a winner from here. As discussed in our latest Quadrant: We Can Rebound. Can We Grow?,
given high prices across most real estate equities, there are likely to be winners and losers once the economy stabilizes
in 2022 and beyond.
There remain some notable “tailwinds” still benefiting the homebuilding sector. This includes the broad acceptance of
technology for telecommuters in a population that has five times as many service-sector jobs as “goods producers.”
Housing booms driven by an “investor mindset” tend to sustain momentum once underway. Signs also hint at an alleviation
of homebuilder input costs such as lumber (see figure 6. And we expect interest rates to remain low for quite some time
(please see last week’s CIO bulletin – June 27 and our Outlook for 2021).
However, after such a strong equity performance catalyzed by a “one-time” pandemic, we think that housing equities
depend heavily on the new “status quo” where workers maintain a high degree of flexibility and mobility in their choice of
work locations.

Figure 5: S&P 500 Homebuilders & Relative to S&P 500                                   Figure 6: Lumber Futures Price

Source: Haver Analytics as of June 30, 2021. Indices are unmanaged. An investor cannot invest directly in an index. They are shown for illustrative purposes only and do not
represent the performance of any specific investment. Past performance is no guarantee of future results. Real results may vary.

Buyer Uncertainties Create Potential Homebuilder Headwinds
The Conference Board – a US business think tank – reports that 2.2% of US consumers intend to buy a new or pre-existing
home in the next six months. This is not a particularly high level overall. With inventories dwindling and prices accelerating,
only 0.4% of them say they would buy a newly constructed home (see figure 7). While this would seem to be a big concern
for certain homebuilder shares, the data may be skewed by the uncertainties that employees face. As figure 8 shows, a
record high share of consumers said they were “uncertain” as to what type of property they would buy. We believe that’s
because people are uncertain as to where they will have to work and what their commute will be.
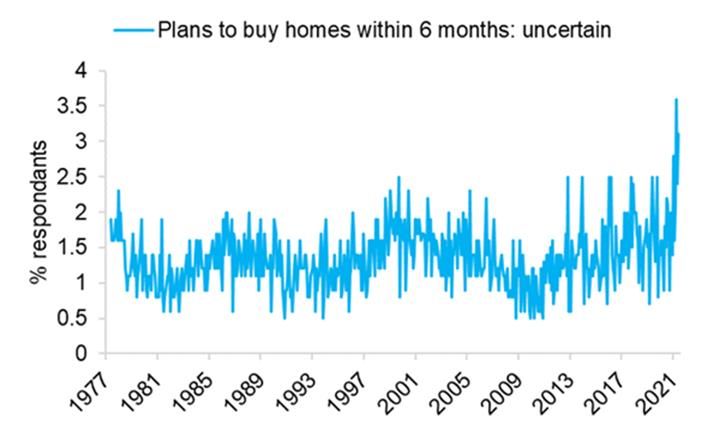
Figure 7: New Homes Buying Plans Have Fallen Sharply                                                       Figure 8: Record Uncertainty on Home Buying Decision
                                                                                                                (New or Pre-Existing?)

     Source: Haver Analytics as of June 30, 2021. Indices are unmanaged. An investor cannot invest directly in an index. They are shown for illustrative purposes only and do
     not represent the performance of any specific investment. Past performance is no guarantee of future results. Real results may vary.

Another headwind is home prices. The COVID impact is palpable with single-family home prices rising at a double-digit
pace while national average rents are still falling (see figure 9). For now, rental costs are still falling in a few large urban
centers like New York City, though we expect rents will broadly improve in smaller urban centers and the suburbs just
outside (see figure 10).

Figure 9: US Home Prices vs Rent Y/Y%                                                                           Figure 10: Urban Rent Index: New York City vs Stamford Ct
                   Recession            US Home Prices (YoY)           Rent Costs (YoY, Right)

                 15%                                                                     5%

                 10%                                                                     4%
Year-over-Year

                                                                                               Year-over-Year

                 5%                                                                      3%

                 0%                                                                      2%

                 -5%                                                                     1%

            -10%                                                                         0%

            -15%                                                                         -1%
                       '90 '92 '94 '96 '98 '00 '02 '04 '06 '08 '10 '12 '14 '16 '18 '20

Source: Haver Analytics as of June 30, 2021. Note: Urban Rent Index from Zillow.com Rent Survey Data. Indices are unmanaged. An investor cannot invest directly in an
index. They are shown for illustrative purposes only and do not represent the performance of any specific investment. Past performance is no guarantee of future results.
Real results may vary.

Implications for Equities
Both homebuilders and apartment REITS have had solid recoveries since last April, but apartment REITS have lagged the
homebuilders by about 65 percentage points. Looking purely at rental assets, apartment REITS have lagged single-family
rental REITS by 25 percentage points since end 2019 (see figure 11).
We believe a sharp “U-turn” to a five-day urban office commute for most workers would harm homebuilder shares and
soften existing suburban housing markets. But that appears unlikely. Allowing for a couple days of flexibility could make
a long commute more bearable, increasing the value of housing assets at even greater distances from urban centers.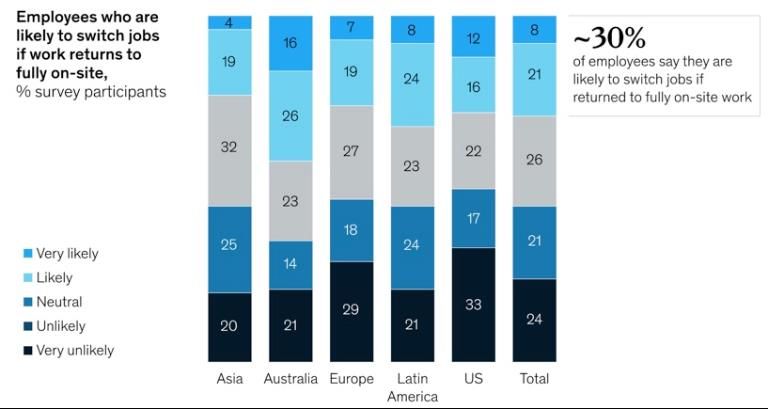
Figure 11: Share Prices of US Homebuilders, Single-Family                           Figure 12: Share Price of Office REITs vs Google Workplace
 Rental REITS and Multi-Family Apartment Rental REITS                                Mobility Index
                                                                                                                        Office REITs
                                                                                                        110                                                            10
                                                                                                                        Google Mobility: Workplaces (Right)
                                                                                                                                                                       0
                                                                                                        100

                                                                                                                                                                             Change vs Baseline
                                                                                                                                                                       -10
                                                                                                         90

                                                                                         Feb 14 = 100
                                                                                                                                                                       -20

                                                                                                         80                                                            -30

                                                                                                                                                                       -40
                                                                                                         70
                                                                                                                                                                       -50
                                                                                                         60
                                                                                                                                                                       -60

                                                                                                         50                                                            -70
                                                                                                          Feb-20   May-20   Aug-20     Nov-20    Feb-21       May-21

 Source: Bloomberg, Factset as of July 2, 2021. Indices are unmanaged. An investor cannot invest directly in an index. They are shown for illustrative purposes only and
 do not represent the performance of any specific investment. Past performance is no guarantee of future results. Real results may vary.

Taking all these factors into consideration, we believe that homebuilder shares have achieved much of their gains with
some upside for those that can accelerate and sustain higher new home construction levels. We believe that office REITS
will see limitations on their recovery depending on the nature of their properties and locations (see figure 12).
Broadly speaking, portfolios of quality suburban office assets near large and medium-sized cities are likely to have better
occupancies and rents than class B and C office space in major urban centers. This reflects the idea that “return to office”
will also mean that office space closer to home will become preferable. In fact, the used of office to office video
conferencing will likely become more prevalent as the number of days “everyone will be in the office” will become rarer.
Perhaps the biggest upside belongs to apartments and home REITS that will see sustained demand from those who cannot
afford higher new and existing homes, or those who want to maintain maximum flexibility on their future location. Such
REITS might also benefit if employers succeed in taking a hard line on returning to the “old normal” in urban centers.
However, as we discussed in our Mid-Year Outlook 2021, we are less inclined to believe that the post-COVID economy
will resemble the pre-COVID economy in every respect. Knowledge learned and efficiencies gained during the pandemic
shutdown should have lasting (if discrete) benefits. Remote work and a higher level of digital commerce are among them.
We’ve overweighted Real Estate assets broadly on their depressed valuation since June 2020. With a strong rebound in
hindsight and a view that the role of real estate is changing with technology, it is increasingly becoming time to be more
selective.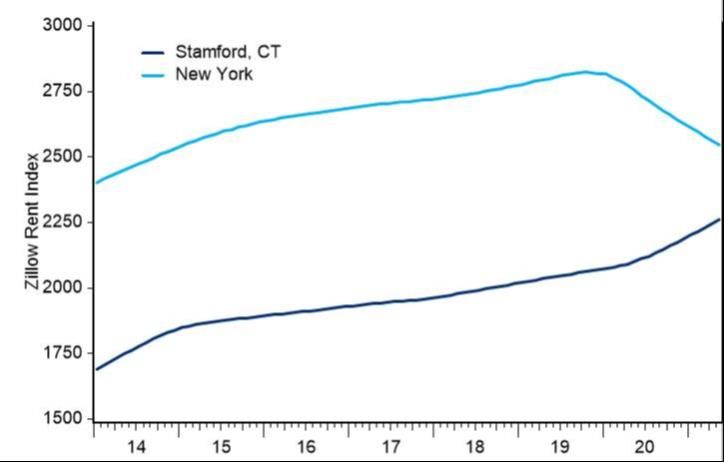
This email contains promotional materials. If you do not wish to receive any further promotional emails from Citi Private Bank,
please email donotspam@citi.com with "UNSUBSCRIBE" in the subject line. Email is not a secure environment; therefore, do not
use email to communicate any information that is confidential such as your account number or social security number.
Announced in January 2021, Citi Global Wealth (“CGW”) is comprised of the wealth management businesses of Citi Private Bank and Citi’s
Global Consumer Bank. Through these businesses, CGW delivers Citi’s wealth solutions, products and services globally. The unified
management and delivery of CGW’s wealth strategy represents a further commitment by Citi to become a leading global wealth business. Citi
Global Wealth Investments (“CGWI”) is comprised of the Investments and Capital Markets capabilities of Citi Private Bank, Citi Personal
Wealth Management and International Personal Bank U.S.
Citi Private Bank and Citi Personal Wealth Management are businesses of Citigroup Inc. (“Citigroup”), which provide clients access to a broad
array of products and services available through bank and non-bank affiliates of Citigroup. Not all products and services are provided by all
affiliates or are available at all locations. In the U.S., investment products and services are provided by Citigroup Global Markets Inc. (“CGMI”),
member FINRA and SIPC, and Citi Private Advisory, LLC (“Citi Advisory”), member FINRA and SIPC. CGMI accounts are carried by Pershing
LLC, member FINRA, NYSE, SIPC. Citi Advisory acts as distributor of certain alternative investment products to clients of Citi Private Bank.
Insurance is offered by Citi Personal Wealth Management through Citigroup Life Agency LLC (“CLA”). In California, CLA does business as
Citigroup Life Insurance Agency, LLC (license number 0G56746). CGMI, Citi Advisory, CLA and Citibank, N.A. are affiliated companies under
the common control of Citigroup.
Outside the U.S., investment products and services are provided by other Citigroup affiliates. Investment Management services (including
portfolio management) are available through CGMI, Citi Advisory, Citibank, N.A. and other affiliated advisory businesses. These Citigroup
affiliates, including Citi Advisory, will be compensated for the respective investment management, advisory, administrative, distribution and
placement services they may provide.
International Personal Bank U.S. (“IPB U.S.”), is a business of Citigroup Inc. (“Citigroup”) which provides its clients access to a broad array of
products and services available through Citigroup, its bank and non-bank affiliates worldwide (collectively, “Citi”). Through IPB U.S. prospects
and clients have access to the Citigold® Private Client International, Citigold® International, International Personal, Citi Global Executive
Preferred, and Citi Global Executive Account Packages. Investment products and services are made available through either Citi Personal
Investments International (“CPII”), a business of Citigroup Inc., which offers securities through Citigroup Global Markets Inc. (“CGMI”),
member FINRA and SIPC, an investment advisor and broker–dealer registered with the Securities and Exchange Commission; or Citi
International Financial Services, LLC (“CIFS”), member FINRA and SIPC, and a broker–dealer registered with the Securities and Exchange
Commission that offers investment products and services to non–U.S. citizens, residents, or non–U.S. entities. CGMI and CIFS investment
accounts are carried by Pershing LLC, member FINRA, NYSE, and SIPC. Insurance is offered by CPII through Citigroup Life Agency LLC
(“CLA”). In California, CLA does business as Citigroup Life Insurance Agency, LLC (license number 0G56746). Citibank N.A., CGMI, CIFS,
and CLA are affiliated companies under common control of Citigroup Inc.
Read additional Important Information
Past performance is not indicative of future results. Real results may vary.
**Citi and its employees are not in the business of providing, and do not provide, tax or legal advice to any taxpayer outside Citi.
Any statement in this Communication regarding tax matters is not intended or written to be used, and cannot be used or relied
upon, by any taxpayer for the purpose of avoiding tax penalties. Any such taxpayer should seek advice based on the taxpayer’s
particular circumstances from an independent tax advisor.
MBS are also sensitive to interest rate changes which can negatively impact the market value of the security. During times of heightened
volatility, MBS can experience greater levels of illiquidity and larger price movements.
Important information, including information relating to risk considerations can be found in the link above.
Views, opinions and estimates expressed herein may differ from the opinions expressed by other Citi businesses or affiliates, and are not
intended to be a forecast of future events, a guarantee of future results, or investment advice, and are subject to change without notice based
on market and other conditions. Citi is under no duty to update this presentation and accepts no liability for any loss (whether direct, indirect or
consequential) that may arise from any use of the information contained in or derived from this presentation.
© 2021 Citigroup Inc., All Rights Reserved. Citi, Citi and Arc Design and other marks used herein are service marks of Citigroup Inc. or its
affiliates, used and registered throughout the world.
       INVESTMENT PRODUCTS: NOT FDIC INSURED · NOT CDIC INSURED · NOT GOVERNMENT INSURED
                                            · NO BANK GUARANTEE · MAY LOSE VALUE
www.citiprivatebank.com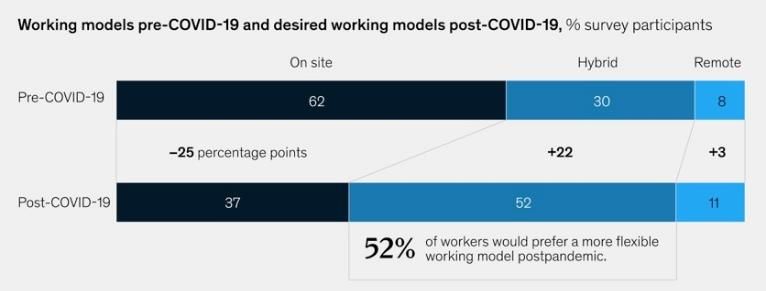
You can also read