UAV AND SATELLITE IMAGERY APPLIED TO ALIEN SPECIES MAPPING IN NW
←
→
Page content transcription
If your browser does not render page correctly, please read the page content below
The International Archives of the Photogrammetry, Remote Sensing and Spatial Information Sciences, Volume XLII-2/W13, 2019
ISPRS Geospatial Week 2019, 10–14 June 2019, Enschede, The Netherlands
UAV AND SATELLITE IMAGERY APPLIED TO ALIEN SPECIES MAPPING IN NW
SPAIN
Joaquín Martínez-Sánchez1,2, *, Luis M. González-de Santos1,2, Ana Novo,1 and Higinio González-Jorge2,3
1Geotech
Group, Mining and Energy Engineering School, University of Vigo, Vigo, Spain -
(joaquin.martinez,luismgonzalez,annovo)@uvigo.es
2UAS Research Area, Fundación Centro de Innovación Aeroespacial de Galicia, Edificio, Nigrán, Spain.- (joaquin.martinez,
luis.gonzalez)@cinae.org
3Geotech Group, Aerospace Engineering School, University of Vigo, Ourense, Spain-higiniog@uvigo.es
Commission I, ICWG I/II
KEY WORDS: Alien species Mapping, UAS imagery, Satellite remote sensing, Image classification, Photogrametry
ABSTRACT:
Image classification stands as an essential tool for automated mapping, that is demanded by agencies and stakeholders dealing with
geospatial information. Decreasing costs or UAV-based surveying and open access to high resolution satellite images such as that
provided by European Union’s Copernicus programme are the basis for multi-temporal landscape analysis and monitoring. Besides
that, invasive alien species are considered a risk for biodiversity and their inventory is needed for further control and eradication. In
this work, a methodology for semi-automatic detection of invasive alien species through UAV surveying and Sentinel 2 satellite
monitoring is presented and particularized for Acacia dealbata Link species in the province of Pontevedra, in NW Spain. We selected
a scenario with notable invasion of Acaciae and performed a UAS surveying to outline feasible training areas. Such areas were used
as bounds for obtaining a spectral response of the cover from Sentinel 2 images with a level of processing 2A, that was used for
invasive area detection. Sparse detected areas were treated as a seed for a region growing step to obtain the final map of alien species.
1. INTRODUCTION Finally, it is necessary to emphasize that the actual trend in the
field has to do with the automation of the detection and mapping.
Current advances in sensors on-board satellite and UAV To this end, Machine Learning approaches focused on
platforms are the basis for Earth observation and monitoring with mutispectral satellite images with several resolutions and bands
an increasing accuracy and resolution. Remote sensing of the electromagnetic spectrum can be an input for identification
techniques and open spatial data are essential for gathering and subsequent mapping (Skakun, 2017).
information as an input and support for decision-makers. The aim of this work is to develop and test a methodology for
Richardson and Rejmánek assembled a global list of invasive mapping Acacia Dealbata Link in the province of Pontevedra,
alien trees and shrubs that describes the distribution of taxa and Galicia, a NW Spanish region. The developed methodology is
the spatial representation of 622 species that include, as based on UAV-based surveying and the classification of Sentinel
exceptional, 23 species of the genus Acacia and, among them, the 2 L2A imagery.
Acacia Dealbata Link species (Richardson and Rejmánek, 2011). 2. MATERIALS AND METHODS
There is a focus on this species, because is one of the most
widespread alien plant in Europe. In Spain, and specifically in the 2.1 Study area
forested NW regio, it yields an annual spread rate around 0.1%
(Hernández et al., 2014). Existing works comprise the study of The species was first introduced in Spain in the first decades of
biological attributes that are favouring invasion by A. dealbata XIX century with ornamental purposes due to its rapid growth
(Lorenzo et al., 2010) and the production of maps that show how and characteristic flowering. The great colonizing capacity of
this invasive species is spreading (Martins et al., 2016). Acacia Dealbata Link has turn its expansion into an
The detection of this invasive species through automated environmental issue due to the loss of native species and
procedures and satellite image processing is a subject with a large biodiversity (Lorenzo et al., 2012).
presence in the literature, with a focus on public platforms such In recent decades, wildfires related deforestation and agriculture
as Sentinel images (Martimort et al., 2012), ASTER or Landsat abandonment have contributed to the expansion of the species in
(Viana and Aranha, 2010). The possibilities of combining two main areas: the west and the south of the provinces of
different bands of the electromagnetic spectrum to highlight Ourense and Pontevedra respectively (Hernández et al., 2014).
those elements of the Earth's surface that we are interested in, is The density is greater in the western end of the province of
an advantage that has been used in innumerable projects (Peña Ourense, however, the entire community is dotted with
and Ulloa, 2017). increasingly extensive redoubts of this species. From Portugal,
In addition, we can also find works where drones are used for the presence of large areas of Acacia spp. is remarkable and
pixel evaluation and image classification. The advantage of these growing, especially in the Baixo Minho region and in the vicinity
platforms in terms of spatial resolution results in a more detailed of the Peneda-Gerês national park.
cartography, (Mafanya et al., 2017), with a smooth contrast A first area was used for initial UAV surveying to obtain training
between similar pixels and where the detection is more accurate data for the classifiers that were afterwards applied to the broader
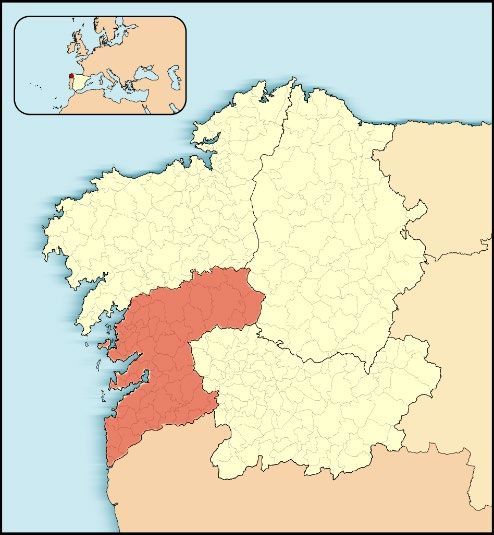
than with satellite images. area of work. Figure 1 shows a map of the study area used for
* Corresponding author
This contribution has been peer-reviewed.
https://doi.org/10.5194/isprs-archives-XLII-2-W13-455-2019 | © Authors 2019. CC BY 4.0 License. 455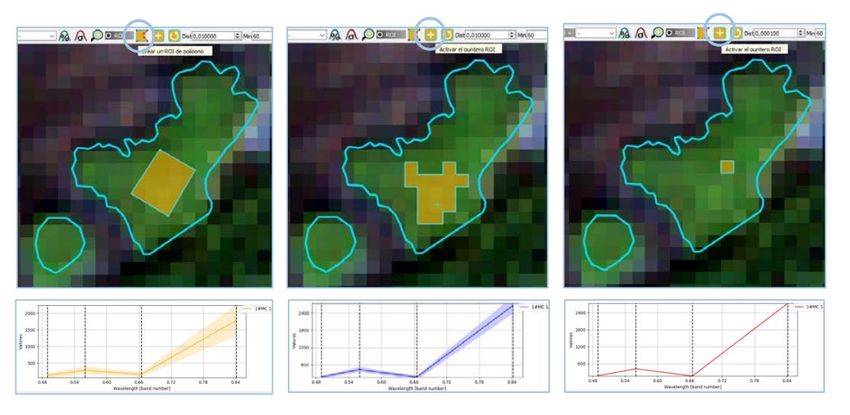
The International Archives of the Photogrammetry, Remote Sensing and Spatial Information Sciences, Volume XLII-2/W13, 2019
ISPRS Geospatial Week 2019, 10–14 June 2019, Enschede, The Netherlands
mapping that comprises the province of Pontevedra, in the Beyond the high productivity and flexibility posed for UAVs for
Northwest of Spain. the capture of information from a specific area, satellite images
This province comprises an area of 4495 km², that is suitable to provide us with images with a global coverage and a suitable
be mapped by means of satellite imagery. revisit time for monitoring forest areas throughout its
phenological stages.
In this work we will make use of satellite imagery from the UE
Copernicus program. Copernicus aims to collect on a planetary
scale environmental data that is intended to be used to mitigate
the effects of climate change. This is to improve the quality of
life of ecosystems and humanitarian needs in order to more
efficiently manage resources in the future and ensure
sustainability.
MSI Satellite imagery from the Sentinel 2 mission was used and
downloaded from the Copernicus Open Hub. In order to perform
a multitemporal classification, L2A Processing Level was
selected and multiple season images were downloaded to obtain
the classifier (Drusch et al, 2012).
2.3 Methodology
2.3.1 Data acquisition and processing
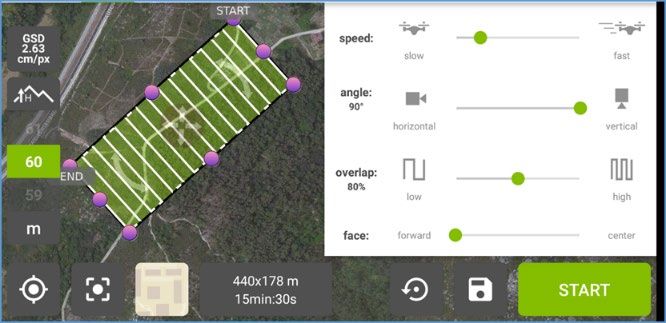
In order to obtain a precise footprint of the training areas, a UAV
Figure 1 Area of study based surveying was performed with the settings detailed in
Table 2.
2.2 Materials
Parameter Value
UAV surveying was performed by a DJI’s Phantom 3 Pro. This Flight Height 60 m (AGL)
is a commercial quadcopter that fits the requirements of the Flight speed 3 m/s
project and results very suitable due to the easiness of its work Image overlap 80%
and the automation of the flight. GSD 2-3 cm
This quadcopter is equipped with a RGB camera mounted on a
Camera orientation Nadir
gimbal that permits to setup the capture angle and filters the
Table 2 UAV surveying parameters
effects of the flight instability on the images. The main attributes
of this camera are detailed in Table 1.
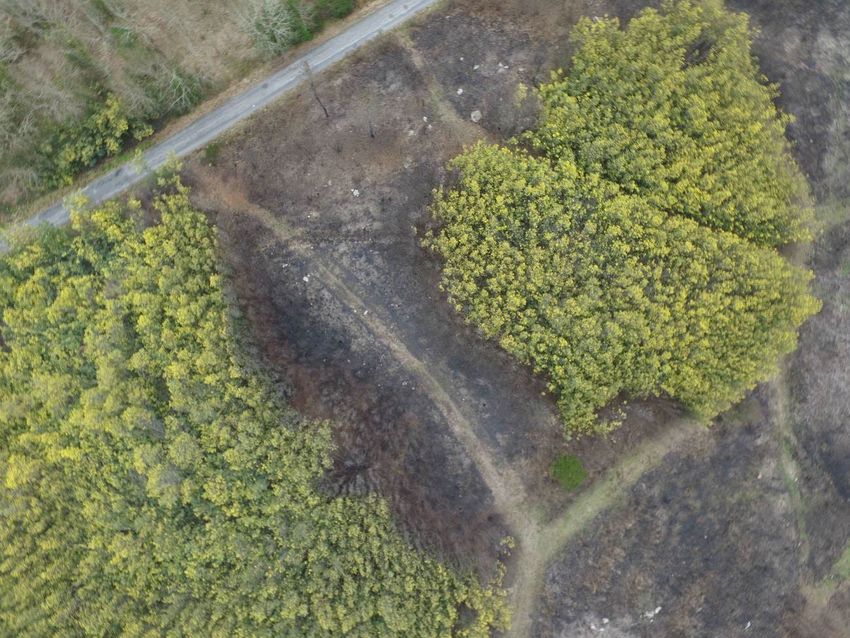
Figure 3 shows a collected image of the training survey that may
serve as an example of the achieved resolution in the UAV survey
Attribute Value
Sensor 1/2.3” CMOS
Resolution 12.4 M
Lens FOV 94° 20 mm
Shutter speed 8s -1/8000s
Table 1 Phantom 3 Pro camera properties
The flight plan application that was used to setup the
requirements in terms of mapping and modelling is the well-
known Pix4DCapture (Pix4D, 2019). This is a free and flexible
application that can be used for online and offline mission
definition. Based on the definition of the GSD of the survey and
the requirements, the application defines the type of survey
necessary and establishes the flight altitude and settings most
suitable for obtaining the results. In a successive manner, users
can set camera angle, image overlap and flight speed. Figure 2
shows the frontend of the used Pix4DCapture application.
Figure 3 Aerial image collected by the DJI 's Phantom 3 Pro
This aerial images were the input to a photogrammetric bundle
adjustment that was processed to obtain both a DEM with the
elevation of the training area.
Such DEM is the basis for a orthorectification step that provides
an orthomosaic of the area. In our case, a pixel size of 5 cm was
selected, but, given the spatial resolution of the satellite imagery,
this setting is more focused on documentation purposes than
training requirements. Figure 4 shows the resulting orthomosaic
of one of the training areas in the work.
Figure 2 Pix4D App for flight planning The resulting orthomosaic is suitable for delineation of the
training area which is depicted in Figure 5.
This contribution has been peer-reviewed.
https://doi.org/10.5194/isprs-archives-XLII-2-W13-455-2019 | © Authors 2019. CC BY 4.0 License. 456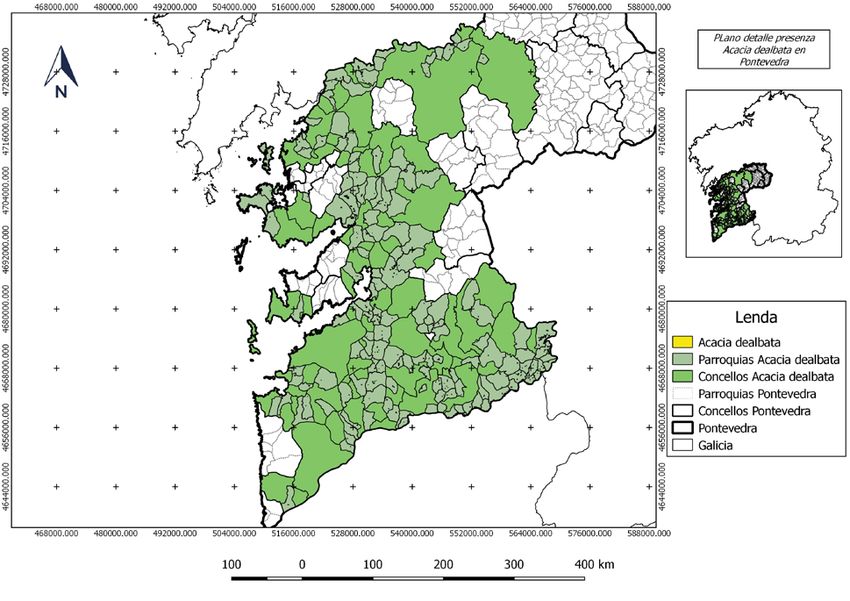
The International Archives of the Photogrammetry, Remote Sensing and Spatial Information Sciences, Volume XLII-2/W13, 2019
ISPRS Geospatial Week 2019, 10–14 June 2019, Enschede, The Netherlands
Figure 6 Visualization of the orthomosaic obtained through
Sentinel L2A images processing
Figure 4 Resulting orthomosaic of the photogrammetric survey
2.3.2 Data analysis and classification
based on UAV
In the second step of the methodology, previous footprints are
In order to obtain the satellite imagery, a script has been
used as Regions of Interes (ROI) for the classification of the alien
developed for the automatic download of Sentinel2 images from
species. This classification was carried out using the
the province of Pontevedra. The script is prepared to run in an Semiautomatic Classification Plugin in QGis software (Congedo,
unattended process and, perform the query, download the images, 2016).
if new images are available, and generate the mosaic of the
province of Pontevedra.
Figure 7 ROIs used for training in the classification. The ROIs
are overlaid on a composition of Sentinel 2 L2A bands 3-2-1.
Figure 5 Training area delineation. This footprint is to be used The classification was performed making use of the spectral
as an overlay of the satellite images. information of the satellite images. Some examples of the
spectral detectors based on the pixel information in L2A images
The access to the Sentinel Hub repository is made through the is depicted in Figure 8. The more pixels considered to obtain this
REST service of the hub, that provides an API to access the estimation, the more information about the spectral detector to be
database through a query. This query has a series of parameters used.
that allow obtaining the most appropriate images for the specific
application. In our case we will access the images of processing
level L2A (estimation of the reflectance in the lower part of the
atmosphere).
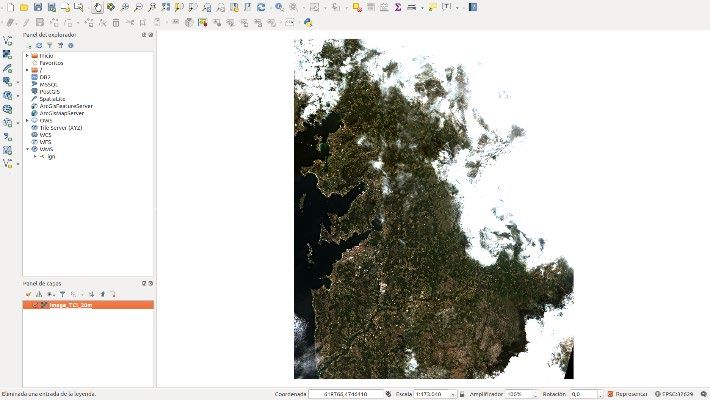
As a second stage, an orthomosaic of the province is computed.
Depending on the satellite orbit, the province of Pontevedra will
appear in a number of images between 2 and 4. From these
images a mosaic of all of them is generated to have a single image
showing the area of the province in all its extension. Figure 4
shows an example of one of the generated orthomosaics of the
province. Figure 8 Spectral detector obtained using SCP with different
selection parameters. Depending on the number of pixels in the
considered region, we obtain an estimator of the spectral
signature of the species.
This contribution has been peer-reviewed.
https://doi.org/10.5194/isprs-archives-XLII-2-W13-455-2019 | © Authors 2019. CC BY 4.0 License. 457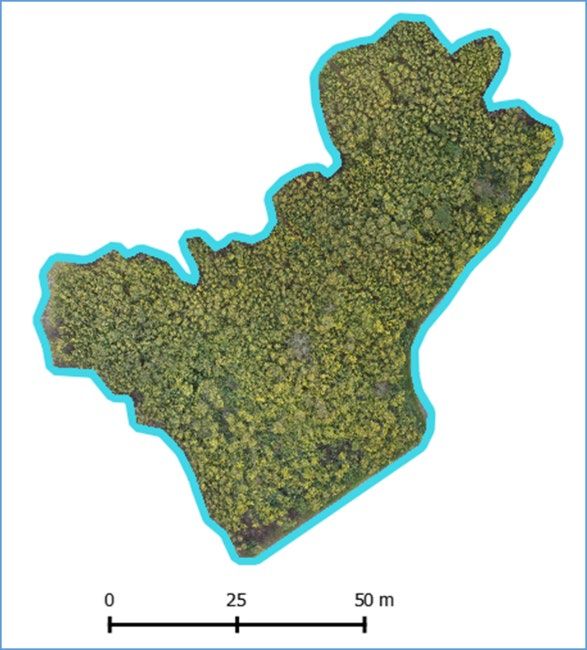
The International Archives of the Photogrammetry, Remote Sensing and Spatial Information Sciences, Volume XLII-2/W13, 2019
ISPRS Geospatial Week 2019, 10–14 June 2019, Enschede, The Netherlands
The training areas obtained with the photogrammetric survey 3. RESULTS
were used as bounds for obtaining a spectral response of the
cover from Sentinel 2 images with a level of processing 2A. This Figure 11 shows the results of the detection of acacia zones based
spectral response serves as an estimator of the spectral signature on the spectral distance between the pixels of the image and the
of the species, and it was used for invasive area detection. estimator obtained from the training areas.
Taking into account the distance between a pixel and the spectral
estimator, a pixel is classified as alien species.
Figure 9 Result of the detection based on the distance between a
pixel and the spectral detector obtained with SCP plugin. Figure 11 Results of detection based on the spectral distance of
the estimator
2.3.3 Cartography and mapping
As aforementioned in the previous section, the defined estimator
The spectral classifier defined from the pixels of the training can not be considered as a classifier, since there are a large
zones does not generalize the results correctly. As a result, there number of pixels belonging to the invasive species that have not
are a large number of pixels belonging to areas of acacias sp. that been classified correctly. However, a large percentage of the
are not classified correctly. classified pixels corresponds to correct pixels and, therefore, the
However, a large number of pixels classified as acacia are correct estimator has been considered as a detector of blobs containing
and the number of false positives in the classification is very low. the species considered.
Therefore, we can consider the classifier as an Acacia sp. Given the large extension of area under study in this study, two
detector, in which at least one pixel of the blobs of this species is sampling areas have been defined to assess this detection. The
detected correctly. precision of the detection and the number of false positives have
been verified from the positive pixels obtained by the classifier
in those sampling areas, that are depicted in Figure 11.
From this selection of pixels, it has been found that the detection
accuracy has been 86% and, consequently, the percentage of false
positives is 14%.
Finally, from the detected areas, the estimated invasion map has
been compiled, which is presented in figure 12. In this map, the
administrative divisions in which the condition is observed are
highlighted.
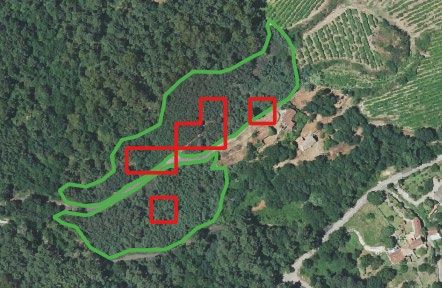
Figure 10 Detected pixels in a area of Acacia overlaid on a Figure 12 Acacia sp. map obtained. The Municipalities with
Sentinel 2 image (up) and an official orthophoto (bottom) positive detections of alien species are highlighted in green.
Finally, to obtain the map of acacias in the study area, sparse
detected areas were treated as a seed for a region growing step to
obtain the final map of alien species.
This contribution has been peer-reviewed.
https://doi.org/10.5194/isprs-archives-XLII-2-W13-455-2019 | © Authors 2019. CC BY 4.0 License. 458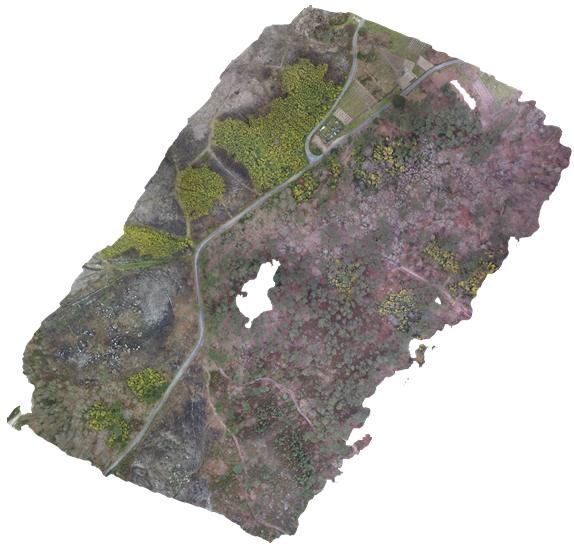
The International Archives of the Photogrammetry, Remote Sensing and Spatial Information Sciences, Volume XLII-2/W13, 2019
                            ISPRS Geospatial Week 2019, 10–14 June 2019, Enschede, The Netherlands

                     4. CONCLUSIONS                                   Martins, F., Alegria, C., Artur, G., 2016. Mapping invasive alien
                                                                      Acacia dealbata link using ASTER multispectral imagery: a case
The combination of satellite platforms and UAVs allows us to          study in central-eastern of Portugal. Forest systems, 25, 13.
take advantage of the synergy between the global coverage of the
former and the spatial resolution of the latter.                      Martimort, P., Fernandez, V., Kirschner, V., Isola, C., Meygret,
The high productivity obtained from these Systems of Systems,         A. 2012. Sentinel-2 MultiSpectral imager (MSI) and
implies that they can be considered as an alternative to other        calibration/validation. Geoscience and Remote Sensing
methods of land observation of greater costs.                         Symposium (IGARSS), 2012 IEEE International, (págs. 6999-
In this work, a detector has been developed that is focused on the    7002).
classification of invasive forest species with the idea of
generating a map of their evolution.                                  Peña, M. A., Ulloa, J. ,2017. Mapeo de la recuperación de la
The revisit time of the satellites allows us to have a large number   vegetación quemada mediante la clasificación de ı́ndices
of samples of images in different phenological stages of the          espectrales pre-y post-incendio. Revista de Teledetección, (págs.
species, and therefore, adapt the classifier to the time of year in   37-48).
which it is being measured.
On the other hand, the absence of sufficiently large areas of         Pix4D SA, 2019. https://www.pix4d.com/product/pix4dcapture,
uniform extensions of the species, makes the resolution of the        Accessed on 12 Feb., 2019
satellite images a handicap to achieve a correct classification of
all the pixels corresponding to the invasive species.                 Richardson, D. M., Rejmánek, M. ,2011. Trees and shrubs as
However, the classifier has given good results as a detector of the   invasive alien species–a global review. Diversity and
areas in which we can find the invasive species, and we have used     distributions, 17(5), 788-809.
this feature to perform a growth of the detected regions to
generate a map of affected areas.                                     Skakun, S. a.-C., 2017. Automatic sub-pixel co-registration of
This mapping process still requires a lot of manual work and          Landsat-8 Operational Land Imager and Sentinel-2A Multi-
therefore, future lines of work should be aimed at achieving an       Spectral Instrument images using phase correlation and machine
automation of the classifiers.                                        learning based mapping. International Journal of Digital Earth.

                  ACKNOWLEDGEMENTS                                    Viana, H., Aranha, J., 2010. Mapping invasive species (Acacia
                                                                      dealbata Link) using ASTER/TERRA and LANDSAT 7 ETM+
Authors would like to acknowledge Deputación de Pontevedra            imagery. Forest Landscapes and Global Change-New Frontiers
for the grant 17/410.1720.789.02 and Jose Antonio Ruiz for his        in Management, Conservation and Restoration. Proceedings of
invaluable collaboration in this work.                                the IUFRO Landscape Ecology Working Group International
                                                                      Conference.
                        REFERENCES

Congedo, L., 2016. Semi-Automatic Classification Plugin
Documentation. doi.org/10.13140/RG.2.2.29474.02242/1

Drusch, M., Del Bello, U., Carlier, S., Colin, O., Fernandez, V.,
Gascon, F., ... & Meygret, A., 2012. Sentinel-2: ESA's optical
high-resolution mission for GMES operational services. Remote
sensing of Environment, 120, 25-36.

Hernández, L., Martínez-Fernández, J., Cañellas, I., Cueva, A.
V., 2014. Assessing spatio-temporal rates, patterns and
determinants of biological invasions in forest ecosystems. The
case of Acacia species in NW Spain. Forest Ecology and
Management, 329, 206-213.

Lorenzo, P., González, L., Reigosa, M. J. ,2010. The genus
Acacia as invader: the characteristic case of Acacia dealbata Link
in Europe. Annals of Forest Science, 67(1), 101.

Lorenzo, P., Pazos-Malvido, E., Rubido-Bará, M., Reigosa, M.
J., González, L., 2012. Invasion by the leguminous tree Acacia
dealbata link (Mimosaceae) reduces the native understorey plant
species in different communities. Australian Journal of Botany,
60, 669-675.

Mafanya, M., Tsele, P., Botai, J., Manyama, P., Swart, B.,
Monate, T., 2017. Evaluating pixel and object based image
classification techniques for mapping plant invasions from UAV
derived aerial imagery: Harrisia pomanensis as a case study.
ISPRS Journal of Photogrammetry and Remote Sensing, 129, 1-
11.

                                                This contribution has been peer-reviewed.
                   https://doi.org/10.5194/isprs-archives-XLII-2-W13-455-2019 | © Authors 2019. CC BY 4.0 License.                 459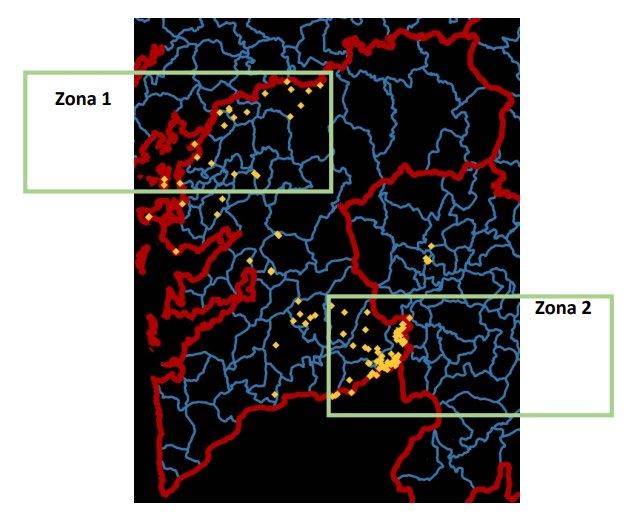
You can also read