2030 Hydrogen Demand in the Norwegian Domestic Maritime Sector
←
→
Page content transcription
If your browser does not render page correctly, please read the page content below

2030 Hydrogen Demand in the
Norwegian Domestic Maritime
Sector
Report number: C
Project: OHC HyInfra
Report prepared by: Ocean Hyway Cluster
Distribution: Open
SUMMARY
This report summarizes the work that has been carried out as part of work package C in the project
OHC HyInfra. The overall aim of the work has been to map and estimate the potential future hydrogen
demand in the Norwegian domestic maritime sector, and thereby contribute to an overview of future
possible bunkering locations and hydrogen infrastructure in Norway. The data presented in this report
and the sub-reports C1, C2, C3 and C4 will be used as a basis for the work package B in the HyInfra
project.

Focus has been on hydrogen and ammonia demand in the following sectors: offshore, domestic ferries
and high-speed passenger ferries, as well as the Kystruten and other publicly known projects. Estimates
are based on scenarios with varying uptake of hydrogen-based fuels depending on sector specific
assumptions and data. The basis for the assumptions on fuels for different ship types are described in
the report from work package A (maritime end users).

2030 has been used as a basis for scenarios, however in some sectors information about contract
durations exceeding 2030 are available. Therefore, scenarios have been extended to include possible
hydrogen projects until 2035 for the sectors Kystruten, car ferries and high-speed crafts. For the offshore
sector estimates are based on 2030.

The figure “potential demand 2021-2035” on next page depicts the total estimated hydrogen and
ammonia demand from 2021 to 2035, as well as the demand in each sector. A total hydrogen demand
of 39.000 tonnes (4,7 million gigajoules) has been found in 2035. The ammonia demand in the
offshore sector been found to be in the range 0,5 to 1,3 million tonnes or 9,7 – 24,8 million
gigajoules annually in 2030.

Based on assessments as presented in work package A and findings from the current work, a
significant demand for ammonia (NH3), liquid hydrogen (LH2) and compressed hydrogen (CH2)
is expected in the domestic maritime sector in 2035. Hydrogen demand is expected to increase
gradually from 2022-24 until 2032. In 2032 a substantial increase in hydrogen demand is expected due
to many contracts being renewed in the sectors subject to public tenders.

The potential carbon dioxide emission reductions for the relevant sectors are illustrated in the figure
“CO2 reduction potential” on next page. The given data is based on the high scenarios for the sectors
car ferries, high speed ferries and the Kystruten, whereas low scenario estimates from the offshore
sector has been used. Switching to zero emission, hydrogen-based fuels, can potentially reduce
annual CO2 emissions by more than 1,17 million tonnes by 2035. This roughly corresponds to
the annual carbon dioxide emissions from 780 000 Norwegian cars.

As part of the HyInfra project a digital map on OHC webpage has been developed. The map shows
vessels and routes that are included in the work package C and indicates bunkering locations for the
different vessel categories. The map will be continuously updated when new projects are added or when
new estimates becomes available. The map can be accessed in the members area on OHC webpage
by clicking on the following link: https://www.oceanhywaycluster.no/membersarea

                                                                                                         1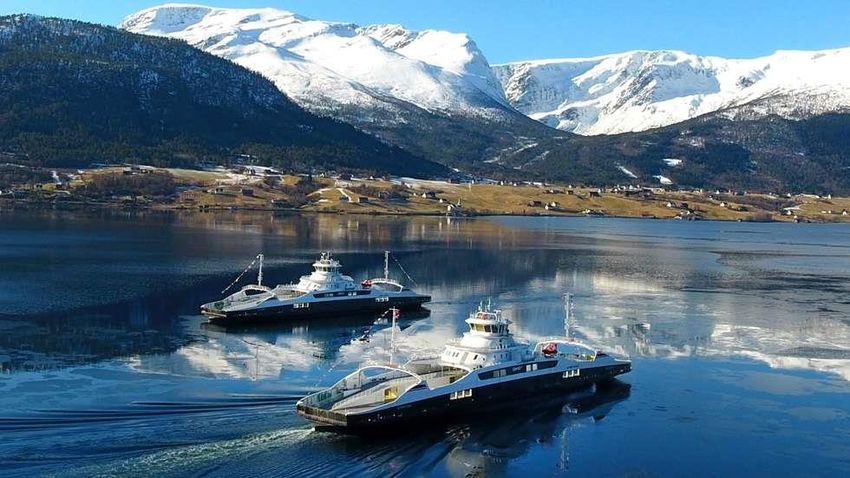
POTENTIAL DEMAND 2021 – 2035

                                                    40000                                                                             1 400 000
 Estimated annual hydrogen demand (tonnes / year)

                                                    35000                                                                             1 200 000

                                                                                                                                                   Estimated ammonia demand (tonnes/year)
                                                    30000
                                                                                                                                      1 000 000

                                                    25000
                                                                                                                                      800 000
                                                    20000
                                                                                                                                      600 000
                                                    15000

                                                                                                                                      400 000
                                                    10000

                                                     5000                                                                             200 000

                                                        0                                                                             -

                                                            High speed crafts CH2         Domestic car ferries CH2      Domestic car ferries LH2
                                                            Coastal route LH2             Offshore NH3 (high)           Offshore NH3 (low)

CO2 REDUCTION POTENTIAL (TONNES/YEAR)

                                                                                                      158 364

                                                                                                            112 800

                                                                                    728 661                 173 000

                                                                                              High speed crafts
                                                                                              Car ferries
                                                                                              Coastal route
                                                                                              Offshore sector (low scenario)

                                                                                                                                                                                     2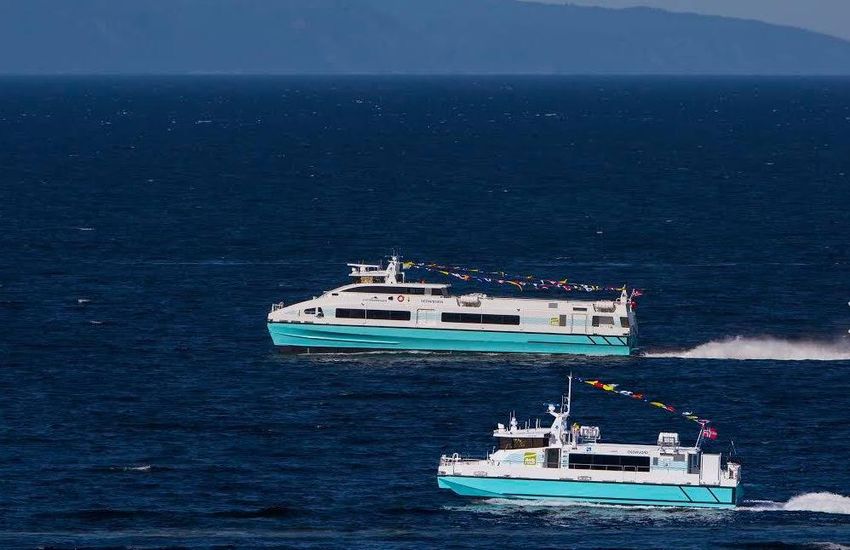
CONTENT
Summary ................................................................................................................................................. 1
1        Introduction ....................................................................................................................................... 4
     1.1         Objective and scope ................................................................................................................ 5
     1.2         Project HyInfra ......................................................................................................................... 5
     1.3         General assumptions and limitations....................................................................................... 6
     1.4         Scenarios ................................................................................................................................. 6
2        Mapping of future hydrogen demand ............................................................................................... 7
     2.1         High-speed passenger ferries (C.1) ........................................................................................ 7
     2.2         Domestic car ferries (C.2) ........................................................................................................ 8
     2.3         The Kystruten Bergen- Kirkenes (C.3) .................................................................................... 9
     2.4         Offshore sector (C.4) ............................................................................................................. 10
     2.5         Other known projects (C.5) .................................................................................................... 11
3        Potential demand 2021-2035 ......................................................................................................... 12
     3.1         Online Map tool on OHC webpage ........................................................................................ 12
     3.2         Compressed hydrogen (CH2) ................................................................................................ 12
     3.3         Liquid hydrogen (LH2) ........................................................................................................... 13
     3.4         Ammonia (NH3) ...................................................................................................................... 15
     3.5         Carbon dioxide emission reductions...................................................................................... 16
4        Further work ................................................................................................................................... 16
5        Acknowledgements ........................................................................................................................ 17
6        Appendix ........................................................................................................................................ 18
     6.1         Common data used for calculations ...................................................................................... 18

DOCUMENT HISTORY
The document will be updated when new or updated information becomes available, or when additional
ship categories / sectors are added.

    Revision                 Date                    Description                                                                   Sign
    01                       28.04.2020              Report covering domestic car ferries, high speed                              SFK
                                                     crafts, offshore and other known projects

                                                                                                                                                             3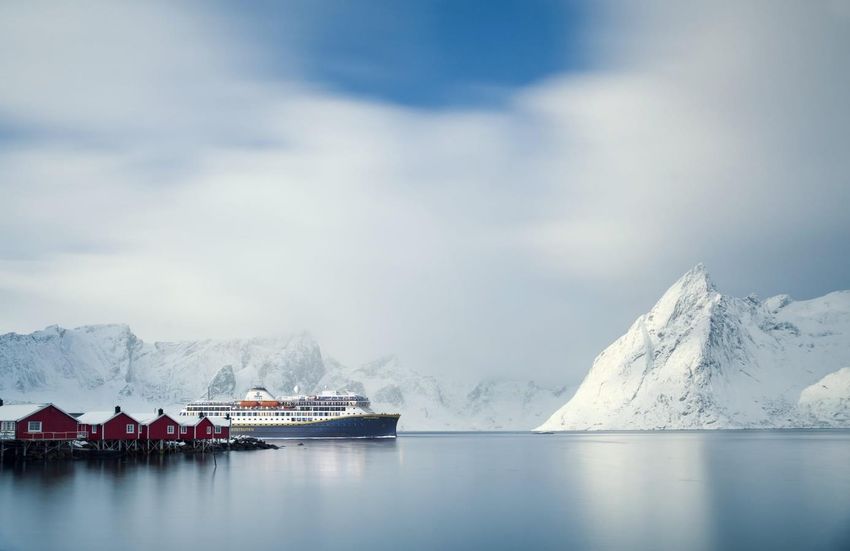
1 INTRODUCTION
In the action plan for green shipping from 2019 by the Norwegian government it is clearly stated that
Norway is to become a low emission society. In order to achieve this, large emission reductions and
technology developments are required in all sectors. For the maritime sector alone DNV GL estimated
that the total CO2-emissions from domestic shipping in Norway was 4,8 million tonnes in 2017.

There is currently a widespread focus on climate gas reductions in many sectors and organizations. The
International Maritime Organization (IMO) has set an ambitious goal of at least 50% reduction in
greenhouse gas emissions (compared to 2008) by 2050 in the maritime sector alone. The same
organization aims for a 40% reduction of carbon dioxide emissions per transport work by 2030.

In order to achieve the emission reduction targets as set forth by both Norwegian government, the IMO
and other organizations, there is a need for zero-carbon fuels.

Ocean Hyway Cluster (OHC) is the Norwegian national cluster for maritime use of hydrogen. The cluster
focuses on the entire hydrogen value chain, including production, storage and distribution and end
users. OHC will contribute to making hydrogen available to the Norwegian maritime market. The main
purpose of the work in clustering is to develop safe, reliable technical solutions for hydrogen-based
energy systems to propel vessels. The goal is for Norwegian companies to take a leading position
globally and that the development work that is taking place in the cluster will lead to increased exports
from the maritime sector and associated supplier industry.

At OHC, we believe that hydrogen as a maritime fuel will play a key role in the future marine energy mix.
We believe that in order to achieve the necessary emission targets, widespread use of liquid hydrogen,
compressed hydrogen and ammonia (NH3) will be needed in the maritime industry.

Figure 1: Træna ferry connection in Nordland. Photo by: Kari-Ann Dragland Stangen/Helgelands Blad.

                                                                                                       4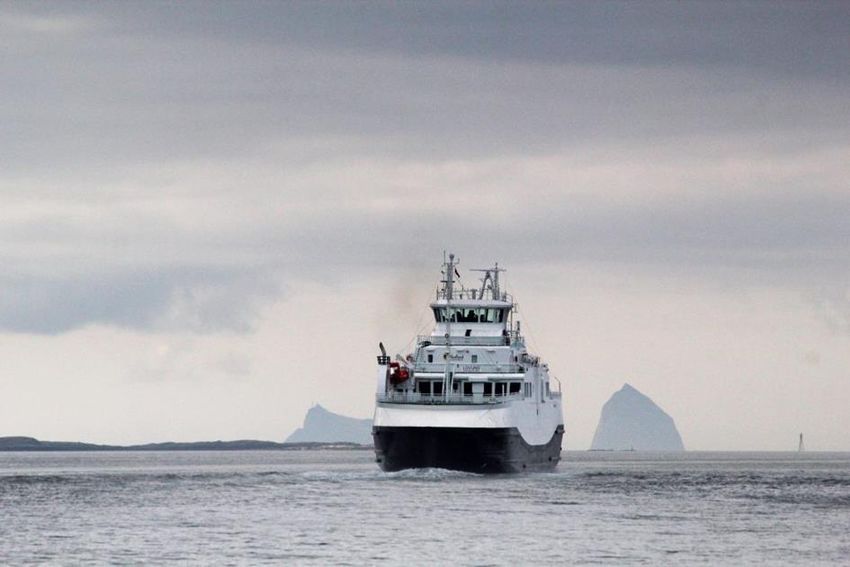
1.1 OBJECTIVE AND SCOPE
The purpose of the study is to highlight the potential future (2030) hydrogen and ammonia demand in
the Norwegian domestic maritime sector. Estimates will be based on information available in OHC at
the time of writing. The report will be updated with new public information, updated data from cluster
members or when new estimates become available.

The overall goal of the work is to provide estimated data about future hydrogen demand. Presented
figures and data should thereby only be used as a reference.

It was decided early to limit the scope of the work and initially focus on ship types and markets where it
is expected zero or close to zero emission requirements by 2030. For the first version of the report the
scope is therefore limited to the following categories:

     -     Domestic car ferries subject to public tenders
     -     Domestic high-speed ferries subject to public tenders
     -     The Kystruten which is subject to public tenders
     -     Offshore ships (PSV, AHTS and mobile drilling units) subject to contracts with oil & gas
           operators which has signalized significant greenhouse gas reductions by 2030
     -     Other known hydrogen projects

1.2 PROJECT HYINFRA
HyInfra is an Ocean Hyway Cluster (OHC) project aiming to reduce technical uncertainties related to
future hydrogen infrastructure projects. The project is structured in work packages as indicated in the
table below. The current report is part of work package C and aims on mapping the size and location of
the future hydrogen demand in the maritime sector. The following sub-reports have been made as part
of the work package C:

     -     C.1 Mapping 2030 hydrogen demand for high speed ferries (report by IFE)
     -     C.2 Mapping 2030 hydrogen demand for domestic car ferries (report by OHC/Multi-Maritime)
     -     C.3 Mapping 2030 hydrogen demand for the Kystruten (report by OHC)
     -     C.4 Mapping 2030 hydrogen and ammonia demand in the offshore sector (report by Amon
           Maritime)

As part of work package A, Sintef Ocean has prepared a report describing the fuel options and ship
types relevant for zero carbon fuels. Information about the most suitable hydrogen-based fuels for
different vessel types are presented in the report, and this input is used as basis for the assumptions in
the current work (work package C).

The results of the work package A and C will be used as the basis for describing technology options and
possible future value chains for maritime hydrogen and ammonia infrastructure in Norway (work
package B).

 Work package                                                                 Delivery
 A       Ship types and relevant fuel types                                   Report
 B       Future hydrogen value chain, technology and suppliers                Report, digital map and data
 C       Mapping future hydrogen demand                                       Reports, digital map
 D       Barriers (safety, politics, finance etc)                             Reports
 E       Uncertainty and project risk related to H2 infrastructure projects   Report, risk registers
 F       Financing and costs                                                  Report. Price levels.

                                                                                                             5
1.3 GENERAL ASSUMPTIONS AND LIMITATIONS
Estimating the maritime hydrogen and ammonia demand in 2030 involves a large degree of uncertainty
relating to scenarios, applied data and end results. Therefore, the following general assumptions and
limitations have been adopted:
- Zero emission technology in 2030 is defined as technology with no local emissions of carbon
dioxide or other greenhouse gases. To estimate carbon dioxide emission reductions “tank to
wake” emission factors are used.
- It is assumed that there will be a mix of energy carriers for different ship types. Expected fuel
types for different ship categories are described in the work package A report by Sintef Ocean.
- Based on conclusions from work package A, it is assumed that the vessel types considered in
the offshore sector will predominantly operate on ammonia in order to achieve zero emissions
in a future scenario. Ammonia is not considered relevant for passenger vessels.
- Based on conclusions from work package A, it is assumed that liquid hydrogen is only relevant
for vessels with hydrogen consumption above 1000kg between bunkering. Below 1000kg,
compressed hydrogen is considered to be the best technical and economic solution.
- It is assumed that hydrogen and ammonia as marine fuels are developed and mature by 2030
with regards to bunkering, on board storage, conversion, integration and rules/regulations.
- Engine and fuel cell efficiencies based on 2020 technology is applied for calculations. Data used
are depicted in the appendix
- Energy consumption and hull performance of future ship types are assumed to be the same
level as modern vessels in 2020. No attempt is made on predicting future developments.
- It is assumed no major developments (more than 10% lower power demand at given speed)
within ship performance the next 10 years. It is assumed that hydro foils and other “new”
technology trends are not widespread by 2030
- For known routes and contracts, it is assumed that the same timetables and vessel capacities
will apply for new contracts
- All future public tenders for car ferry, high-speed craft and Kystruten operation will require zero
emissions, if technical feasible.
- For projects that are not yet initialized, it is assumed that the earliest start-up date for hydrogen
operated vessels is 3 years from the time of writing.
1.4 SCENARIOS
Descriptions of scenarios and specific assumptions related to data and methods are given in the sub
reports C.1-C.4. In general, the presented figures are based on 2030 scenarios where a certain level of
hydrogen or ammonia use is assumed. For some sectors where contract details are known, scenarios
and increase of demand prior to 2030 are based on available information from existing contracts. Also,
some contracts relevant for hydrogen operation will be renewed after 2030. For this reason, the 2030
scenarios are extended to include potential hydrogen demand until 2035.
62 MAPPING OF FUTURE HYDROGEN DEMAND
Detailed descriptions of methods, scenarios and analysis for the different vessel categories are given in
the sub-reports C.1-C.4. A short description of the vessel categories is given below, as well as a
summary of methods and main findings.
2.1 HIGH-SPEED PASSENGER FERRIES (C.1)
High-speed passenger ferries play an important role in the Norwegian public transportation system, but
is unfortunately the mode of transport with highest associated CO 2 emissions per passenger-km. Of the
100 high-speed passenger ferry routes in Norway, diesel is used as fuel for all vessels currently in
operation. In total the high-speed passenger ferry sector consumes about 56 million litres of diesel per
year, equivalent to approx. 0,7% off all the consumed fossil fuels in Norway.
Figure 2: High speed crafts MS Terningen and Osenfjord. Both vessels delivered by cluster member Brødrene Aa.
Photo by: Jan Olav Storli
The high-speed passenger ferry sector is to a large extent based on public contracts, and it is therefore
considered likely that future tenders will require zero emissions. As high-speed passenger ferries have
a high relative energy consumption compared to other vessel types, the sector is considered relevant
with regards to using hydrogen as an energy carrier.
By using publicly available information about tenders and fuel consumption data, routes relevant for
hydrogen is assessed. Out of 96 investigated routes, it is found that 51 routes will be hydrogen powered
and 30 routes battery powered. Most of the fossil fuel consumption may be replaced by zero-emission
solutions by 2027. It is estimated a total yearly energy consumption of 8710 tons of hydrogen, 44 GWh
of electricity and 4.1 million litres of diesel in 2030. This represents a reduction of fossil fuels by 93%,
based on an estimated diesel consumption of 56 million litres in 2021.
72.2 DOMESTIC CAR FERRIES (C.2)
The domestic car ferry sector includes more than 130 ferry connections from the county Agder in
southern Norway all the way to Finnmark in Northern Norway. Annually the whole car ferry fleet in
Norway transports approximately 20 million cars and 40 million passengers, thus being a critical part of
the Norwegian transport infrastructure.
With many short fjord crossings, plug in electric operation is a reasonable solution to achieve zero
emissions in many cases. This however is not necessarily the case for long crossings, several island
connections and routes in remote areas with poor grid capacity.
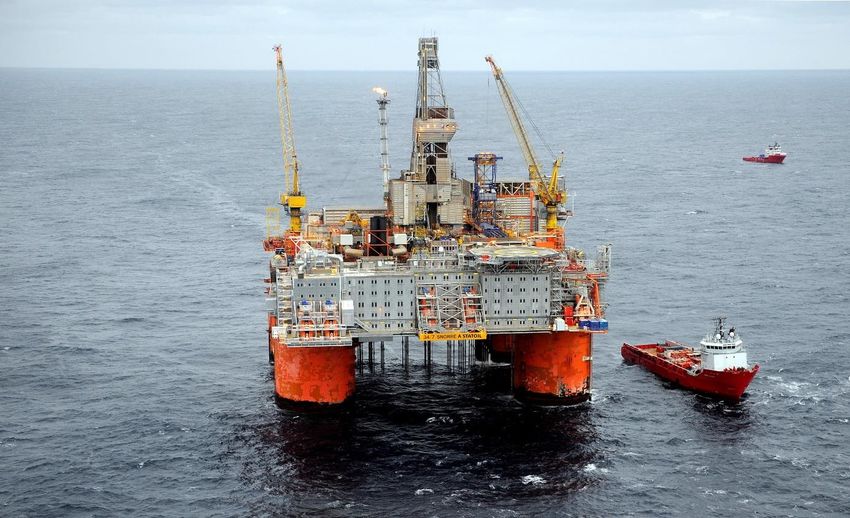
Figure 3: The ferry connection Anda-Lote. Both ferries operating the route are designed by Multi-Maritime and
operated by Fjord1 ASA. Photo by: Tor Arne Aasen/Samferdselsfoto
To estimate the potential hydrogen demand in the domestic car ferry sector, assessments are done of
the routes given in the ferry market overview by the Norwegian public roads administration (NPRA). For
the routes identified as relevant for hydrogen operation, energy and hydrogen consumption for three
scenarios is estimated.
16 ferry connections with a total of 27 ferries are considered challenging or not possible with plug in
battery operation, thus requiring hydrogen in order to achieve zero emissions. For these connections,
findings suggest a total annual consumption of 12 611 tonnes in 2032, corresponding to potential CO 2
emission reductions (tank to wake) of 111 000 tonnes annually.
A second scenario with 12 routes and 21 ferries operated on hydrogen is considered due to high
uncertainty related to battery electric operation on 4 of the identified routes. For this scenario the annual
estimated consumption is 11 620 tonnes hydrogen.
Based on the given assumptions, liquid hydrogen is considered relevant only for the most energy
demanding routes Halhjem-Sandvikvåg, Bodø-Moskenes (Ytre Vestfjorden) and Bognes-Lødingen
(Indre Vestfjorden). For the remaining routes compressed hydrogen is considered more relevant, as the
daily consumption of hydrogen per vessel for most routes is in the range 300-750kg.
82.3 THE KYSTRUTEN BERGEN- KIRKENES (C.3)
The Kystruten is a popular tourist cruise and cargo route transporting passengers, cars and cargo
between Bergen and Kirkenes. Since the Kystruten is subject to tenders by the ministry of transport,
emission requirements are strict compared to the commercial cruise and tourist sector.
In the contract starting in 2021 there is an upper limit on annual carbon dioxide emissions. To meet
these requirements the vessels that are part of the new contract will run on LNG or liquefied biogas for
main propulsion or in hybrid mode with batteries. For the next contract starting latest in 2032, stricter
emission requirements are expected. Therefore, liquid hydrogen is considered highly relevant as an
energy carrier for the 2030 Kystruten hydrogen scenario.
Figure 4: Illustration of Havila Kystruten Kystruten vessel. The vessels are designed by cluster member Havyard
design & solutions. Illustration by: Havila Kystruten
As described in report C.3, a simplified approach based on the 2017 tender documentation has been
used to estimate the liquid hydrogen demand for the Kystruten contract from 2032. For the scenarios
considered, 335 – 1638 tonnes of annual hydrogen consumption per vessel have been estimated. This
corresponds to annual total carbon dioxide reductions of 43.000 – 173.000 tonnes for all 11 vessels.
92.4 OFFSHORE SECTOR (C.4)
The offshore sector is the largest market for marine fuel in Norway and has historically been an early
adopter and originator of maritime technical innovations. The industry is currently in search of technical
solutions for power generation with low- or zero carbon emissions.
Figure 5: The integrated production, drilling and quarters unit Snorre A in the Norwegian North Sea. Photo by:
Harald Pettersen
For reasons described in the report C.4, the zero-carbon fuel of choice for the offshore market is
assumed to be NH3 due to energy storage requirements and practical factors.
To estimate future ammonia demand, data is collected through conversation and cooperation with
leading E&P companies, rig- and shipowners, as well as shipbrokers, and other market players on the
NCS. In addition, public sources are used to collect vessel technical specifications, and AIS data has
been used to verify regional distribution of the fleet.
It was decided to focus exclusively on fuel demand from the four largest vessel segments: PSV, AHTS
and MODU (Semi-sub and Jackup).
Current diesel-equivalent fuel consumption for each of the four vessel segments were estimated, and
the age distribution in the current fleets were mapped in order to estimate a split between replacement-
and conversion candidates.
Based on the above, three scenarios for NH3 fuel market penetration in 2030 were developed: Low,
Medium and High penetration. Applying the scenarios on the consumption data, the annual estimated
ammonia demand is 514 259 – 1 314 138 tons in the offshore sector, corresponding to potential CO 2
emission reductions of 0,7-1,9 million tons per year.
102.5 OTHER KNOWN PROJECTS (C.5)
In this section publicly known maritime hydrogen projects and initiatives that are ongoing or planned,
will be briefly discussed. Table 1 summarizes the data and indicates the status of each project with
regards to hydrogen operation. The estimated demand for the following projects is included in the
mapping for the 2030 “high scenarios” as presented in chapter 3.
On the ferry route Hjelmeland-Nesvik-Skipavik, Norled will from 2021 operate an 80PCU double ended
ferry that will be fuelled partly on liquid hydrogen. 50% of the vessel energy consumption will come from
hydrogen fuel cells. As this connection is considered ideal for battery electric operation, it is expected
that hydrogen operation will only be required until the end of the contract (2031). Due to no LH2
production facilities in Norway, it is expected that hydrogen will be produced in Germany or France, and
transported to Hjelmeland/Nesvik by truck. Publicly available data is used to estimate annual hydrogen
demand for this route.
In Hellesylt there is an initiative by the Hellesylt Hydrogen Hub (Nowegian Hydrogen Company), working
towards producing and delivering hydrogen to the cruise/tourist ferry connection Hellesylt-Geiranger, in
addition to other potential maritime end users. At the time of writing there is an ongoing tender for
commercial operation of the connection with zero emission requirements from end of 2023. Hydrogen
is considered a relevant fuel alternative for zero emission operation on this connection. As the tender is
open with regards to timetable, ship size, number of vessels etc, the provided estimates are based on
the current timetable operated by two double ended 40PCU ferries. Estimates are based on the same
approach as described in report C.2.
Table 1: Publicly known maritime hydrogen initiatives and estimated future demand
Connection Type of Number Total daily Annual Fuel Date, H2- Status
vessel of consumption consumption type operation
vessels (tonnes) (tonnes)
Hjelmeland- Confirmed
Ferry 1 0,14-0,16 52 LH2 2021
Nesvik from 2021
Geiranger- Potential
Ferry 2 0,25-0,7 100 CH2 2023/24
Hellesylt from 2023
113 POTENTIAL DEMAND 2021-2035
The main findings for each vessel category are presented in detail in the sub-reports C.1, C.2, C.3 and
C.4. In addition, the results are presented in the online map tool as described below.
3.1 ONLINE MAP TOOL ON OHC WEBPAGE
As part of OHC project HyInfra, work package C, an online map tool has been developed to visualize
and present the results. The map includes routes, bunkering locations, fuel types, estimated daily and
annual consumption data and more. The map will be continuously updated when new data are added,
existing estimates corrected/ removed etc.
For the first version of the map, the following data is included:
- High speed passenger ferry routes operated on hydrogen as presented in report C.1
- The high consumption scenario for domestic car ferries as presented in report C.2
- The high consumption scenario for the Kystruten as presented in report C.3
- The low scenario for the offshore sector as presented in report C.4
The online map can be accessed by clicking on the map below.
Figure 6: Illustration and link to OHC hydrogen map tool
3.2 COMPRESSED HYDROGEN (CH2)
Compressed hydrogen is deemed the best technical and economic alternative in cases where ship
design and other technical constraints allow installing necessary equipment and bunkering of CH2. For
this study CH2 is assumed to be the solution for vessels using below 1000kg hydrogen between
bunkering operations.
Based on the given assumptions and analysis as given in the reports C.1-C.2, the total compressed
hydrogen demand in the period 2021 – 2035 is estimated as shown in figure 7. The presented data is
based on the “high scenario” where it is assumed widespread use of hydrogen in future contracts. A
total of 12 423 tons of hydrogen is predicted annually for high-speed passenger and car ferry routes in
7 different counties. Bunkering locations and routes are given in the relevant reports and in the online
map tool.
123500 14000
Annual hydrogen demand per county (tonnes)
3000 12000
Total annual demand CH2 (tonnes)
2500 10000
2000 8000
1500 6000
1000 4000
500 2000
0 0
2020 2022 2024 2026 2028 2030 2032 2034 2036
Vestland Nordland Rogaland
Troms og Finnmark Trøndelag Møre og Romsdal
Oslo Total CH2
Figure 7: Estimated compressed hydrogen demand development from 2021-2035
3.3 LIQUID HYDROGEN (LH2)
Liquid hydrogen is considered necessary when zero emission requirements apply in cases where
compressed hydrogen is not technical feasible due to space limitations, limited bunkering time or other
technical constraints. For the sectors and ship types assessed in this study, only 3 car ferry connections
and the Kystruten is deemed relevant for liquid hydrogen.
The total liquid hydrogen demand in the “high consumption” scenario is estimated as shown in figure 8.
A total of 26 703 tons of hydrogen is predicted, with operation and bunkering locations in the counties
Vestland, Nordland, Troms & Finnmark and Rogaland. The latter includes the Hjelmeland-Nesvik
connection, however this route is expected to be solved by plug in electric operation after the contract
ends in 2031.
1312000 30000
Annual hydrogen demand pr county (tonnes)
Total annual LH2 demand (tonnes)
10000 25000
8000 20000
6000 15000
4000 10000
2000 5000
0 0
2020 2022 2024 2026 2028 2030 2032 2034 2036
Vestland Nordland Troms & Finnmark Rogaland Total LH2
Figure 8: Estimated liquid hydrogen demand development 2021-2035
The assumed bunkering locations in the 2032 “high consumption” scenario is depicted in figure 9. Due
to the ferry connection Bodø-Moskenes and the Kystruten with assumed bunkering in Bodø both in
northbound and soutboun direction, Bodø is expected to be the location in Norway with the highest
hydrogen demand.
12000
Annual bunkering (tonnes)
10000
8000
6000
4000
2000
0
Figure 9: LH2 bunkering locations for 2032 scenario
143.4 AMMONIA (NH3)
Ammonia as a zero-carbon fuel is in this report only considered for the offshore sector. It is however
expected that ammonia is relevant for several other ship categories within deep sea shipping that are
currently not included in this report.
The estimated development in ammonia demand from 2021 to 2030 is given in figure 10, indicating a
high scenario and a low scenario. The potential annual demand in 2030 is estimated in the range 0,51
– 1,31 million tonnes, with bunkering on the different supply bases along the Norwegian coast. Figure
11 indicates the estimated bunkering volumes in the different operational areas, which gives an
indication of where future demand will take place.
1 400 000
Estimated annual ammonia demand
1 200 000
1 000 000
(tonnes / year)
800 000
600 000
400 000
200 000
-
2021 2022 2023 2024 2025 2026 2027 2028 2029 2030
NH3 demand high scenario NH3 demand low scenario
Figure 10: Estimated development in ammonia demand 2021-2030
700 000
Annual demand NH3 (tonnes)
600 000
500 000
400 000
300 000
200 000
100 000
-
South West North West Mid North
Low 246 844 179 990 51 426 35 998
Medium 438 815 319 969 91 420 63 994
High 630 786 459 948 131 414 91 990
Figure 11: Estimated ammonia demand in the different operational areas along the Norwegian coast
153.5 CARBON DIOXIDE EMISSION REDUCTIONS
The carbon dioxide reduction potential has been estimated based on CO 2 emission factors for tank to
wake, meaning that emissions from production and distribution of fuels have been neglected. Reduction
potential are thus calculated based on known factors for fuels being used in current contracts and by
assuming zero emissions when operating on hydrogen. Other greenhouse gas emissions such as
methane slip from gas engines have also been neglected.
The annual estimated CO2 emission reduction for each sector is depicted in figure 12. In the figure the
high consumption scenarios have been used for all sectors except the offshore sector. CO2 reductions
in the offshore sector is based on the “low scenario” to better illustrate the reduction potential in the
different sectors and due to higher uncertainty related to future demand in this sector.
The total estimated CO2 reduction potential for the considered scenarios and vessels are approximately
1,172 million tonnes.
CO2 reduction potential per sector (tonnes/year)
158 364
112 800
173 000
728 661
High speed crafts Car ferries Coastal route Offshore sector (low scenario)
Figure 12: Estimated CO2 reduction potential
4 FURTHER WORK
The goal of OHC HyInfra project, work package C, has been to establish a database with future potential
maritime hydrogen projects and estimates of future demand. Further work will therefore include
improving the estimates and update reports and map tools accordingly. In addition, further work will
include mapping potential hydrogen and ammonia demand in other sectors, including among others:
- Cargo vessels
- Bulk (dry/wet) vessels
- Cruise and tourist vessels
- Etc.
165 ACKNOWLEDGEMENTS
OHC administration thanks all cluster members that have participated directly or indirectly in the project.
A special thanks to the following:
Institutt for energiteknikk (IFE). Responsible for mapping,
analysis and the report C.1 (high speed crafts). In
addition IFE contributed with valuable insights and
information related to approach and information for other
parts of OHC HyInfra.
Multi-Maritime AS. For sharing information about energy
demand, enabling estimates in the ferry sector
Sintef Ocean. Responsible for work package A in the
HyInfra project. Sintef also contributed with valuable
information and insights on technical matters throughout
the work
Amon Maritime AS. Responsible for mapping, analysis,
and the report C.1 (offshore sector). Contributed as a
technical resource in discussions related to use of
ammonia and hydrogen as marine fuel
176 APPENDIX
6.1 COMMON DATA USED FOR CALCULATIONS
CH2
# Description Unit MGO LNG HVO LH2 (250bar) LNH3
1 Density kg/m3 890 450 780 71 17,6 670
2a LHV MJ/kg 42,7 49 44,1 120 120 18,9
2b LHV kWh/kg 11,9 13,6 12,3 33,3 33,3 5,3
2c LHV volumetric kWh/l 10,6 6,1 9,6 2,4 0,6 3,5
3a Efficiency FC (PEM) % - - - 50 % 50 % 45 %
3b Efficiency FC (SOFC) % - - - 65 % 65 % 60 %
4a Efficiency 4s (medium speed) % 42,5 % 42,5 % 42,5 % - - 42,5 %
4b Eq. SFC g/kWh 198 173 192 - - 448
5a Efficiency 4s (high speed) % 37,5 % 37,5 % 37,5 % - - -
5b Eq. SFC 225 196 218 - - -
6a Efficiency 2s (low speed) % 50,0 % 50,0 % 50,0 % - - 50,0 %
6b Eq. SFC 169 147 163 - - 381
CO2 emission factor ("tank to
7 wake") kg/kg 3,20 2,75 3,20 0 0 0
Abbreviations:
LHV: Lower heating value
PEM: Proton exchange membrane
FC: Fuel cell
SFC: Specific fuel consumption
CO2: Carbon dioxide
SOFC: Solid oxide fuel cell
MGO: Marine gas oil
LNG: Liquiefied natural gas
CH2: Compressed hydrogen
LH2: Liquid hydrogen
LNH3: Liquid ammonia
HVO: Hydrotreated Vegetable Oil (biodiesel)
18You can also read