AN ESTIMATION OF PASSENGER CAR EQUIVALENT OF MOTORBIKES
←
→
Page content transcription
If your browser does not render page correctly, please read the page content below
AN ESTIMATION OF PASSENGER CAR EQUIVALENT OF MOTORBIKES

                                 Ngoc-Hien Do†1, Quynh-Lam Ngoc Le2, and Ki-Chan Nam3
                             1,3
                               Department of Logistics Engineering, Korea Maritime University,
                            #1 Dongsam-dong, Yeongdo-gu, Busan, 606-791, Republic of Korea
                 2
                   Department of Industrial Systems Engineering, Ho Chi Minh City University of Technology
                                268 Ly Thuong Kiet, District 10, Ho Chi Minh City, Viet Nam
                Email Addresses: 1hienise97@yahoo.com, 2lequynhlam@yahoo.com and 3namchan@hhu.ac.kr

ABSTRACT                                                       An agent-based approach used to design a
Much research has been conducted on trying to solve            Transportation Regulation Support System (TRSS) is
traffic problems and applied successfully in many              able to monitor the network activity under normal
developed countries where the car is the main transport        conditions and to automatically adjust to the
mode. However, it has not been effective in most               environment changes by proposing feasible solutions in
developing countries where the motorbike, rather than          order to optimize the traffic flow [2]. To examine the
the car, is the main transport vehicle. This paper             effects of vehicle policy intervention on urban
estimates the passenger car equivalent of motorbikes           development and population, GDP and environment
under simulation analysis. Simulation scenarios are            aspects, a system dynamics approach based on the
constructed and run, and the results are analyzed to           cause-and-effect analysis and feedback loop structure
determine that factor. The research shows that the             was proposed [3]. To reduce infrastructure investment,
passenger car equivalent of motorbikes depends on              a single lane for traffic in two directions is constructed
traffic conditions. The factor is expected as a useful         by using Automatic Guided Vehicles [4].
parameter when applying traffic research in developing
countries.                                                     In addition, many traffic simulations have been
                                                               developed and efficiently used. The CORSIM, a
KEY WORDS                                                      microscopic traffic simulation model, has been
Mixed traffic system, Homogeneous traffic system,              constructed and used mainly in the U.S., which has
Simulation analysis, Passenger car equivalent of               specific strengths that assist in the modeling of
motorbikes                                                     complicated geometry conditions, to simulate different
                                                               traffic conditions, account for the interactions between
                                                               different components of networks, interface with
1. Introduction                                                external control logic and program, and model time-
                                                               varying traffic and control conditions. Furthermore,
Traffic systems particularly in developing countries are       many new traffic simulations are useful tools to support
completely different from those in developed countries,        traffic operation analysis such as INTERGATION,
where the motorbike is the main transport form rather          VISSIM, MITSIM, WATSIM, PARAMICS, and
than the car, so traffic systems’ behaviors are distinct.      TRANSIMS [5].
Rather than fully complying with the traffic regulations,
vehicles are also guided by nature rules. Together with        Although the aforementioned models have been
other characteristics, traffic systems in developing           successfully applied in developed countries such as
countries are complicated. As in developed countries,          France [2], Netherlands [4] and USA [5] and the
traffic issues are interesting research topics and             modern cities as Dalian, China [3], they are unlikely to
challenges for both the governments and researchers.           give reliable results if absolutely applied to the traffic
                                                               systems in developing countries. The passenger car is
Many research models have been efficiently applied.            usually used as one of the important indexes of the
Traffic flow theories including both macroscopic and a         traffic systems. Rarely research has been done on the
microscopic treatment are intended to provide an               passenger motorbike, while it is the primary transport
understanding of the phenomena relative to the                 mode in most of developing countries. For example in
movement of individual vehicles along a highway.               Viet Nam, according to the Vietnamese Traffic and
Other theories about queuing and delays at isolated            Public Works Service (2007), about 21.72 million
intersections have been constructed to discuss the effect      individual motorbikes were registered in 2007, in a
of isolated intersections on the delay to drivers. For         population of 81 million, compared with only 1.11
reasons of safety and avoiding the coincidence of two          million cars. Therefore, for application in developing
cars occupying the same space at the same time, a              countries in general further considerations and
traffic control theory was presented. Other traffic            adjustments need to be investigated.
theories such as traffic generation, distribution, and
assignment have been introduced [1].
†:
     Corresponding author
 Proceedings 24th European Conference on Modelling and
 Simulation ©ECMS Andrzej Bargiela, Sayed Azam Ali
 David Crowley, Eugène J.H. Kerckhoffs (Editors)
 ISBN: 978-0-9564944-0-5 / ISBN: 978-0-9564944-1-2 (CD)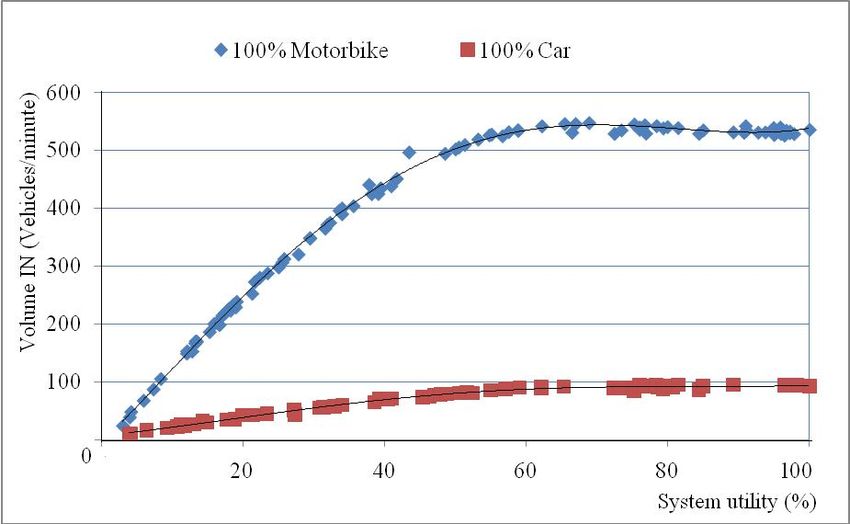
In this paper, the passenger car equivalent of                 appropriately sized rectangular. Therefore, the
motorbikes is estimated under simulation analysis,             simulation model is modeled as a 2D one. Each vehicle
where a simulation model for the mixed traffic system          has its own velocity and acceleration. The maximum
[6] is used to support. For this estimation, suitable          velocity differs not only between cars and motorbikes,
simulation scenarios are generated. Analyses are               but also among the same vehicles. These characteristics
performed based on simulation results. The passenger           are the main reasons for the conflictions among the
car equivalent could be used as a referent factor to           entities in the system. All the relative information is
convert the number of motorbikes to that of car and vice       shown in Table 1.
versa. It supports the more convenient determination of
alternatives to improve traffic systems in developing                           Table 1: Vehicles’ Parameters
countries. Finally, some suggestions and conclusions
                                                                           Physical
are proposed.                                                            information
                                                                                                Velocity
                                                                                                                  Acceleration
                                                                                                 (km/h)
                                                                             (m)                                    (m/s2)
                                                                       Length Width     Vmaxa    Vmaxb     Vmed
                                                                Car       4       1.8    40       80        50        2.5
2. Methodology                                                 Motor      2       0.8    30       60        40         3

The system considers two situations. The first system
comprises 100% cars and 100% motorbikes that are               The maximum speed is modeled as drawn from a
analyzed separately. Two simulation model groups are           uniform distribution in the range Vmaxa to Vmaxb. In
developed, in which one is used to simulate only the           addition, the initial speed follows a normal distribution,
cars’ behaviors and the other only the motorbikes’.            in which Vmed is the mean of population. Furthermore,
Based on the simulation results, the system’s                  the Poisson distribution is used to generate vehicles. In
parameters in individual situations, the relations among       this paper, its mean, the number of vehicle entering the
the system’s factors, and the system’s saturated               system per minute, depends on the scenarios, which is
conditions are determined. Finally, based on                   called the expected volume factor.
comparisons between two cases, an estimation of
passenger motorbikes equivalent of a car is done in the
homologous traffic system.                                     2.2 An Overview of Simulation Model

The other situation considers a mixture of traffic (car        Many logic models have been applied to simulate
and motorbike) on the road. The interaction between            driver-vehicle-units (DVUs) behaviors, such as car-
two transport modes is considered. Actually, the ratio         following, free acceleration, lane-changing, direction-
between them is changed according to the simulation            changing, stop-run, and intersection-conflict models [6].
scenarios under the system’s saturated conditions. The         Especially, the lane-changing approach usually used to
simulation results are recorded and analyzed to                simulate passenger car is modified to simulate the
determine that factor.                                         passenger motorbike. It is called as sub-lane changing
                                                               approach, in which a sub-lane is a virtual lane on the
                                                               road. Motorbikes can occupy any lateral position across
2.1 Input Data                                                 the carriageways instead of traveling within real lanes,
                                                               so they can move to one or two sub-lane(s) either on the
A set of experiments are constructed on a stretch of           left or the right hand side, while cars have to change to
road, as shown in Figure 1. The 8-meter wide, two-lane         the next real lane on the left hand side. Although
road comprises three segments, in which vehicles are           moving to the right side or changing more than one sub-
generated in the first 100m-long segment as a warm-up          lane to overtake another is illegal, it is ubiquitous.
segment, the main physical part of the system is the           Priorities of lane usage are denoted from one to four, in
second 500m-long segment, and the final 100m-long              decreasing order of common priority, which is called as
segment is used to release vehicles. The physical              flex-passing rules as shown on the Figure 2. In addition,
system is coded and converted into a part of the               motorbikes usually move in virtual groups. The sharp,
simulation data file, which is a fixed-data element of         speed and quantity of DVUs of the groups are changed
simulation scenarios.                                          usually and depends on the lead vehicle(s) and DVUs
                                                               behaviors in the groups.
Another unchangeable component is vehicles’ physical
parameters. When a vehicle travels on the road, from
the top-down view it occupies an area, so in this
simulation program each vehicle is represented by an

                                            Figure 1: Physical Simulation System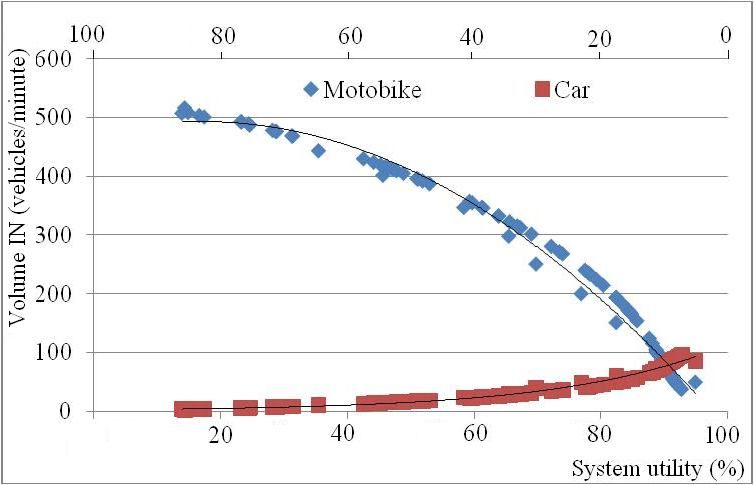
entering the system is maintained above the saturated
point, and the number of cars entering the system
increases.
3. Analysis
Figure 2: Flex-Passing Rules on Virtual Lanes In the first situation with 100% cars, the system obtains
the highest “busy level”, at approximately 281.10 cars
Some factors or indexes such as Volume IN, Volume per kilometer, at which its average speed is reduced to
OUT, Average Speed, and Density Index are used to the low level at about 19.05 kilometers per hour. After
validate the simulation model and evaluate the reaching the saturated point, the system oscillates
simulation results. These factors are recorded directly or around it at high “busy levels”. The system’s serving
indirectly through parameters obtained from counter capacity is shown as equation (2),
machines set up at all inputs and outputs of roads.
Among these factors, Volume IN ( VIij -
y1 f1 ( x) 8325.8 x 6 25826 x5 28916 x 4 14251x 3
vehicles/minute) is the average number of vehicles type
4075.2 x 2 1797.1x 25.235
ith travelling into the system at the road jth, Volume
OUT ( VOij - vehicles/minute) is the average number of x [0,1], y1 0 (2)
vehicles type ith exiting the system at road jth, and the where, y1 : The number of motorbikes entering the
Average Speed is determined through vehicle’s system per minute, in vehicles per minute.
travelled distance and time. The density of traffic used x : System’s utility, in percentage
to evaluate the system’s “busy level” is determined by
using a formula provided by Gazis (2002) [1] as shown In the other one with 100% motorbikes, similarly, after
in equation (1). determining the system’s saturated conditions and
system’s utility, the interrelation between the Volume
Volume OUT IN factor and system utility factor is fitted as equation
Density = (1)
Average Speed (3). As shown on the Figure 3, both systems seem stable
when their utility factors reach around 60 percent.
The other factor is the Utility factor, in percentage, Before that point, although two factors increase
which expresses the system’s utility. It is evaluated by simultaneously, the slope of motorbike curve is larger
comparing with the highest density level or system’s than another one.
capacity for each homogeneous situation. Actually, the
traffic states on the road section are determined by the y2 f 2 ( x) 2351.7 x 6 7823 x5 9727.8 x 4 5569.1x 3
simulation settings such as warm-up time and other 1582.5 x 2 366.32 x 2.829
conditions. x [0,1], y 2 0 (3)
where, y2 : The number of cars entering the system per
2.3 Experiments minute, in vehicles per minute.
Simulation scenarios are built up and grouped into three
main groups according to the simulation’s primary
purposes. Group 1 considers the case with 100% cars
traveling in the system. The number of vehicles
entering the system increases up to the saturated point,
at approximately 94 vehicles per minute. The second
group considers that case with 100% motorbikes
operating in the system. Similarly with the previous
case, the number of entities entering the system
increases up to the saturated point too, at approximately
540 motorbikes per minute. After determining the
saturated points in both cases, the last main group is
considered under the saturated conditions with mixed
Figure 3: Interrelations of Volume IN Factor and
traffic systems.
System Utility Factor in Homogeneous Case
Actually, the ratio between cars and motorbikes is Based on the interrelations among the system’s factors
changed by different simulation scenarios, but two in both situations, the passenger car equivalent of
methods are used to ensure that the system operates at motorbikes is estimated at each different system utility
saturated conditions. In the first way, the number of as in equation (4). The system serves an equivalent
cars is generated at high levels above the saturated point quantity between the cars and motorbikes, and the ratio
and then the number of motorbikes entering the system between them at each system utility is concluded from
increases. In the second way, the number of motorbikes the equations (2), (3) and (4) and shown on Figure 4.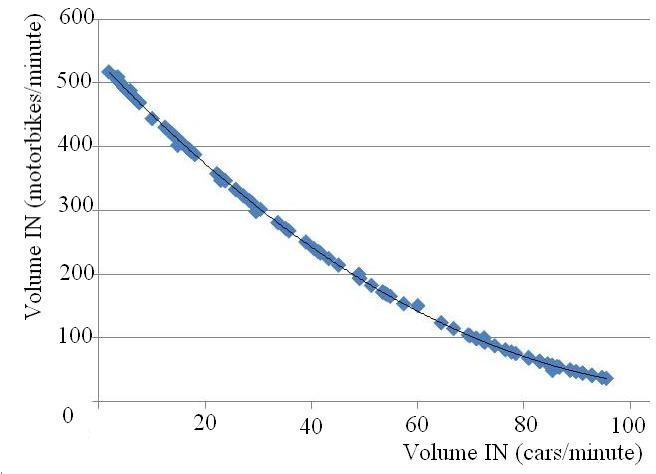
The equivalent factor increases rapidly when the system
utility factor is lower than 20 percent. It reaches above
6.5 when the system utility factor ranges from 20
percent to 40 percent. In the other stage, the conversion
ratio seems to be slightly reduced,
y1 f ( x)
f ( x) 1 x [0,1] (4)
y2 f 2 ( x)
where:
y1 : The number of motorbikes entering the system per
minute, in vehicles per minute.
y2 : The number of cars entering the system per minute, Figure 5: Volume IN –System Utility Relation in a
in vehicles per minute. Mixed Traffic System
In addition, the relation of the Volume IN factors
between two populations is inverted and fitted as
equation (6). It follows a poly-function instead of a
linear one as shown on the Figure 6. The changeable
ratio between two populations is withdrawn from the
equation (6) and shown as equation (7). The passenger
car equivalent of motorbikes depends on the system’s
car utility. It is determined from the equations (5) and
(7) and shown on the Figure 7.
y1 0.0372 y22 8.7581y2 533.74 (6)
Figure 4: The Passenger Car Equivalent of Motorbikes
in Homogeneous Case
In the mixed traffic case, cars and motorbikes travel in
the same system, and thus affect together. As mentioned
previously, the system is only considered at the high
“busy level” and there are two ways to generate the
saturated conditions. In the first one, the cars make the
system operate at high level and the number of
motorbikes is increased. The interrelations between the
Volume IN factor and the system utility factor of two
populations are determined as shown on Figure 5. Two
curves are inversed together because cars and
motorbikes travel in the same system. Actually, when Figure 6: The Volume IN Inversion of Two
the number of motorbikes increases, that of cars Populations in the Mixed Traffic System
decreases. The reduction of cars in quantity and
system’s utility, simultaneously, follows an exponential
distribution as equation (5), dy1
0.0744 y2 8.7581 (7)
dy2
y2 f 2 ( x2 ) 1.9894e4.0484 x2 x 2 [0,1] (5)
where, x2 : Car’s utility, in percentage The conversion rate increases when the car’s utility in
the system decreases. The curve increases so fast when
the car’s utility reduces from 100 percent to around 50
percent. In another stage, it slowly increases from
around 8 to 8.6.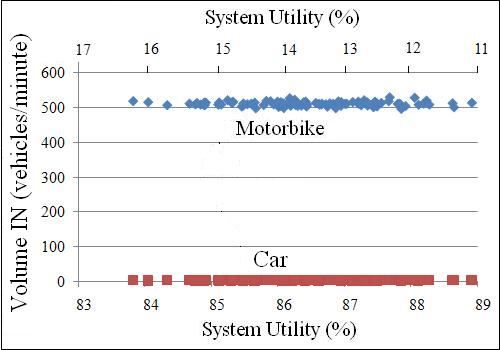
Figure 9: Car Population in the Mixed System
at Saturated Conditions with Motorbike
Domination
Figure 7: The Passenger Car Equivalent of Motorbikes
in Mixed Case with Car Domination
Flexibility, a special characteristic of motorbikes,
allows them to travel in unfixed lanes, easily change to
a suitable lane, and exhibit high acceleration because
small size is its advantage. In addition, car’s speed is
adjusted by the number of motorbikes traveling in the
system, so that the affected level increases
synchronously. Therefore, when car’s utility does not
dominate motorbike’s one, lower than 50 percent, the
conversion rate increases slightly although the car’s
utility decreased in the same rate. Figure 10: Motorbike population in the mixed system
at saturated conditions with motorbike domination
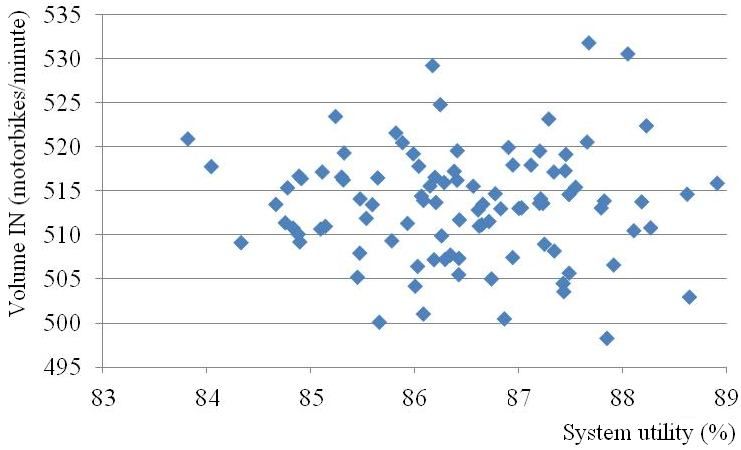
When the system’s saturated conditions are generated
by motorbikes instead of cars, their effects on the
system are clearly shown. Although the number of cars
entering the system is increased, the other factors of
both populations still vary around. The interrelations of
Volume IN factor and system utility factor of two
populations are shown as on the Figure 8, where two
populations are stable in the mixed system with
motorbike domination. Each population is shown more
clearly in the Figure 9 and Figure 10 for car population
and motorbike one in respectively. The conversion rate
is determined based on the variations of both
populations as shown on the Figure 11. From the
simulation results the authors conclude that the Figure 11: The Passenger Cars Equivalent of
passenger car equivalent of motorbikes follows a Motorbikes in Mixed Case at Saturated Conditions
normal distribution with mean = 23.279 and standard with Motorbike Domination
deviation = 1.539.
4. Conclusions
The passenger car equivalent of motorbikes was
determined from simulation results. It depends on
traffic conditions that whether the traffic system is
homogeneous or mixed or how much car’s ratio in the
mixed system is. The results will be useful for many
research applications in developing countries.
Mathematical models and useful technologies that
facilitate the efficient solution and improvement of
traffic problems in developed countries where the car is
the main transport mode can be applied in analogous
ways.
Figure 8: Two Populations in the Mixed System at
Saturated Conditions with Motorbike Domination For example, considering the underdeveloped
infrastructure of developing countries and comparingthe ratio between cars and motorbikes on the same Applications, Elsevier, 2007. Available at:
system, suitable policies include limiting the number of www.elsevier.com.
cars travelling in the traffic system, and replacing the [16] U. Klein, T. Schulze, and S. Straburger, “Traffic
car with the motorbike as the main transport vehicle. simulation based on the high level architecture”,
Proceedings of the 1999 Winter Simulation
References Conference, 1999, pages 1095-1103. Available at:
http://www.wintersim.org/.
[1] D.C. Gazis, “Traffic Theory”. New York, Boston, [17] W. Bernhard and P. Portmann, “Traffic simulation
Dordrecht, London, Moscow: Kluwer Academic of roundabouts in Switzerland”, Proceedings of the
Publishers, 2002. Available at: 2000 Winter Simulation Conference, 2000, pp.
http://ebooks.kluweronline.com. 1148-1153. Available at:
[2] F. Balbo, and S. Pinson, “Using intelligent agents http://www.wintersim.org/.
for Transportation Regulation Support System [18] R. B. Wiley and T. K. Keyser, “Discrete event
design”, Transportation Research Part C, Elsevier, simulation experiments and geographic information
2010, pp 140-156. systems in congestion management planning”,
[3] J. Wang, H. Lu, and H. Peng, “System dynamics Proceedings of the 1998 Winter Simulation
model of urban transportation system and its Conference, 1998, pp. 1087-1093. Available at:
application”, Journal of transportation systems http://www.wintersim.org/.
engineering and information technology, Elsevier, [19] M. Lemessi, “An SLX-based microsimulation
2008, pp 83-89. model for a two-lane road section”, Proceedings of
[4] M. Ebben, D. van der Zee, and M. van der Heijden, the 2001 Winter Simulation Conference, 2001, pp.
“Dynamic one-way traffic control in automated 1064-1071. Available at:
transportation systems”, Transportation Research http://www.wintersim.org/.
Part B, Elsevier, 2003, pp. 441-458. [20] M. P. Hunter, R. M. Fujimoto, W. Suh, and H. K.
[5] L. E. Owen, Y. Zhang, L. Rao, and G. McHale, Kim, “An investigation of real-time dynamic data
“Traffic flow simulation using CORSIM”, driven transportation simulation”, Proceedings of
Proceedings of the 2000 Winter Simulation the 2006 Winter Simulation Conference, 2006, pp.
Conference, 2000, pp. 1143-1147. Available at: 1414-1421. Available at:
http://www.wintersim.org/. http://www.wintersim.org/
[6] Q-L. N. Le, N-H. Do and K-C. Nam, “A simulation
model for the mixed traffic system in Vietnam”, Biographical notes:
International Journal of Simulation and Process
Modelling, Inderscience, 2009, Vol.5, No.3, Ngoc-Hien Do is a Doctoral student at the Department
pp.233-240. of Logistics Engineering, Korea Maritime University,
[7] A.M. Law, and W.D. Kelton, “Simulation Republic of Korea. He received his BEng in Industrial
Modeling and Analysis”, Singapore: McGraw-Hill, Systems Engineering from the Ho Chi Minh City
1999. University of Technology (HCMUT), Viet Nam, and
[8] W.D. Kelton, R. P. Sadowski, and D. A. Sadowski,
his MSc in Logistics Engineering from the Korea
“Simulation with Arena”, USA: McGraw-Hill,
1998. Maritime University, Korea. He works as a Lecturer
[9] H. A. Taha, “Operations Research: An and Researcher at the Department of Industrial Systems
Introduction”. USA: Macmillan Publishing Engineering Department, HCMUT.
Company, 2007.
[10] R. W. Hall, “Handbook of Transportation Quynh-Lam Le Ngoc is a lecturer of Department of
Science”. USA: Kluwer Academic Publishers, Industrial Systems Engineering, Ho Chi Minh City
1999. University of Technology, Viet Nam. She received her
[11] J. Banks, “Handbook of Simulation”, USA: John BEng in Electronics Engineering from the Ho Chi Minh
Wiley & Sons, 1998. City University of Technology (HCMUT), Vietnam,
[12] H. Bossel, “Modeling and Simulation”, Germany: and MEng in Industrial Systems Engineering from the
A K Peters, 1994. Asian Institute of Technology (AIT), Thailand and PhD
[13] S. Kara, F. Rugrungruang, and H. Kaebernick, in Logistics Department from the Korea Maritime
“Simulation modeling of reverse logistics University (KMU), Republic of Korea.
networks”, International journal of production
economics, Elsevier, 2006. Available at: Ki-Chan Nam is a Professor at the Department of
www.elsevier.com. Logistics Engineering, Korea Maritime University,
[14] J. Wahle, O. Annen, Ch. Schuster, L. Neubert, and Republic of Korea and works as an administrator of the
M. Schreckenberg, “A dynamic route guidance Center for Integrated Logistics Management &
system based on real traffic data”, European Technology Support (CILS). He was also a member of
journal of operational research, Elsevier, 2001. a committee in the Busan Port Authority (BPA). He
Available at: www.elsevier.com. received his BEng in Navigation from the Korea
[15] W. Wen, “A dynamic and automatic traffic light Maritime University, and his MEng and PhD in
control expert system for solving the road Transportation Planning from the University of Wales,
congestion problem”, Expert Systems with UK.You can also read