Experimental Evaluation of Museum Case Study Digital Camera Systems
←
→
Page content transcription
If your browser does not render page correctly, please read the page content below
Experimental Evaluation of Museum Case Study
Digital Camera Systems
Erin P. M. Smoyer, Lawrence A. Taplin, and Roy S. Berns
Munsell Color Science Laboratory, Rochester Institute of Technology
Rochester, NY, USA
Abstract institutions have a choice of whether to continue imaging
the traditional way or start imaging using digital technology.
A testing procedure was designed for characterizing Procedures for testing the quality of digital cameras
both the color and spatial image quality of trichromatic have been established in the recent past, but they are not yet
digital cameras, which are used to photograph paintings in suitable and comprehensive enough to be used in a museum
cultural heritage institutions for the purpose of creating setting and have not been developed specifically for the
archival quality digital master images. The testing direct digital capture of artwork. The ultimate goals of this
procedure was target-based, thus providing objective research were twofold. First, it is beneficial to the cultural-
measures of quality. The majority of the testing procedure heritage community because it might provide a possible
followed current standards from national and international guideline for high-quality-digital imaging and second, it
organizations such as ANSI, ISO, and IEC. The procedure benchmarked four camera systems and procedures currently
was tested in the Munsell Color Science Laboratory, an used for digital imaging by the cultural-heritage community.
academic research laboratory, as well as used to benchmark Although the saying, “You get what you pay for” typically
four representative American museum’s digital-camera applies in the acquisition of imaging systems, there is no
systems and workflows. The four museums were chosen substitute for the careful and thorough testing and
because they were early adopters of digital-image archiving. benchmarking of digital-imaging systems.1 Benchmarking
The nine quality parameters tested included system systems help to compare different camera systems, giving
spatial non-uniformity, tone reproduction, color better information than the manufacturers provide, and
reproduction inaccuracy, noise, dynamic range, spatial should lead to a better understanding of the whole imaging
cross-talk, spatial frequency response, color-channel process.2
registration, and depth of field. In addition to the The aims of the testing procedure were to follow
characterization testing, two paintings were imaged and current digital-photography standards to the greatest extent
processed through each museum’s normal digital workflow. possible, provide only objective measures of image quality
The results of the four case studies showed many by imaging test targets, and be as automating as possible
dissimilarities among the digital-camera systems and with the use of The MathWorks MATLAB programming
workflows, which caused a significant range in the archival language analysis software. The outcome of this procedure
quality of their digital masters. These differences point out was an extensive quantitative description of the digital-
the need for standardization of digital imaging in American image-quality parameters, which characterized four museum
museums, libraries, and other cultural-heritage institutions. digital cameras and procedures used for the direct-digital
capture of cultural heritage paintings.
Introduction
Case Study Descriptions
For decades, museums, libraries, and other cultural-
heritage institutions (referred to as “museums” in this The cameras and lights used in the case studies in each
publication) have been using analog photography as a of the four museums were different. The four museums
means for documenting their collections and producing were not chosen for the case studies for this reason. They
reproductions of their artifacts. Through the years, these were chosen because they were early adopters of digital-
institutions developed “best practices” for the process of image archiving.
documentation and reproduction, which included
photographing the object, storing the image, and cataloging, Case Study I:
so that a high quality image archive could be obtained and The camera used at the museum’s photography studio
maintained for many years. Now that digital photography is was a Leica S1 Pro digital camera, which is a 3-channel tri-
well established and comparable to analog photography both linear-array-CCD scanning camera. The maximum native
in price and image quality, these cultural-heritage resolution of the camera is 5140p x 5140p. The lens used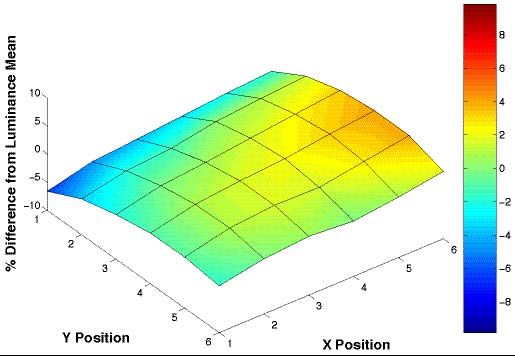
was a 100mm f/2.8 Leica lens. The filter used between the         areas of pigment on each painting and compared across the
lens and CCD was a Leica daylight balancing/IR cut-off            four museums.
filter. There were four Lowel Scandles imaging lights used
to light the scene. These lights had a correlated color
temperature of approximately 5000K.

Case Study II:
      The camera used at the museum’s studio was a Phase
One PowerPhase FX digital camera, which is a 3-channel
tri-linear-array-CCD scanning-back camera. The maximum
native resolution of the camera is 10,500p x 12,600p. The
scanning back was on a TTI 4x5 view camera body. The
lens used was a 150mm Schneider enlarging lens. The filter
used behind the lens was a Phase One tungsten balancing/IR
cut-off filter. The camera was set up on a copy stand. The           Figure 1. Flower (left) and fish (right) paintings used for the
imaging lights used were two TTI Reflective Lighting                analysis of each museum’s digital imaging workflow. Uniform
tungsten lights, which each had four OSRAM 250W Quartz                     areas of pigment are marked with a white circle.
Halogen photo optic bulbs. Their distances from the copy
stand table were adjustable. These lights had a correlated             The purpose of the second part was to characterize each
color temperature of approximately 3000K.                         museum’s camera system and imaging workflow. The
                                                                  images that were analyzed in the second part were
Case Study III:                                                   representative of digital masters. In this part of the case
     The camera used at the museum’s studio was a Sinar           study testing procedure, there were nine quality parameters
Sinarback 54H digital back camera, which is a 3-channel           tested. The first one, system spatial non-uniformity, which
area array CCD camera. The maximum native resolution of           can be caused by uneven illumination of the scene and/or
the camera is 4,080p x 5,440p. The digital back was on a          lens fall-off, was tested using a uniform gray card target.
Horseman 4x5 view camera body, which had a Rollie                 The second is tone reproduction, which was tested using an
electronic shutter. The lens was a 100mm f/4 Rodenstock           ISO standard grayscale target (see Figure 2a) and analyzed
Apo Sironar digital HR lens. The filter used between the          in the form of an opto-electronic conversion function, or
CCD and the lens was a Sinar IR cut-off filter. There were        OECF. The third is color reproduction inaccuracy, which is
four Speedotron Xenon strobe imaging lights in a 202VF            fundamentally caused by the inherent lack of correlation
light unit used to light the scene. These strobe lights had a     between the camera’s spectral sensitivities and those of the
UV correction filter over the bulb. These lights had a            average human observer. These spectral sensitivities were
correlated color temperature of approximately 6700K.              determined by imaging a monochromator instrument. Also,
                                                                  nine different color targets were imaged and analyzed.
Case Study IV:                                                    These targets included the Macbeth ColorChecker, the
     The camera used at the museum’s studio was a Better          Macbeth ColorChecker DC, the Esser Test Chart, a cobalt
Light 6000-2 digital camera, which is a 3-channel tri-linear-     blue pigment target, a Gamblin oil paint target, the IT8
array-CCD scanning camera. The maximum native                     target, the Kodak Color Separation and Grayscale targets,
resolution of the camera is 8,000p x 6,000p. The digital          and a target made from ceramic BCRA spectrophotometer
back was on a Sinar 4x5 view camera body. The lens was a          calibration tiles. The fourth and fifth parameters are noise
210mm f/5.6 MC Sinaron SE. The filter used between the            and dynamic range, which were both tested using an ISO
lens and CCD was a Better Light daylight balancing/IR cut-        standard noise target (see Figure 2b), imaged eight times at
off filter. There were four Broncolor HMI F 1200 imaging          the same exposure level. The sixth image quality parameter,
lights used to light the scene indirectly by bouncing the light   spatial cross-talk, otherwise known as image flare, was
off of white walls and a 12’ ceiling. These lights had a          tested using an IEC standard target (see Figure 2c). The
correlated color temperature of approximately 5000K.              seventh, spatial frequency response, (SFR) which is used to
                                                                  characterize a camera’s ability to reproduce detail, and the
           Case Study Testing Procedure                           eighth, color-channel registration were both tested using the
                                                                  knife-edges of an ISO resolution target (see Figure 2d).
     There were two main parts of the case study testing          Depth of field, the ninth quality parameter that was tested,
procedures. In the first part, two paintings (see Figure 1)       was tested using a three-dimensional target (see Figure 2e)
which were painted with Gamblin Artist Oil paints, were           that had a total depth of 6”.
imaged and processed through each museum’s normal                      The test targets and paintings were approximately the
digital imaging workflow, which is typically used to create       same size, so the camera and lights set-up remained
an archival quality digital master image. The colorimetric        consistent throughout the imaging process, with the
accuracy of these paintings was evaluated using 11 uniform        exception of the imaging of the monochromator instrument
                                                                  and depth of field target. Although the basic imaging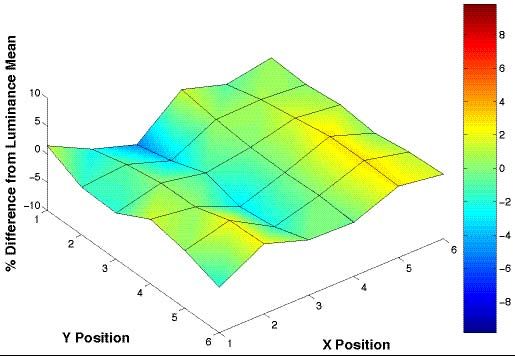
procedure was consistent for all four of the museum case Case Study I Case Study II
studies, they were each still unique because the
photographer had the freedom to follow his normal imaging
procedure.
ΔE00 = 12.22 ΔE00 = 4.01
Case Study III Case Study IV
a.) ISO OECF target b.) ISO Noise target
c.) IEC spatial cross-talk target d.) ISO Resolution target ΔE00 = 6.78 ΔE00 = 13.32
Figure 3. CIELAB a* (green (-) to red (+)) vs. b* (blue (-) to
yellow (+))of the fish painting of the four case studies. Dots are
measured values and vector arrows point to image values. Also
included are the mean ΔE00 values of the flower and fish paintings.
e.) Depth of field target
Part II: Characterization Analysis
Figure 2. Test targets used in the characterization of each
museum’s digital camera system and imaging workflow. System Spatial Non-uniformity
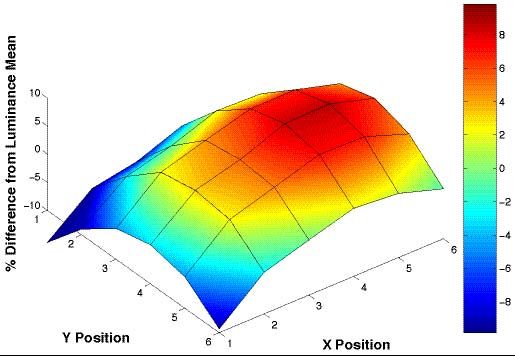
Figure 4 shows the system spatial non-uniformity
results of the four case studies.
Part I: Paintings Analysis
Case Study I Case Study II
The paintings in Figure 1 were imaged in each case
study as if they were one painting, because they both
contained the same pigments. The circled areas of the
paintings in Figure 1 were evaluated for colorimetric
accuracy by comparing the image data to the measurements
made with a spectrophotometer after the lightness
differences caused by the different exposure levels of the
images at each museum were corrected. Figure 3 shows the
hue and chroma errors between the measured data (dots) and Case Study III Case Study IV
image data (vector arrows) of the fish painting in the
CIELAB color space. The longer the vectors, the more
error there was. Included in each plot is the mean ΔE00 (a
CIELAB color difference metric) value between the
measured and image data of both the flower and fish
paintings. The analyzed images were digital masters, and
no visual corrections were performed on these images, so
the color errors were mostly attributed to the camera’s
spectral sensitivities.
Figure 4. System spatial non-uniformity results case study
comparison.
The Y tristimulus value (luminance factor) data for
each of 36 (6 x 6) evenly spaced patches of the gray card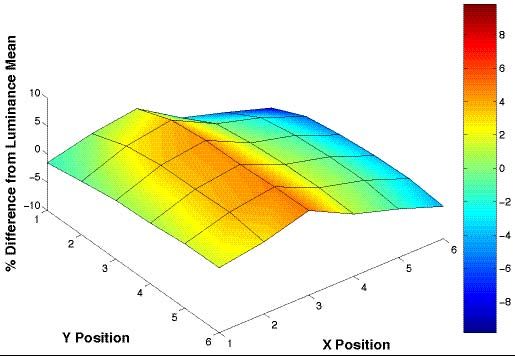
target were compared to the mean image Y tristimulus value Case Study I Case Study II
of all 36 patches and a percent difference was calculated
between them. In Case Study I, light metering was
performed during the imaging system set-up; in Case Study
II, no uniformity correction was done; in Case Study III, the
non-uniformities were corrected using the image capture
software; and in Case Study IV, the uniformity was checked
in the image capture software during set-up.
Tone Reproduction
During the case studies, the target in Figure 2a was
imaged at the nominal exposure, underexposed, and
Case Study III Case Study IV
overexposed, so that the target patch image data over the
full range of possible digital count values were obtained.
The average image target patch values were determined for
each exposure level and rescaled to match the nominal
exposure level. The OECF functions (digital counts vs.
adjusted luminance in cd/m2) for each channel were fitted
with gamma encodings. The mean gammas of the three
channels are listed in Table 1 for the four case studies. The
OECF results from one case study was not necessarily better
than that of any another case study. The gamma encoding
could have been imposed on the images by the camera’s
profile or image software. Some of the case studies had Figure 5. Spectral sensitivity case study comparison of relative
different OECF curves for each channel. If the OECF or spectral sensitivities (dotted lines) rotated to fit the CIE 2°
gamma encoding is known, it can show what the actual standard observer (solid lines).
gamma encoding of each channel is and if there is any
unwanted clipping.
Target-based Color Reproduction Inaccuracy
The color reproduction inaccuracies of the four case
Color Reproduction Inaccuracy
studies can be summarized using ΔE00. The ΔE00 value was
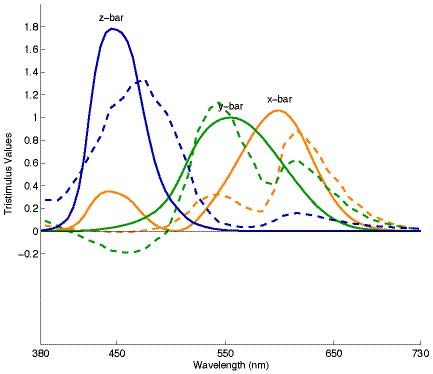
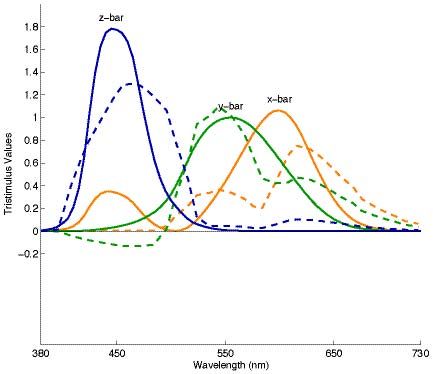
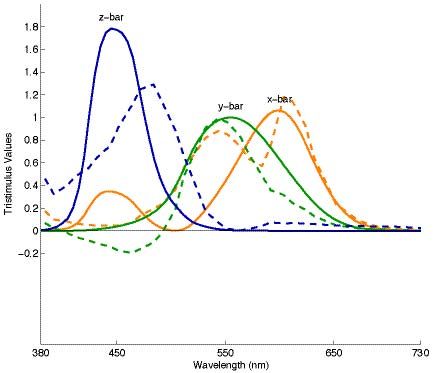
Spectral Sensitivity
determined between the average image data of each patch of
Most digital camera spectral sensitivities are not linear
nine color targets and the spectrophotometrically measured
transformations of an average human visual system’s
data. The mean 90th percentiles of all of the patches of each
spectral sensitivities. This is the underlying reason why
case study are listed in Table 1. The higher this value, the
color inaccuracies exist in digital images. In the case
more color error there was. The amount of color difference
studies, a monochromator instrument was imaged 36 times
errors resulting in all four case studies is mostly dependent
from bandpass peaks of approximately 360nm to 730nm in
on the spectral sensitivities of the camera system and the
10nm increments with the imaging lights turned off. After
accuracy of the profiles used in each case study. Since the
the images were taken, the radiance of the same bandpass
spectral sensitivities of the camera cannot be changed,
peaks were measured with a spectroradiometer. The average
except with the use of filters, it is easier to create a profile
image values of the spot of monochromatic light in the
that is as accurate as possible. The profiles should be
centers of each of the 36 images were divided by the
optimized using a target representing the pigments and
radiance values to obtain relative spectral sensitivities.
materials being imaged with the camera.
Figure 5 shows the relative spectral sensitivities rotated to
fit the CIE standard 2° 1931 standard observer
Noise
“sensitivities.”
The center three patches of the ISO Noise target, shown
The lack of fit to the 2° observer can be summarized
in Figure 2b, were used to evaluate the image noise. The
using a quality metric, µ -factor.3 The µ -factor was
total signal-to-noise ratios, SNRs, of each case study are
calculated for each case study using the imaging illuminant
listed in Table 1. These values were calculated according to
and camera spectral sensitivities, a D50 viewing illuminant,
the ISO 15739 standard.4 The higher this value, the less
and the 2° observer. These results for the four case studies
noise the image had. In order to produce images with a low
are shown in Table 1. The closer that this value is to unity,
amount of noise, at least one dark correction image should
the better the correlation of the camera’s spectral
be subtracted from the digital master images. This was done
sensitivities to the 2° observer. A value of zero signifies no
automatically in the image capture software in Case Study
correlation.
III and not at all in the other case studies. Also, using a low
ISO and short exposure time when imaging will help in the
reduction of the image noise level.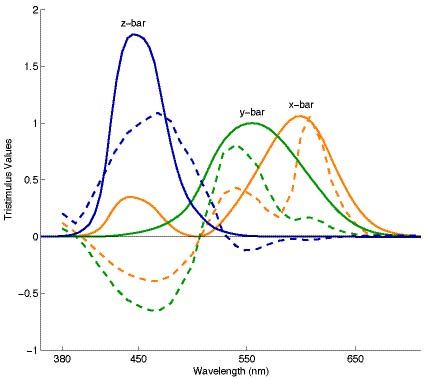
Table 1. Case study characterization results of eight of          flare, in a digital image, the image area surrounding the
the quality parameters.                                           painting being imaged should be as dark as possible.
                        Case   Case     Case
                                                  Case
 Quality Parameter      Study Study Study                         Spatial Frequency Response
                                                StudyIV
                           I    II       III                           The central horizontal and vertical knife edges, along
Tone Reproduction                                                 with the upper left corner square knife edges of the ISO
                         2.80  2.03     1.70      3.70
Mean gamma                                                        resolution target, shown in Figure 2d, were used to
Spectral Sensitivity                                              determine the digital master images’ SFR curves. The
                             0.68    0.79     0.81      0.80
µ-factor                                                          knife-edges were evaluated using Burns’ sfrmat2 program.5
Target-based Color                                                The areas under the SFR curves, which are normalized
Reproduction                                                      between zero and unity, are listed in Table 1 for the four
Inaccuracy                   12.74   6.73     5.05      16.34     case studies. The higher this value, the better the target’s
Mean ΔE00 90th percentile                                         detail was preserved. Un-sharp masking was performed on
of 9 targets                                                      the digital master in Case Study III, which is why the SFR
Noise                        35.85   14.16   14.11      22.79     area was very high (the SNR was very low as a consequence
Total SNR                                                         of the un-sharp masking). The SFR results of the case
Dynamic Range                2.86    2.81     2.65      2.87      studies could have been affected by the tool used for
Density                                                           focusing the images before capture. In Case Study I, the
Spatial Cross-talk                                                photographer focused by looking through the ground glass,
Relative maximum %           5.83    6.52     6.43      3.97      whereas in the other three case studies, a magnification tool
difference
                                                                  or frequency focusing tool in the image capture software
Spatial Frequency                                                 was used to focus the images.
Response
Mean area under the RGB      0.484   0.616   0.862      0.592
curves across all 4 edges
                                                                  Color Channel Registration
from frequencies of 0.0 to                                            The color channel registration was evaluated using the
0.5 cy/pixel                                                      same four knife-edges as in the SFR analysis. It was also
Color Channel                                                     evaluated using Burns’ sfrmat2 program.6 The mean
Registration                                                      amounts of color channel mis-registration of all three color
Mean registration shift      0.130   0.136   0.035      0.027     channels across the four knife-edges are listed in Table 1.
RGB channels and across 4                                         The mis-registration errors in all for case studies were very
edges                                                             low. Mis-registration in images from both scanning and
                                                                  area array CCD cameras can be caused by chromatic
Dynamic Range                                                     aberration of the lens or color filter array lenslets.
     The dynamic range, otherwise known as tonal range, of
a digital camera system is the capacity of the camera to          Depth of Field
capture extreme density variations. The darkest and second             Depth of field is the range of distance for which the
darkest patches of the ISO noise target were used to              subject is rendered acceptably sharp in an image. It
calculate the dynamic range as a luminance ratio according        increases as the lens is closed down (f-stop increases). It is
to ISO standard 15739.4 The log10 of this ratio was               greater for short focal lengths than for long ones, and it
calculated to determine the dynamic range density values          increases with the subject distance. A digital imaging
listed in Table 1 for all four case studies. It is desirable to   system should have a suitable depth of field when it is used
have a high dynamic range. A density of 0.3 is equal to one       to image paintings because a painting is a three dimensional
stop of light (log102). In order to obtain the most dynamic       object that has some depth and a large painting could be
range achievable by a digital imaging system, the amount of       warped. The center column of the depth of field target,
spatial cross-talk or flare should be reduced as much as          shown in Figure 2e, was focused on when the image of this
possible.                                                         target was taken in each case study. The other columns are
                                                                  a total of 3” in front of and behind the center column in 0.5”
Spatial Cross-talk                                                increments. The SFR of each square’s knife-edge on top of
     In order to evaluate spatial cross-talk, the target shown    each of the 13 columns was determined.
in Figure 2c was imaged twice. In the second image, the                Figure 6 shows the depth of field results of the four
target was rotated 180° so that, for example, a gray patch        case studies as plots of the areas under the SFR curves from
with a black background in the first image had a white            frequencies of 0.0 to 0.5cycles/pixel vs. distance. The
background in the second image. The spatial cross-talk            steeper the sides of the curves are, the less depth of field the
results listed in Table 1 for the four case studies are the       case study images had. Also, if the peaks are shifted with
relative maximum percent differences of the 30 gray patches       respect to the focus aim point, then the focusing tool was
between the two target image rotations. The lower this            not accurate.
value, the less spatial cross-talk the digital masters had. In
order to reduce the amount of spatial cross-talk, or image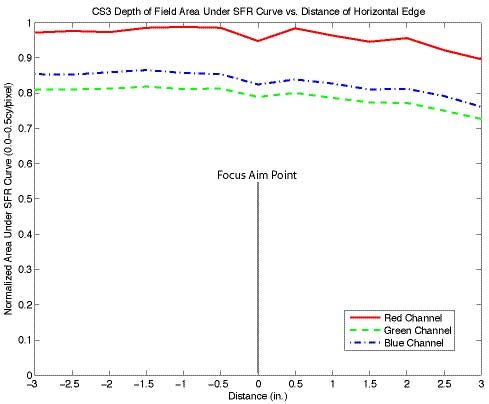
Case Study I                       Case Study II                 Ideally, a raw digital image should be captured and
                                                                     stored as a digital master with the characterization metadata
                                                                     of the digital-imaging system. This way, the digital
                                                                     information is as accurate as possible and if, in the future,
                                                                     there is an improvement in the way digital data are
                                                                     interpreted, the raw data and information about the means
                                                                     by which it was formed can be retrieved. Cultural heritage
                                                                     institutions should also document their digital-imaging
                                                                     workflows for future reference. When a painting is
                                                                     digitized, an accurate archival quality reproduction of the
         Case Study III                     Case Study IV            painting should be the goal of the photographer. In other
                                                                     words, the photographer should be careful not to image the
                                                                     painting with a specific reproductive purpose in mind. After
                                                                     a painting is imaged and the raw data stored, derivatives can
                                                                     then be made in the form of reproductions.

                                                                                         Acknowledgements
                                                                          This research was supported by the Andrew W. Mellon
                                                                     Foundation and would not have been possible without the
                                                                     cooperation and assistance of the four case-study
  Figure 6. Depth of field results comparison of the case studies.
                                                                     institutions.

                                                                                               References
                        Further Details                              1.   Paul Conway, Handbook for Digital Projects: A Management
                                                                          Tool for Preservation and Access, Northeast Document
     A research project, of which this research was a part,
                                                                          Conservation Center, Andover, MA, 2000, First Edition, Ch.
entitled “Direct Digital Image Capture of Cultural Heritage
                                                                          2.
– Benchmarking American Museum Practices and Defining
                                                                     2.   Anne R. Kenney, Moving Theory into Practice: Digital
Future Needs,” also surveyed American museums about
                                                                          Imaging for Libraries and Archives, Research Libraries
their involvement with digital photography and performed
                                                                          Group, Mountain View, CA, 2000, Ch. 3.
six American museum on-site case study interviews to
                                                                     3.    P. L. Vora and H. J. Trussell, Measure of Goodness of a Set
document their current digital-imaging workflows.7 See
                                                                          of Color Scanning Filters, J. Opt. Soc. Am. A, 10, 8-23 (1993).
www.cis.rit.edu/museumSurvey for more details about the
                                                                     4.   ISO 15739: Photography - Electronic still-picture imaging -
findings of this project.
                                                                          Noise measurements, 2003, First Edition.
     A full report, in the form of a Master’s thesis8 contains
                                                                     5.   Peter Burns, Slanted-Edge MTF for Digital Camera and
a review of standards, a detailed description of how each
                                                                          Scanner Analysis, Proc. IS&T PICS, pg. 135-138. (2000).
case study was performed at the museum, a detailed
                                                                     6.    Peter Burns, and Don Williams, Using Slanted-Edge Analysis
description of how the data was analyzed, the results of each
                                                                          for Color Registration Measurement, Proc. IS&T PICS, pg.
case study, and a comparison of the four case studies.
                                                                          51-53. (1999).
                                                                     7.    M. R. Rosen and F. S. Frey, RIT American Museums Survey
                          Conclusions                                     on Digital Imaging for Direct Capture of Artwork, Proc.
                                                                          IS&T Second Archiving Conference, pg. xx-xx, (2005).
     The testing procedure described here can be used to
                                                                     8.    Erin P. Murphy, A Testing Procedure to Characterize Color
provide objective measures of a range of performance
                                                                          and Spatial Quality of Digital Cameras Used to Image
characteristics of digital-camera systems and workflows,
                                                                          Cultural Heritage, Rochester Institute of Technology,
which are used in cultural heritage institutions to document
                                                                          Rochester, NY, 2005.
archival quality digital master reproductions of their
painting collections. Cultural heritage institutions can store
future characterization data as metadata with their images.
                                                                                               Biography
Also, digital camera manufacturers can use this
                                                                         Erin P. M. Smoyer received her B.S. degree in Imaging
characterization data to see where imaging systems need
                                                                     and Photographic Technology from the Rochester Institute
improvements for cultural heritage applications.
                                                                     of Technology in 2002 and her M.S. degree in Color
     As a result of these case studies, many differences were
                                                                     Science recently at the Munsell Color Science Laboratory,
discovered among their current digital-imaging practices,
                                                                     also at the Rochester Institute of Technology. She is
which points out the need for standardization in American
                                                                     currently a Color Scientist Engineer at Texas Instruments in
museums. None of the four museum case studies had the
                                                                     Plano, TX working on DLPTM products research.
best results for all of the quality parameters tested.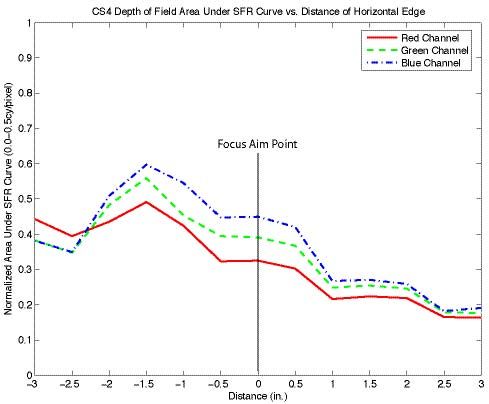
You can also read