Calculation of Trip Generation of Industrial Activities Around Legok Street in Tangerang District - IJICC
←
→
Page content transcription
If your browser does not render page correctly, please read the page content below
International Journal of Innovation, Creativity and Change. www.ijicc.net
                               Volume 13, Issue 3, 2020

Calculation of Trip Generation of
Industrial Activities Around Legok
Street in Tangerang District
           Ken Martina Kasikoena, Syafwandib, Rahmi Hardiyanic, Siti Lisnawatid,
                      a                                b
           Email:       ken.martina@esaunggul.ac.id,     h.syafwandi13@gmail.com,
           c                            d
             rahmihrdyni14@gmail.com, sitilisnawati12@gmail.com

              Currently the industrial activities are the main sector in supporting the
              Indonesian economy. The trend of development of industrial estates is
              very high in Indonesia, and has been responded to positively by
              respective local governments who have provided locations for the
              industrial estates. However, there are still many industrial estates that
              have locations mixed with other activities, even those located on the
              main road. As a consequence, not only does it impact the surrounding
              economy and environment, but it also impacts the surrounding traffic.
              Considering industrial activities are trip generators, they cause traffic
              jams, delays, air pollution and noise. To date there has not been any
              reference for trip generation or the overall land usage for various types
              of activities, including trip generation of industrial activities in which
              their locations are mixed with other activities such as industrial
              activities located on Legok Street. Based on the results of traffic
              counting analysis in the busy hours, the level of service (LOS) of Legok
              Street is in the D classification (bad) with the value of 0.89 marked by
              unstable traffic. One of the causes of the bad level of service is the very
              high number of vehicles of the industrial activities e.g. 239 pcu/hour.
              That number is far above Industrial Ministry predictions as written in
              the Minister of Industry Regulation No. 40, 2016 regarding Technical
              Guidance for Industrial Estate Development. Therefore, supporting road
              services is required. Although the research survey was during peak
              hours, the results can be used as consideration in spatial planning.
              Results of this research in general may be used as reference in planning
              an industrial estate in other locations with similar characteristics, and
              may also be used to solve the transportation problems in the Legok main
              road.

 Keywords: Calculation, Trip Generation, Traffic Counting, Land Use, Industrial
 Activities.

                                         1051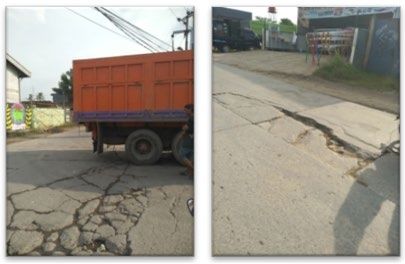
International Journal of Innovation, Creativity and Change. www.ijicc.net
                                   Volume 13, Issue 3, 2020

Introduction

Currently industrial activities are the primary sector supporting the Indonesian economy. This
has been the case since 1980, when agricultural activities shifted from being the main economic
activities (Efendi, T, 2006). Development of industrial estates was considered to be able to
distribute welfare more evenly to the whole of Indonesia (Kemenperin, 2016). Data from the
Central Statistic Bureau noted that in 2017 economic activities in Indonesia grew by 5.07%
with a Gross Domestic Product (GDP) value of RP 13,588.8 trillion. From this number, the
processing industry contributed RP 2,739.4 trillion, or around 20.16% of GDP value. In spite
of the decline, in 2019 the processing industry managed to contribute 19.70% of GDP. The
principle business of the processing industry in Indonesia is manufacturing. This sector is the
main supporting sector of current national economic growth (Kemenperin, 2018). Besides food
and drink, there are seven primary manufacturing sectors which are base metal, transportation
means, engine and equipment, chemical, pharmaceutical and electronic.

Many industrialised countries in the world have a high Gross Domestic Product (GDP), such
as China, USA, India, Japan, Germany, Russia and Indonesia (IMF 2019 in CNBC Indonesia,
2019). To elevate GDP, every country is keen to develop their industry. Indonesia, having
abundant natural resources, is very eager to develop its industry. Indonesia, which previously
was an agricultural country, has shifted to being an industrial country. Compared to industry,
agriculture contributes less to GDP. In 2017 agriculture contributed 13.16% to the GDP and
this was down to 12.72% in 2019.

So far natural resources in Indonesia tend to be exported as raw materials, thus do not give any
added value to Indonesia nor to the local government where the natural resources are located.
Currently the investor interest to develop local industrial estates is significantly high. This trend
is greeted by the local governments by providing locations for the industrial estates. However,
there are still many industrial estates that have locations mixed with other activities, even
located on the main road. As a consequence, not only does it impact the surrounding economy
and environment, but it also impacts to the surrounding traffic. Considering industrial activities
are trip generators, they cause traffic jams, delays, air pollution and noise (Patel, 2017).
Therefore, in industrial estate development, analysis of trip generation is required.

Trip generation depends on two aspects, e.g. type of land use, and the number and intensity of
activities on the concerned land (Tamin, 2000). Trip generation caused by land use activities
and the number of movements is affected by the land use intensity (Iriawan, 2015). Further,
Escamilla et al., (2016) stated that trip generation has a strong relationship with type of land
use.

                                               1052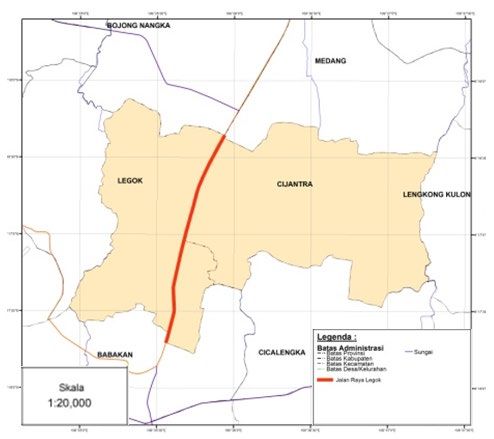
International Journal of Innovation, Creativity and Change. www.ijicc.net
                                   Volume 13, Issue 3, 2020

There are various types of land use that generate trips. Industrial activity is one of the activities
that generates a high amount of trips. The industrial sector can provide more added value to
the business and investment opportunities, therefore its activities can generate movement and
affect traffic volume. (Feby, 2014). In Indonesia, industrial activities are divided into six
groups of activities e.g agro industry; chemical, textile and various industries; metal,
machinery, transportation and electronics industries; small and medium industries; industrial
estate; intellectual property industry, living environment and standardisation (Permenparin,
2017). To date there has not been any reference in regard to trip generation of various types of
activities and land use, including trip generation of industrial activity. This condition is caused
by the many types of industry and levels of intensities, not to mention that trip generation
calculation of industrial activities is greatly required as it can help to predict the number of
vehicles generated by industrial activities (Patel, 2017).

Results of spatial planning, among others, are descriptions of land use Should reference of trip
generation for every type of land use be available, especially for existing industrial activity,
trip generation of every industrial activity land use plan may be predicted. Volume of vehicles
that would take place may be predicted in such that transportation problems that may arise may
be anticipated in the early stages. There are industrial estates that are purely for industrial
activities, nevertheless there are also industrial activities mixed with other activities (such as
trading, education and etc). Trip generation arising from those two conditions will have
different impacts on the surrounding traffic conditions.

Tangerang Regency is one of the regencies located in the Banten Province. It is undergoing
development of industrial activities in accordance with development of industrial areas in the
city of Tangerang. Among others, the considerably dominant developing area is located
surrounding Legok Street situated in between two villages and two districts e.g. Legok Village
in Legok District and Cijantra Village in Pagedangan District (see Picture 1). Legok Street has
two lanes in the section of ± 3km long, with a width of 7m, and roadsides in the right and left
of 0.5m each. It is the road connecting Tangerang City and Bogor Regency. There are 16
(sixteen) industrial activities in the form of industrial estates, factories and warehousing with
an average space of 2 Ha. They comprise packaging industry, foam factories, concrete
prefabrication and paint factories. Those industrial activities located in the area are mixed with
residential, trading and educational areas. Every industrial activity generates trips by labour
vehicles as well as material transportation by heavy equipment. The resulting vehicles added
with other vehicles of other activities in the area, plus through traffic, cause traffic jams on
Legok Street.

In accordance with the Local Regulation of Tangerang Regency No. 13, 2011 regarding Spatial
Planning of Tangerang Regency 2011 – 2031, the industrial area in Legok and Pagedangan is
one of the areas to be developed as a medium industrial area. For preparing the concerned

                                               1053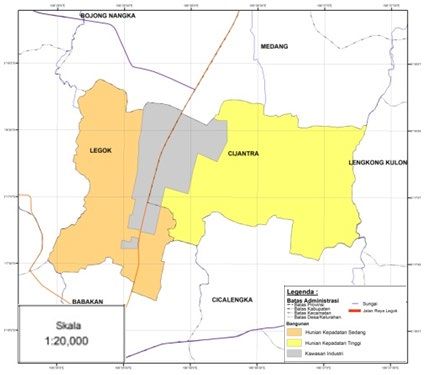
International Journal of Innovation, Creativity and Change. www.ijicc.net
                                   Volume 13, Issue 3, 2020

industrial area, calculation of trip generation of the industrial activity of the surrounding Legok
Street is greatly required. The purpose of this study is to calculate trip generation of industrial
activity, the location of which is mixed with other activities in the surroundings of the Main
Road of Legok. The results of which may be used to solve transportation problems of the Main
Road of Legok and may also be used as a reference in planning any industrial estate in other
location with similar characteristics.

Picture 1. Map of Studied Location

Source: Results of Analysis, 2019

Literature Review
Trip Generation

Trip generation is a modelling stage which predicts the total movements originating from one
zone or one land use, or the total movement attracted to one zone or one land use (Tamin,
2000). Trip generation is the total number of trips that take place at a time in one zone of land
use (Hobbs, 1995). The traffic problems such as traffic jams and delays are caused by trip
generations that take place at the same time, resulting in a high traffic load (Fitira, 2015). To
tackle these problems, analysis of the resulting trip generation and trip attraction is required
(Hasriani, 2015).

                                              1054
International Journal of Innovation, Creativity and Change. www.ijicc.net
Volume 13, Issue 3, 2020
Road performance
According to Manual Kapasitas Jalan Indonesia or MKJI (Highway Capacity Manual
Indonesia) 1997, it is stated that calculation for a city road performance indicator covers traffic
volume, capacity and level of service. In MKJI 1997, Direktorat Jenderal Bina Marga
Direktorat Bina Jalan Kota, stated that traffic volume is the number of vehicles passing a certain
point at a section of road in a certain unit. Two-way traffic volume at the busiest time in a day
is used as the basis of analysis of performance of the concerned section of road and concerned
crossing. Traffic volume (Q) is stated in the equation:
Q = (MC x emp MC) + (LV x emp LV) + (HV x emp HV)
Urban road capacity is obtained by the equation (Tamin, 2008):
C = CO x FCW x FCSP x FCSF x FCCS
Where
C : Capacity (pcu/hour)
CO : Basic Capacity (pcu/hour)
FCW : Adjustment factor of traffic wide lane
FCSP : Adjustment factor of directional separator
FCSF : Adjustment factor of side barriers
FCCS : Adjustment factor of city size
Level of Service (LOS)
The Transportation Research Board in Khisty and Lall (2005), states that every facilities may
be evaluated based on six levels of services from A to F, where A represents the best operational
condition whereas F represents the worst. According to Louis J Pignataro (1973), characteristic
evaluation of level of service is based on V/C ratio, where V is traffic volume (pcu/hour) and
C is capacity (pcu/hour).
Table 2: Characteristic Evaluation of the great of service
Service Level Related Operating Characteristics
A Free flow
B Stable flow (for intercity road planning)
C Stable flow (for city road planning)
D Flow starting unstable
E Unstable flow
F Restricted flow
Source: MKJI, 1997
1055International Journal of Innovation, Creativity and Change. www.ijicc.net
Volume 13, Issue 3, 2020
Trip Generation and Trip Attraction
Trip generation is a modelling stage which predicts the total number of movements originating
from a zone or a land use and the total number of movements attracting to a zone or a land use.
Traffic flow is a function of a land use which generates traffic flow (Tamin, 2008)
Picture 2. Generation and Attraction
Source: Tamin, 1997
Land use and transportation
In its modelling, transportation systems and land use contain two variables, independent
variables and dependent variables which can be identified and measured (Black, 1981 in Miro,
2005). Independent variables may be in the form of a transportation system, i.e. travel time,
transportation costs, services, convenience, security, reliability, availability, land use i.e
industrial estate, housing estate, etc; social variables i.e. total population, employment
opportunities, education etc.
Criteria of Road Network Serving Industrial Activities
Based on Industrial Minister Regulation No. 40, 2016 regarding Technical Guidance for
Developing Industrial Estate, road networks for industrial activities have a vital function
facilitating movement mobility and accessibility. A good road network design for industrial
activity has to consider capacity and total number of vehicles that would pass the roads in such
that it may anticipate in the early stages the risk of road breakage and traffic jams. This is
crucial, as based on experience, impacts of industrial activities to local transportation are not
easy to be anticipated.
Development of an industrial estate would have a big external impact on the surrounding area.
Industrial estate development will generate trips significantly due to labour transportation as
well as material freight. Industrial Minister Regulation No. 40, 2016 stated that an industrial
estate of the size of 100 HA would generate total passenger trips and freight trips of 450
pcu/day + 100 pcu/day = 550 pcu/day. Therefore, trip generation of total passengers and freight
1056International Journal of Innovation, Creativity and Change. www.ijicc.net
Volume 13, Issue 3, 2020
for 1 hectare would be 5.5 pcu/day/hectare. Even if trip generation of an industrial estate is not
that large, available high quality road is needed because the vehicles that would pass the road
are heavy vehicles.
Selection of Industrial Types
Prior to conducting the analysis, a sample of industry activities of the whole industry located
on Legok Street is determined. Sample taking is done based on the type of existing industry;
the results there are 4 (four) industry types that may represent industry activities in that area
e.g. packaging industry, concrete pre-fabricating, foam factories and paint factories as seen in
Table 3 below.
Table 3: List of Industry Sorrounding Legok Street
No Company Industrial Type
1 A packaging design *
2 B foam management *
3 C Molding
4 D Paint
5 E Foam
6 F Foam
7 G Packaging
8 H paint production *
9 I concrete manufacturing *
10 J Packaging
11 K Packaging
12 L Panel
13 M Concrete prefab
Source: Survey result, 2019. *type of industry used as sample
Following, in Table 4 is use of variable, indicator and parameter
Table 4: Variable, Indicator and Parameter
Variable Indicator Parameter
The number of vehicles through one
Volume observation point during the current time
period
Maximum current traffic through a point
Performance of the road Capacity
on the road at a certain time
The ability of roads and / or intersections
Level of service to accommodate traffic in certain
circumstances
The area of sample industrial activity
Land Area
samples
1057International Journal of Innovation, Creativity and Change. www.ijicc.net
Volume 13, Issue 3, 2020
Variable Indicator Parameter
Number of vehicles originating by
Generation
industrial activities
Traffic
Number of vehicles to industrial activities
Attraction
location
Source: Analysis and literature study, 2019
Description of the Study Area
Legok Street is a main road as a secondary collector road under the authority of the Tangerang
Regency Government which is used for various activities such as the movement of people and
goods. Legok Street is an industrial estate within Tangerang Regency. Based on the
observation, several spots of this main road are cracked and have holes and lose gravel on the
road surface which may endanger the passing vehicles (see Picture 3). Besides, when raining
the main road of Legok is flooded and the holes are significantly deep. The breakage of the
road is caused by heavy vehicles passing on it. Generally, those vehicles carry industry
materials and raw materials to the factories as well as products going out of the factories for
distribution to the markets.
Picture 3. Condition of the Legok Street
Source: Survey Documentation, 2019
Land Use
1058International Journal of Innovation, Creativity and Change. www.ijicc.net
Volume 13, Issue 3, 2020
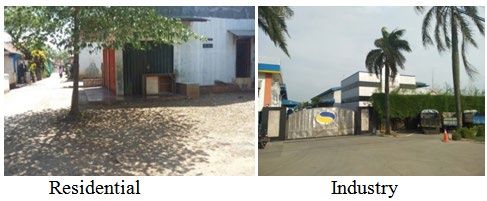
Surrounding Legok Street are 3 (three) types of land use: high density land use, residential with
medium density, and industrial area (see Picture 4). Land use for commercial use is mixed with
residential. Land use in the studied area is dominated by high density residential use e.g 51%
(see Table 5)
Table 5: Size of Land Use
Land Use Area (Ha)
High Density Residential 7,678.80
Medium Density Residential 7,085.55
Industrial Estate 316.13
Source: Profile of Legok and Cijantra Villages, 2018
Picture 4. Map of Land Use in the Studied Area
Source: Result of Analysis, 2019
Picture 5. Residential and Industry Land Use
1059International Journal of Innovation, Creativity and Change. www.ijicc.net
Volume 13, Issue 3, 2020
Source: Survey Documentaion, 2019
Population
In 2018, the total population of the two villages, Legok and Cijantra was 26,292 (see Table 6)
and 60% of the population was women. The average growth of the population was 3.62% per
year for 4 years in a row from 2014 to 2018. This was partly due to the impact of people
moving.
Table 6: Total population in the Studied Location
Year Total Population
2014 22,802
2015 23,706
2016 24,565
2017 25,391
2018 26,292
Source: Legok District in Figure and Pagedangan District in Figure
Traffic Counting
Prior to conducting trip generation calculation and investigating its level of service, traffic
counting was done to investigate types of vehicles passing Legok Street. A traffic survey is
conducted by calculating the total number of vehicles during peak hours of 08.00am – 11.00am
assuming that this time represents the problematic traffic conditions, Picture 6 illustrates the
traffic counting positions; whereas results of the traffic survey of Legok Street are shown in
Table 7.
1060International Journal of Innovation, Creativity and Change. www.ijicc.net
Volume 13, Issue 3, 2020
Picture 7. Illustration of Locations of Traffic Counting
Source: Result of Analysis, 2019
Table 7: Traffic Counting at Legok Street
Karawaci – Legok Legok – Karawaci
MC LV HV MC LV HV
Time
(Motorcy (Light (Heavy (Light (Heavy
(Motorcycle)
cle) Vehicle) Vehicle) Vehicle) Vehicle)
08:00 -
508 141 64 607 158 54
08:15
08:15 -
493 134 57 578 158 52
08:30
08:30 -
422 126 68 392 130 58
08:45
08:45 -
334 99 48 426 103 46
09:00
09:00 -
261 48 17 249 55 14
09:15
09:15 -
197 22 32 215 73 29
09:30
09:30 -
135 40 41 211 80 33
09:45
09:45 -
148 41 41 200 70 35
10:00
1061International Journal of Innovation, Creativity and Change. www.ijicc.net
Volume 13, Issue 3, 2020
10:00 -
174 47 37 175 56 28
10:15
10:15 -
147 44 36 177 46 21
10:30
10:30 -
126 51 37 197 58 23
10:45
10:45 -
113 46 40 182 75 26
11:00
Source: Result of Survey, 2019
Picture 7. Chart of Traffic Counting in the Study Area at 8:00am to 11:00am
Performance Analysis of the Road
Peak hours in Legok Street at 08:00 – 09:00 in the morning are the time people start their
activities. Traffic volume at peak hours in Legok Street is 4,270 pcu/hour.
Table 8: Traffic Volume at 8.00 – 9.00
Type of Vehicles Volume (pcu/hour)
Motorcycle 1880
Car 955
Public Transport 94
Heavy Vehicles 1341
Total 4270
Source: Result of Analysis, 2019
1062International Journal of Innovation, Creativity and Change. www.ijicc.net
Volume 13, Issue 3, 2020
The level of service of Legok Street at peak hour is calculated by 4270/4756, and the result is
0.89. This level of service is in category D which is an unstable traffic condition.
Calculating Trip Generation Industrial Activity in Legok Street
For calculation of trip generation of industrial activities mixed with other activities, traffic
counting is done at the entrance gate of the respective factories for vehicles that enter and exit
all the factory samples, which were a packaging factory, a foam factory, concrete fabrication
and a paint factory. The results are shown in table 9 to 12.
Table 9: Results of TC in Packaging Industry
Type of Vehicles
Time Motorcycle (MC) Light Vehicle (LV) Heavy Vehicle (HV)
Exit Entry Exit Entry Exit Entry
08:00 - 08:15 48 67 5 2 9 6
08:15 - 08:30 35 32 3 4 14 9
08:30 - 08:45 27 10 4 5 15 13
08:45 - 09:00 13 10 6 3 16 8
09:00 - 09:15 6 9 2 0 10 11
09:15 - 09:30 5 3 1 1 6 6
09:30 - 09:45 7 5 3 0 11 11
09:45 - 10:00 5 3 1 4 10 9
10:00 - 10:15 2 1 2 0 7 5
10:15 - 10:30 5 0 1 3 5 3
10:30 - 10:45 4 0 7 1 10 5
10:45 - 11:00 9 1 0 0 5 4
Source: Result of Survey, 2019
1063International Journal of Innovation, Creativity and Change. www.ijicc.net
Volume 13, Issue 3, 2020
Table 10: Results of TC at Foam Factory
Type of Vehicles
Time Motorcycle (MC) Car (LV) Heavy Vehicle (HV)
Exit Entry Exit Entry Exit Entry
08:00 - 08:15 35 38 7 10 3 1
08:15 - 08:30 27 29 4 6 4 2
08:30 - 08:45 12 14 2 1 7 5
08:45 - 09:00 8 13 1 1 6 8
09:00 - 09:15 2 3 4 1 8 2
09:15 - 09:30 4 3 4 0 4 5
09:30 - 09:45 0 1 1 0 4 3
09:45 - 10:00 3 1 2 1 3 2
10:00 - 10:15 4 5 5 3 7 2
10:15 - 10:30 3 3 3 2 2 5
10:30 - 10:45 2 1 6 2 7 1
10:45 - 11:00 5 3 4 1 4 6
Source: Result of Survey, 2019
Table 11: Results of Traffic Counting at Concrete Fabrication Industry
Type of Vehicles
Time Motorcycle (MC) Car (LV) Heavy Vehicle (HV)
Exit Entry Exit Entry Exit Entry
08:00 - 08:15 9 11 4 3 2 1
08:15 - 08:30 8 4 3 5 4 0
08:30 - 08:45 3 2 2 0 3 1
08:45 - 09:00 2 3 2 0 3 0
09:00 - 09:15 3 1 1 0 2 1
09:15 - 09:30 1 0 0 0 8 3
09:30 - 09:45 5 2 3 1 6 4
09:45 - 10:00 4 3 1 1 3 1
10:00 - 10:15 8 2 2 1 5 2
10:15 - 10:30 2 1 2 0 6 4
10:30 - 10:45 4 2 1 1 4 3
10:45 - 11:00 6 3 1 1 2 0
Source: Result of Survey, 2019
1064International Journal of Innovation, Creativity and Change. www.ijicc.net
Volume 13, Issue 3, 2020
Table 12: Results of Traffic Counting at Paint Factory
Type of Vehicles
Motorcycle
Time Car (LV) Heavy Vehicles (HV)
(MC)
Exit Entry Exit Entry Exit Entry
08:00 - 08:15 22 24 5 7 1 2
08:15 - 08:30 11 17 6 9 4 2
08:30 - 08:45 6 12 2 4 3 1
08:45 - 09:00 8 6 1 2 5 2
09:00 - 09:15 3 2 2 1 4 3
09:15 - 09:30 9 5 4 3 6 5
09:30 - 09:45 2 3 4 2 5 2
09:45 - 10:00 1 4 3 1 5 7
10:00 - 10:15 7 2 5 2 9 2
10:15 - 10:30 6 4 7 3 5 1
10:30 - 10:45 3 1 2 3 4 2
10:45 - 11:00 7 3 6 5 5 2
Source: Result of Survey, 2019
Table 13: Total Number of Movement and Land Size at Industrial Activities at Shift Hours
Total Movement
No Industry Shift Hours Land Size (Ha)
(Pcu/hour)
Packaging Industry 423 22.76
1 Exit 241,5 08:00am – 09:00am
Entry 181,5
Foam Industry 228 3.37
2 Exit 115 08:00am – 09:00am
Entry 113
Concrete 0.59
Fabrication 82
3 Industry 08:00am – 09:00am
Exit 57
Entry 25
4 Paint Industry 149 08:00am – 09:00am 0.69
1065International Journal of Innovation, Creativity and Change. www.ijicc.net
Volume 13, Issue 3, 2020
Total Movement
No Industry Shift Hours Land Size (Ha)
(Pcu/hour)
Exit 76,5
Entry 72,5
Total 882 882 27.41
Source: Result of Survey, 2019
Table 14: Total Number of Movement and Land Size at Industrial Activities at Operating
Hours of Heavy Vehicles
Total Movement Operating Time of Size of Land
No Industry
(Pcu/Hour) Heavy Vehicles (Ha)
Packaging Industry 335 22.76
1 Exit 184 08:30 – 09:30
Entry 151
Foam Factory 179 3.37
2 Exit 99 08:30 – 09:30
Entry 79,5
Concrete 0.59
118
Fabrication
3 08:30 – 09:30
Exit 81
Entry 36,5
Paint Factory 165 0.69
4 Exit 100 08:30 – 09:30
Entry 65
Total 797 797 27.41
Source: Result of Survey, 2019
1066International Journal of Innovation, Creativity and Change. www.ijicc.net
Volume 13, Issue 3, 2020
Table 15: Total Number of Vehicle Movements per hectare at Labour Shifting Time
Total Number of Size of Land Use Total Movement
Type of Industry Movement on (Ha) (PCU /Ha)
Shifting Time
Packaging Industry 423 22.76 18
Foam Factory 228 3.37 67
Concrete Fabrication 82 0.59 138
Paint Factory 149 0.69 215
Source: Result of Calculation 2019
Table 13 shows that trip generation resulting from labour vehicles of the paint factory have the
biggest total number, e.g. 215 pcu/hour; whereas those of the packaging industry are the
smallest, e.g. 15 pcu/hour
Table 16: Number of Total Movements per hectare at The Time Heavy Vehicle Operating
Number of Total
Movements When Size of Land Use Total Number of
Type of Industry
Heavy Vehicle (Ha) Movements /Ha
Operating
Packaging Industry 335 22.76 15
Foam Factory 179 3.37 53
Concrete Fabrication 118 0.59 200
Paint Factory 165 0.69 239
Source: Result of Calculation 2019
Table 14 shows that trip generation of heavy vehicles of the paint factory is the biggest, e.g.
239 pcu/hour; whereas those of the packaging industry are the smallest, e.g. 15 pcu/hour.
It is noticeable that trip generation during labour shifting time, from 8.00am to 8.30am, is the
highest in every type of industry. In relation to the results of the traffic counting above, where
the highest traffic volume is from 8.00am to 8.30am, trip generation by the factories have a
large impact onthe traffic.
Conclusion
• Having conducted direct observation in the study area and having processed and analysed
the obtained data, it is found that performance of Legok Street is bad. This fact is proved
by the calculated value of level of service of 0.89
• Trip generation of the sample industrial activities is very high, reaching a high value of 239
pcu/hour at the time of heavy vehicle operation.
1067International Journal of Innovation, Creativity and Change. www.ijicc.net
Volume 13, Issue 3, 2020
• The high numbers of trip generation influence the level of service of the road section. As
time goes by population increases, so does the level of activities, therefore it will influence
the level of movements. Bad quality road may not support industry activities as well,
therefore action needs to be taken to the concerned section of road in such that it may
support industry activities optimally.
Suggestion
Based on the conclusions above, suggestions forwarded are as follows:
• Upgrading the road capacity on Legok Street;
• Reducing the volume of vehicles by providing labour buses;
• Improving traffic condition through a Transportation Management System;
• Considering relocation of any activity that generates high trips.
1068International Journal of Innovation, Creativity and Change. www.ijicc.net
Volume 13, Issue 3, 2020
References
CNBC Indonesia. https://www.cnbcindonesia.com/market/20190930185655-20-103299/ini-
10-negara-dengan-pdb-terbesar-di-dunia-ri-urutan-berapa. (diakses, 06 februari 2020)
Efendi, T. (2006). Perencanaan Pembangunan Daerah Bidang Pertanian. Perencanaan
Pembangunan Daerah Universitas Brawijaya.
Escamilla, J., Cos, C., Cardenas, J., 2016.Contesting Mexico City’s alleged polycentric
condition through a centrality mixed land-use composite index. Urban Studies 53 (11),
2380-2396
Hobbs, F.D, 1995, Perencanaan dan Teknik Lalu Lintas, Penerbit Gadjah Mada University
Press
Jayasinghe, A., Sano, K., & Rattanaporn, K. (2017). Application For Developing Countries:
Estimating Trip Attraction in Urban Zones Based on Centrality. Journal of Traffic and
Transportation Engineering (English Edition)
Jenis-Jenis Industri di Lingkungan Kementrian Perindustrian. Peraturan Menteri Perindustrian
Republik Indonesia Nomor 30/M-IND/PER/7/2017
Khisty, C. J. dan Lall, B. K. 2005.Dasar-dasar Rekayasa Transportasi.Jakarta : Erlangga
Kemenperin. https://kemenperin.go.id/artikel/18978/Manufaktur-Jadi-Penopang-Utama-
Ekonomi. (diakses, 05 februari 2020)
Kemenperin. https://kemenperin.go.id/artikel/19942/Pemerintah-Fokus-Perkuat-
Industrialisasi. (diakses, 05 februari 2020)
Manual Kapasitas Jalan Indonesia. Departemen Pekerjaan Umum Direktorat Jenderal Bina
Marga. 1997.
Mathew, T. V, & Rao, K. V. K. (1979). Introduction To Transportation Engineering.
Transportation Research Part A: General, 13(2), 135.
Okezone. https://economy.okezone.com/read/2019/01/17/320/2005693/kemenperin-tren-
industri-manufaktur-nasional-membaik. (accessed, the 05th february 2020)
Pedoman Pelaksanaan Kegiatan Manajemen dan Rekayasa Lalu Lintas. Kementerian
Perhubungan. 2015
Pedoman Teknis Kawasan Industri. Kementerian Perindustrian. 2010
Rencana Tata Ruang Wilayah Kabupaten Tangerang Tahun 2011 - 2031. (2011).
1069International Journal of Innovation, Creativity and Change. www.ijicc.net
Volume 13, Issue 3, 2020
Patel Bhargavibahen Vinodbhai, D. K. Kadiya, & Dr. H. R. Varia. (2017). Developing
Industrial Trip Generation Model for Himatnagar Industrial Area. International Journal
of Engineering Research And, V6(04)
Tamin, O. Z. 1997. Perencanaan dan Pemodelan Transportasi. Bandung : ITB Bandung.
Tamin, O. Z. 2000. Perencanaan dan Pemodelan Transportasi. Bandung : ITB Bandung.
Tamin, O. Z. 2008. Perencanaan, Pemodelan dan Rekayasa Transportasi. Bandung : ITB
Bandung.
Tamin, O. Z., & Frazila, R. B. (1997). Penerapan Konsep Interaksi Tata Guna Lahan-Sistem
Transportasi Dalam Perencanaan Sistem Jaringan Transportasi. Jurnal Perencanaan
Wilayah Dan Kota, 8(3), 34–52.
1070You can also read